3220
Reliability Verification and Diagnostic Value Based on Brain Metastases of STAGE at 1.5T1Department of Radiology, Minhang Branch, Fudan University Shanghai Cancer Center, Shanghai, China, 2Neusoft Medical Systems Co.Ltd., Shanghai, China, 3Department of Radiology, Children's Hospital of Fudan University, National Children's Medical Center, Shanghai, China
Synopsis
Keywords: Tumors, Tumor, Brain metastases, Reliability, Quantitative maps
As the first choice to identify brain metastases (BM), the anatomical, functional and metabolic information extracted by various MR sequences is the basis. However, synthetic MR technique mostly relies on expensive equipment and high field strength, which is challenging for primary institutions to implement. In this study, we assessment the reliability and diagnostic value based on BM of Strategically Acquired Gradient Echo (STAGE) at 1.5T. Enhanced T1W map of STAGE showed better GM/WM CNR compare with T1MPRAGE for BM identification. Reliable values and inconspicuous physiological variability were observed in the quantitative maps for various brain tissues.Introduction
Due to effective treatment regimens of primary tumors and advances in imaging techniques, the number of patients with brain metastases (BM) diagnosed by clinicians has increased significantly over the last decades1. As an important examination technology of the central nervous system, MRI is the first choice for BM detection2. Additional anatomical information and specific quantitative values is key to identify BM from other intracranial aetiologies3. However, long scanning time and expensive equipment limit the use of synthetic MRI in primary institutions4,5. In this study, we aim to verify the reliability and diagnostic value based on BM of a rapid imaging technology referred to as Strategically Acquired Gradient Echo (STAGE) at 1.5T6. The details are as follows: (1) The contrast maps were used to calculate CNR; (2) QSM values were used to calculate tissue magnetic susceptibility maps.Methods
Subjects: Eleven healthy subjects (46.55±9.55, 3M), eleven patients with BM (49.64±14.52, 7M) and nineteen patients without BM (50.16±12.37, 2M) participated this study. The primary lesions of these metastases were breast cancer (n=16) and lung cancer (n=4).Imaging protocol: All the subjects were scanned on a NeuMR 1.5T system (Neusoft Medical System, Shenyang, China). The imaging parameters were as follows: (1) magnetization prepared rapid acquisition of gradient echoes (T1MPRAGE): TR/TE=280/5ms; BandWidth=166.67 HZ/pixel; VoxelSize=0.60*0.60*6mm3. (2) STAGE: FA1,2=8°,35°; TR/TE=45/10ms; BandWidth=361.79 HZ/pixel; VoxelSize=0.67*0.67*2.7mm3. Three contrast maps (T1W, PDW and Dark Fluid T2*W), four quantitative maps (T1 map, PD map, R2* and QSM), two vessel maps (SWI and true SWI) and contrast enhanced T1W (eT1W) were derived in about 4 min 30 msec.
Quantitative analysis: Two region-of-interests (ROIs), each containing 6*6 pixels, were annotated on the T1MPRAGE, T1W and eT1W images to quantify deep GM/WM contrast-to-noise ratio (CNR) by a senior neuroradiologist 7. The registration between maps was not required because all maps were acquired in one scan. Automatic segmentation and normalization were performed using SPM12 (http://www.fil.ion.ucl.ac.uk/spm/software/spm12). The probability maps of GM and WM were generated by automatically segmenting T1MPRAGE and T1W respectively for three groups of subjects. Considering the influence of BM with complex location, the results of automatic segmentation, normalization and alignment to atlas were not credible. Only two subgroups (healthy subjects & patients without BM) without cerebral lesions were analyzed to evaluate the reliability of STAGE with reference to previous literatures8,9. The details were as follows, for healthy subgroup and patients without BM, specific regions quantification were executed by normalizing T1 map & QSM into MNI to align with AAL atlas11. The COV was calculated for each tissue as the ratio of standard deviation over the average value.
Statistical analysis: One-way ANOVA test was performed to evaluate the differences of CNR for T1MPRAGE, T1W and eT1W maps.
Results
Figure 1 shows that significant differences were observed among three subgroups. More specifically, CNR of eT1W map was significantly higher than T1MPRAGE and T1W (P<0.001).Figure 2 shows quantitative T1 values and standard deviations of WM, GM, caudate nucleus (CN), putamen (PUT), globus pallidus (GP) and thalamus (THA) in healthy subjects and patients without BM, of which T1 values were comparable to previous studies8,9.
Figure 3 reveals coefficient of variation (COV) values of T1. COV for different regions ranged from 5.32 to 9.60% in healthy subgroup, whereas the range of COV values is 5.11~8.18% in patients without BM.
Figure 4 shows QSM values of PUT, GP, red nucleus (RN) and substantia nigra (SN) in healthy subjects and patients without BM. The quantification of magnetic susceptibility of QSM created by STAGE imaging approach were in line with previous literatures10.
Discussion
GM/WM CNR values of eT1W of the three subgroups were significantly higher than T1MPRAGE and T1W, indicating that the GM/WM contrast of eT1W map in STAGE imaging approach was better. The quantitative values of T1 map in GM, WM and subcortical regions (PUT, CN, THA, GP) were comparable to previous studies8,9. In addition, the range of COV values of healthy subjects and patients without BM were 5.11~9.60%, indicative of inconspicuous physiological variability8. Magnetic susceptibility imaging was very valuable for identifying BM6. The quantitative values of four subcortical regions (PUT, GP, RN and SN) that showed strong paramagnetic shift compared with surrounding tissues were calculated12. QSM values measured by STAGE were in line with results reported in literatures10. Limited by the length of abstract, we will publish the relationship between these quantitative values and the severity of BM or the primary lesions in the future work. In conclusion, our results show that quantitative maps generated by STAGE imaging technique based on 1.5T could offer excellent GM/WM contrast and accurate quantitative information, which may be of great potential in identifying BM.Acknowledgements
No acknowledgement found.References
1. Nolan C, Deangelis LM. Overview of metastatic disease of the central nervous system. Handb Clin Neurol. 2018;149:3-23.
2. Derks SHAE, van der Veldt AAM, Smits M. Brain metastases: the role of clinical imaging. Br J Radiol. 2022;95(1130):20210944.
3. Petrujkić K, Milošević N, Rajković N, et al. Computational quantitative MR image features - a potential useful tool in differentiating glioblastoma from solitary brain metastasis. Eur J Radiol. 2019;119:108634.
4. Tanenbaum LN, Tsiouris AJ, Johnson AN, et al. Synthetic MRI for Clinical Neuroimaging: Results of the Magnetic Resonance Image Compilation (MAGiC) Prospective, Multicenter, Multireader Trial. AJNR. Am J Neuroradio. 2017;38(6):1103-1110.
5. Buonincontri G, Biagi L, Retico A, et al. Multi-site repeatability and reproducibility of MR fingerprinting of the healthy brain at 1.5 and 3.0 T. Neuroimage. 2019;195:362-372.
6. Haacke EM, Chen Y, Utriainen D, et al. STrategically Acquired Gradient Echo (STAGE) imaging, part III: Technical advances and clinical applications of a rapid multi-contrast multi-parametric brain imaging method. Magn Reson Imaging. 2020;65:15-26.
7. Hagiwara A, Hori M, Suzuki M, et al. Contrast-enhanced synthetic MRI for the detection of brain metastases. Acta Radiol Open. 2016;5(2).
8. Pirastru A, Chen Y, Pelizzari L, et al. Quantitative MRI using STrategically Acquired Gradient Echo (STAGE): optimization for 1.5 T scanners and T1 relaxation map validation. Eur Radiol. 2021;31(7):4504-4513.
9. Ma D, Gulani V, Seiberlich N et al (2013) Magnetic resonance fingerprinting. Nature 495:187–192
10. Buch S, Liu S, Ye Y, et al. Susceptibility mapping of air, bone, and calcium in the head. Magn Reson Med. 2015 Jun;73(6):2185-2194.
11. Rolls ET, Huang CC, Lin CP, et al. Automated anatomical labelling atlas 3. Neuroimage. 2020;206:116189.
12. Li W, Wu B, Liu C. Quantitative susceptibility mapping of human brain reflects spatial variation in tissue composition. Neuroimage. 2011 Apr;55(4):1645-1656.
Figures
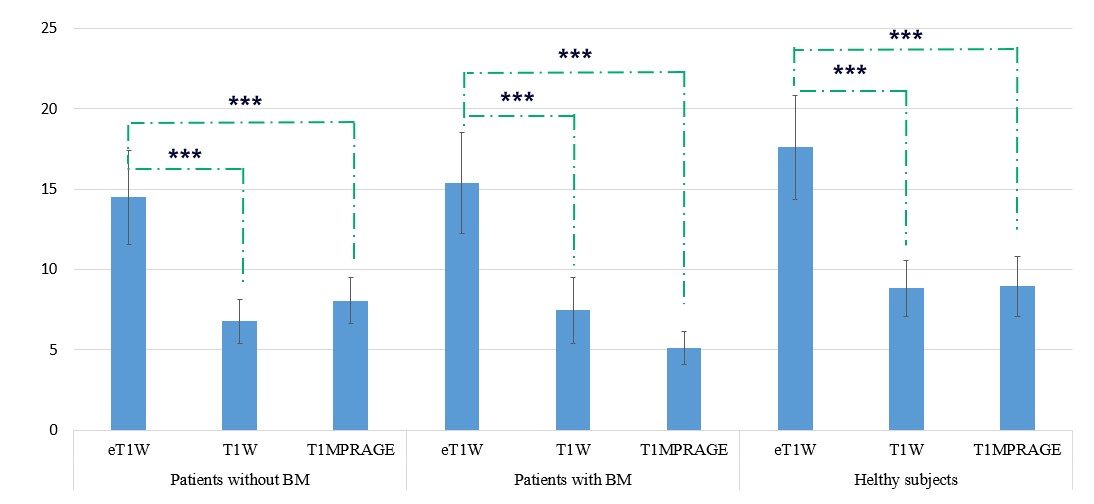
Figure 1. Differences of contrast-to-noise ratio (CNR) in three subgroups. Bars and error bars refer to CNR values and standard deviation for MR images. CNR of eT1W map is highest among all subgroups. While there is no significant difference between CNR of T1W map and T1MPRAGE images (P=0.762). BM, brain metastases; T1MPRAGE, magnetization prepared rapid acquisition of gradient echoes; ‘***’ means P<0.001 for one-way ANOVA test after correction for multiple comparison.
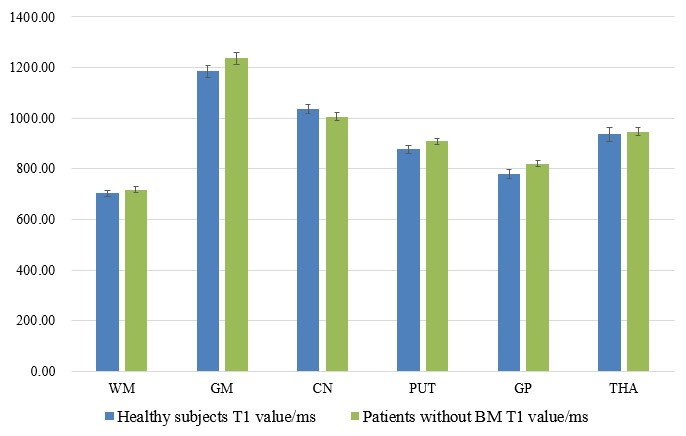
Figure 2. Quantified T1 values of different brain regions in healthy subgroup and patients without BM. Bars and error bars refer to the T1 mean values and standard error for specific regions. BM, brain metastases; STD, standard deviation; WM, white matter; GM, gray matter; CN, caudate nucleus; PUT, putamen; GP, globus pallidus; THA, thalamus.
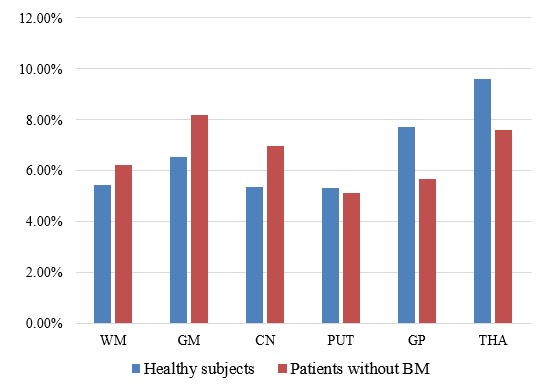
Figure 3. Coefficient of variation (COV) of T1 values in healthy subgroup and patients without BM. COV is distributed between 5.32~9.60% in healthy subgroup. In patients without BM, the range of COV is 5.11~8.18%. BM, brain metastases; WM, white matter; GM, gray matter; CN, caudate nucleus; PUT, putamen; GP, globus pallidus; THA, thalamus.
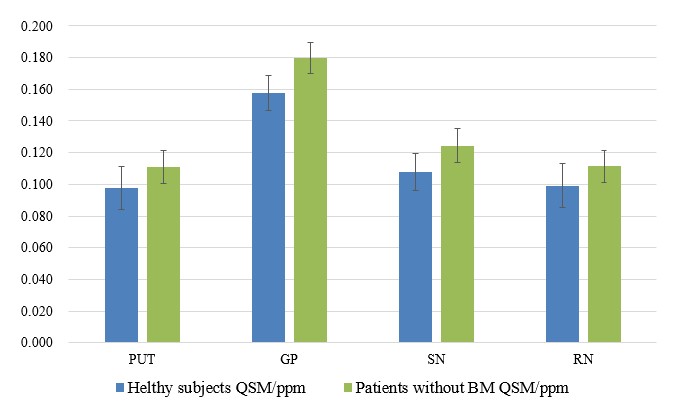
Figure 4. Quantitative susceptibility mapping (QSM) values of different brain regions in healthy subgroup and patients without BM. Bars and error bars refer to the QSM mean values and standard error for specific regions. PUT, putamen; GP, globus pallidus; RN, red nucleus; SN, substantia nigra.