3218
Detection of hormone-producing pituitary microadenoma by Contrast-Enhanced Submillimeter level 3D T1w SPACE: Comparison with 2D T1w Images1Radiology Department, Mesclor Medical Imaging Diagnostic Center, Tianjin, China, 2Medical Imaging Department, Tianjin Fourth Central Hospital, Tianjin, China, 3MR Scientific Marketing, Siemens Healthineers, Beijing, China
Synopsis
Keywords: Tumors, Tumor, pituitary, T1w SPACE
By compared the images quality and diagnostic efficacy of enhanced 3D T1w SPACE and 2D T1w TSE, this study aims to investigate the value of Contrast-Enhanced submillimeter slice 3D T1w SPACE sequence in hormone-producing pituitary microadenoma.Introduction
Pituitary adenomas (PAs) account for approximately 10–20% of all primary intracranial tumors. [1] Magnetic resonance imaging (MRI) has been the preferred imaging modality for the pituitary gland since the 1990s. However, half of all pituitary MRI scans performed in a large patient population yielded no visible lesion [2], especially when the lesions are too small or the traditional MRI images are affected by artifacts. The clinical application of 3D SPACE sequence has been studied in many aspects, including neurology, osteology, angiography, etc.[3-5] However, there are no reports that use 3D T1w SPACE with a thickness of submillimeter level to compare with traditional 2D sequences for the detection of smaller pituitary microadenomas. This study was inspired by the use of 3D T1w SPACE sequence in intracranial high-resolution vascular wall scans. After contrast medium injection, some lesions were found in the pituitary gland that were not shown in traditional 2D sequences.Materials and methods
The institutional review board approved this prospective study, and all patients provided written informed consent. We recruited 8 patients (1 men and 7 women) with elevated hormone levels, including prolactin and growth hormone. All patients were suspected to have pituitary microadenomas but not diagnosed by clinicians or only diagnosed with hyperprolactinemia. One patient with high prolactin, bromocriptine was administered and proved to be effective. All subjects were placed in supine position. All data were collected on 3.0 T scanner (MAGNETOM Skyra, Siemens Healthcare, Germany) through a 20-channel head and neck coil. Routine sequences for pituitary consisted non-enhanced T2w TSE and T1w TSE, enhanced DCE T1w vibe, T1w TSE (sagittal and coronal). Submillimeter level slice(0.6mm)with high resolution 3D T1w SPACE sequence was added to the routine sequences. (Gadoteric Acid Meglumine Salt Injection; Hengrui, Jiangsu, China). Acquisition parameters were as follows: 3D T1w SPACE:FOV = 240 x 210 mm2;Voxel size:0.6×0.6×0.6mm3; TR/TE = 900/14 ms; bandwidth = 512 Hz/Px; Total acquisition time was 7 min 57 s. TSE:FOV=140x140 mm2 , Voxel size:0.3x0.3x2 mm3,TR/TE=400/7.1 ms; Total acquisition time was 2 min 52 s. Two experienced radiologists reviewed and evaluated 2D T1w and 3D T1w SPACE MR images using Syngo MR Version E11 workstation(Siemens Healthcare, Germany). All images are reviewed in random order.2D T1w TSE images were analyzed first, and 3D T1w SPACE images were analyzed two months later. For each study, two neuroradiologists determined the definition of pituitary lesions, and overall image quality. When the pituitary gland has focal low or high signal, pituitary microlesions should be considered on MRI. The above two points were evaluated quantitatively using a five-point confidence scale with the following criteria: excellent=4; good=3; fair=2; poor=1; and non-diagnostic=0. As for image quality, we evaluated the SNR and CNR of the two groups of images respectively. The average signal intensity values of the two regions on sagittal 2D TSE T1w and 3D SPACE T1w were calculated. These two regions include the adenohypophysis region (ROI1) and the area of the lesion (ROI2). Then, the standard deviation of the background signal located in the upper left corner of the images were measured as noise (Fig.1). Finally, SNR (adenohypophysis region) and CNR were calculated and compared. The following mathematical equations were used to calculated SNR and CNR [6] :SNR=(mean signal intensity of the region of interest)/(standard deviation of background signal intensity)
CNR=(SNR of ROI2-SNR of ROI1)/noise
CNR values were not measured in images where no lesions were observed.
Results
The image quality of 8 patients was great, no obvious susceptibility artifacts were found in all SPACE images. (Fig.2) Lesions were clearly observed on T1w SPACE image but were unclear on traditional 2D images. In the cases collected in this study, compared with the traditional T1w TSE sequence, the T1w SPACE sequence has shown obvious advantages in terms of the certainty of the diagnosis of pituitary lesions and image quality. (Table 1-2) All patients were diagnosed with pituitary microadenoma.Conclusion
Contrast-Enhanced Submillimeter level 3D T1w SPACE is a powerful supplement to traditional 2D imaging with elevated hormone levels but undiagnosable primary pituitary tumors. In the future, with the help of 3D reconstruction and accelerated acquisition techniques, it may even be possible to replace the traditional 2D T1 TSE sequence in the application of pituitary microadenoma enhancement. Our next step is to do more research with the help of these two technologies. Unfortunately, we don't have any more data to analyze right now. In the future, we will work with a hospital to collect more patient data.Acknowledgements
Here, the authors would like to express their gratitude to everyone who helped us in this research. Special thanks to Professor Shengzhang Ji, whose guidance helped us avoid twists and turns road. Meanwhile, we would like to thank Chen Zhang for her great help in the writing process.References
[1] Molitch ME. Nonfunctioning pituitary tumors and pituitary incidentalomas. Endocrinol Metab Clin North Am. 2008; 37:151–171.
[2] Pouyan F, Marcel M, and Shlomo M, et al. Pituitary magnetic resonance imaging for sellar and parasellar masses: ten-year experience in 2598 patients. J Clin Endocrinol Metab 2011; 96:1633 – 1641
[3] B Tins, V Cassar-Pullicino, M Haddaway,et al. Three-dimensional sampling perfection with application-optimised contrasts using a different flip angle evolutions sequence for routine imaging of the spine: preliminary experience. Br J Radiol. 2012 Aug; 85(1016): e480–e489.
[4] Qi Y, Zixin D, Xiaoming B,et al. Whole-brain vessel wall MRI: A parameter tune-up solution to improve the scan efficiency of 3D variable-flip-angle turbo spin-echo. J Magn Reson Imaging. 2017 Sep; 46(3): 751–757.
[5] Jinkyeong S, Won-Hee J, Joon-Yong J,et al. Diagnosis of Nerve Root Compromise of the Lumbar Spine: Evaluation of the Performance of Three-dimensional Isotropic T2-weighted Turbo Spin-Echo SPACE Sequence at 3T. Korean J Radiol. 2017 Jan-Feb; 18(1): 249–259.
[6] Reeder S.B. Springer. Measurement of Signal-to-noise Ratio and Parallel Imaging. Parallel Imaging in Clinical MR Applications. 2007 pp. 49–61.
Figures
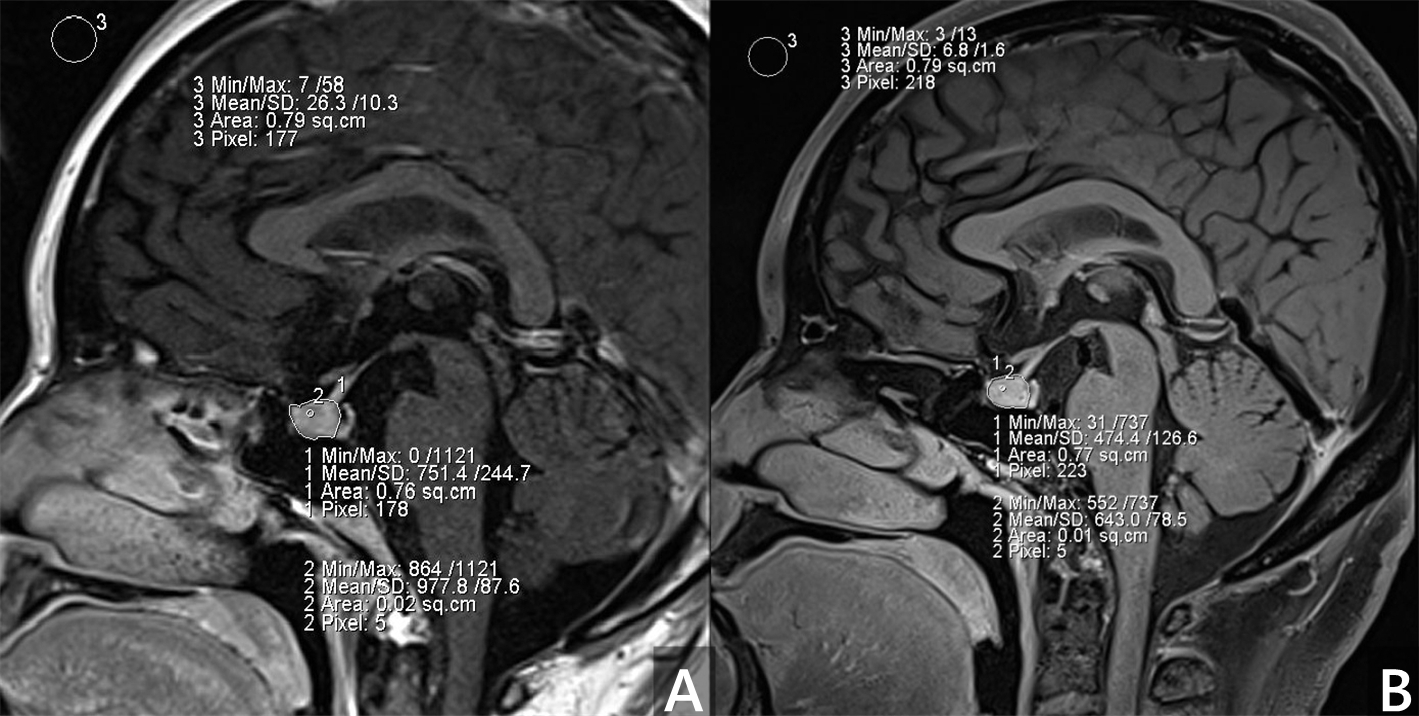
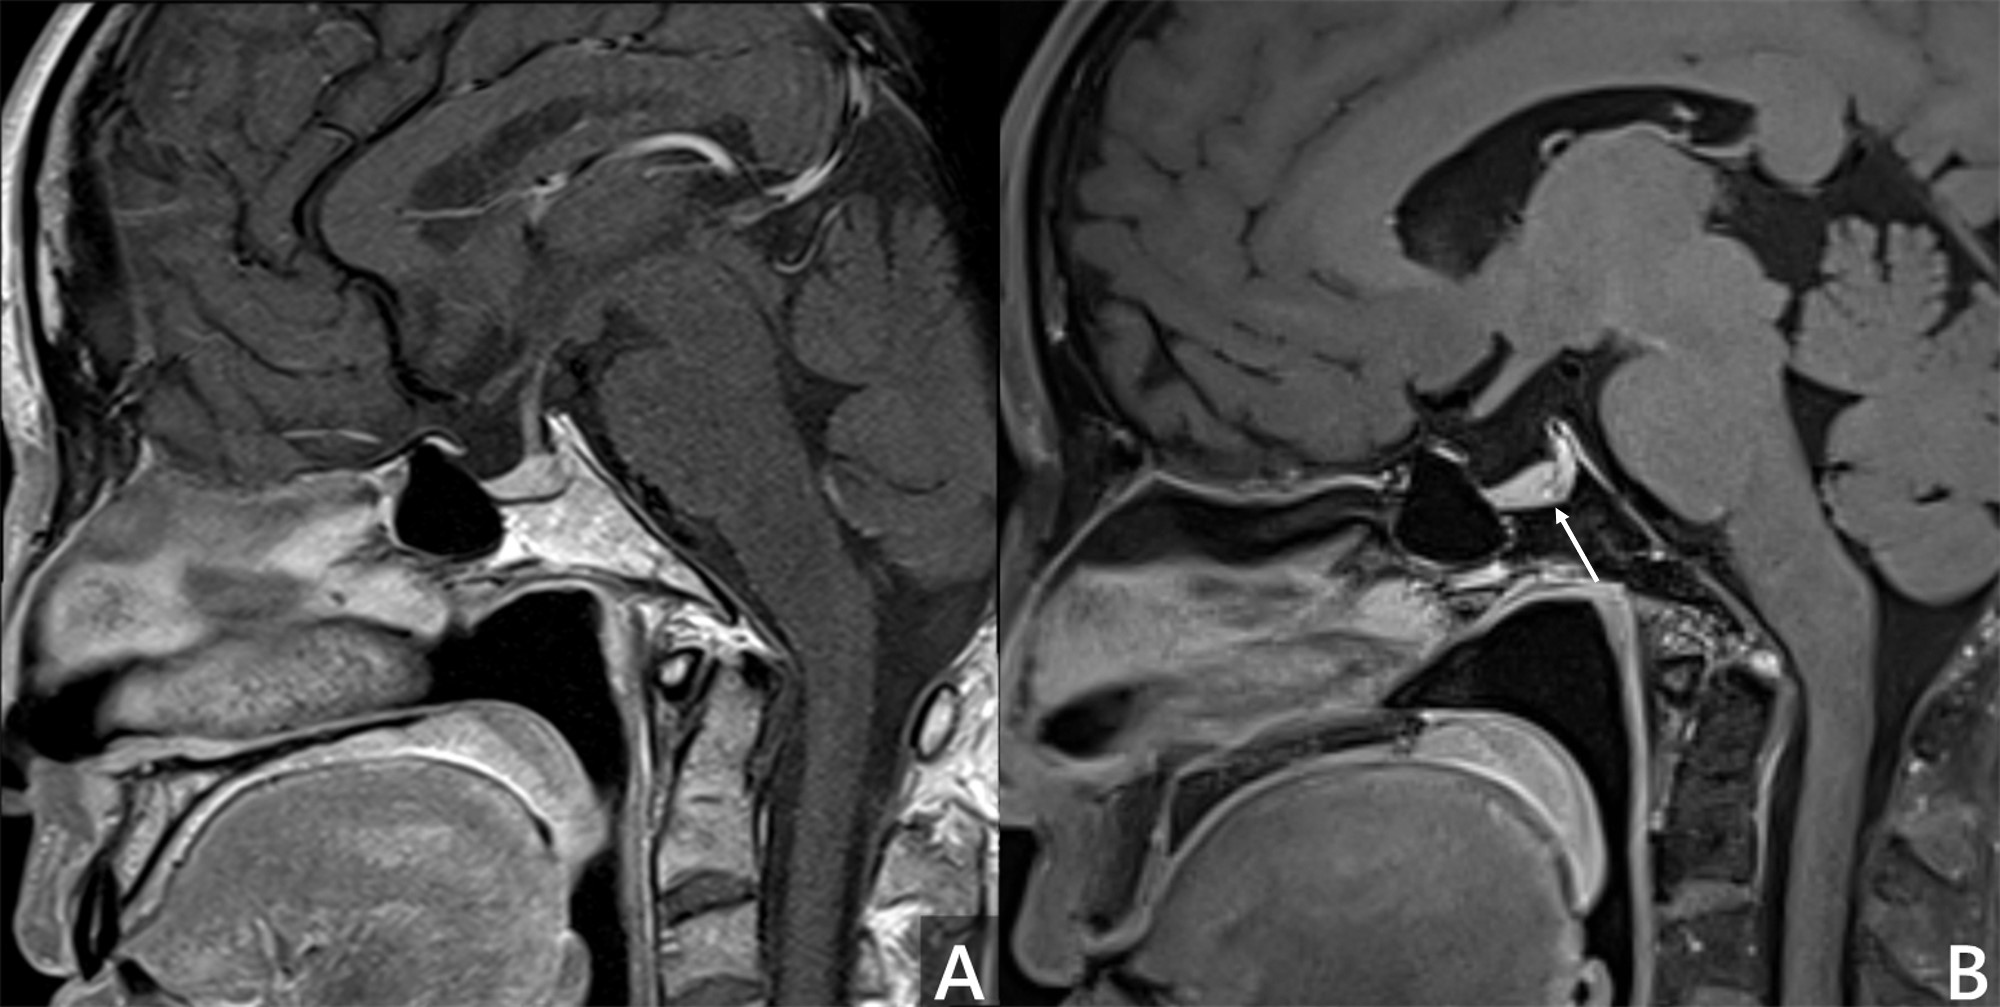
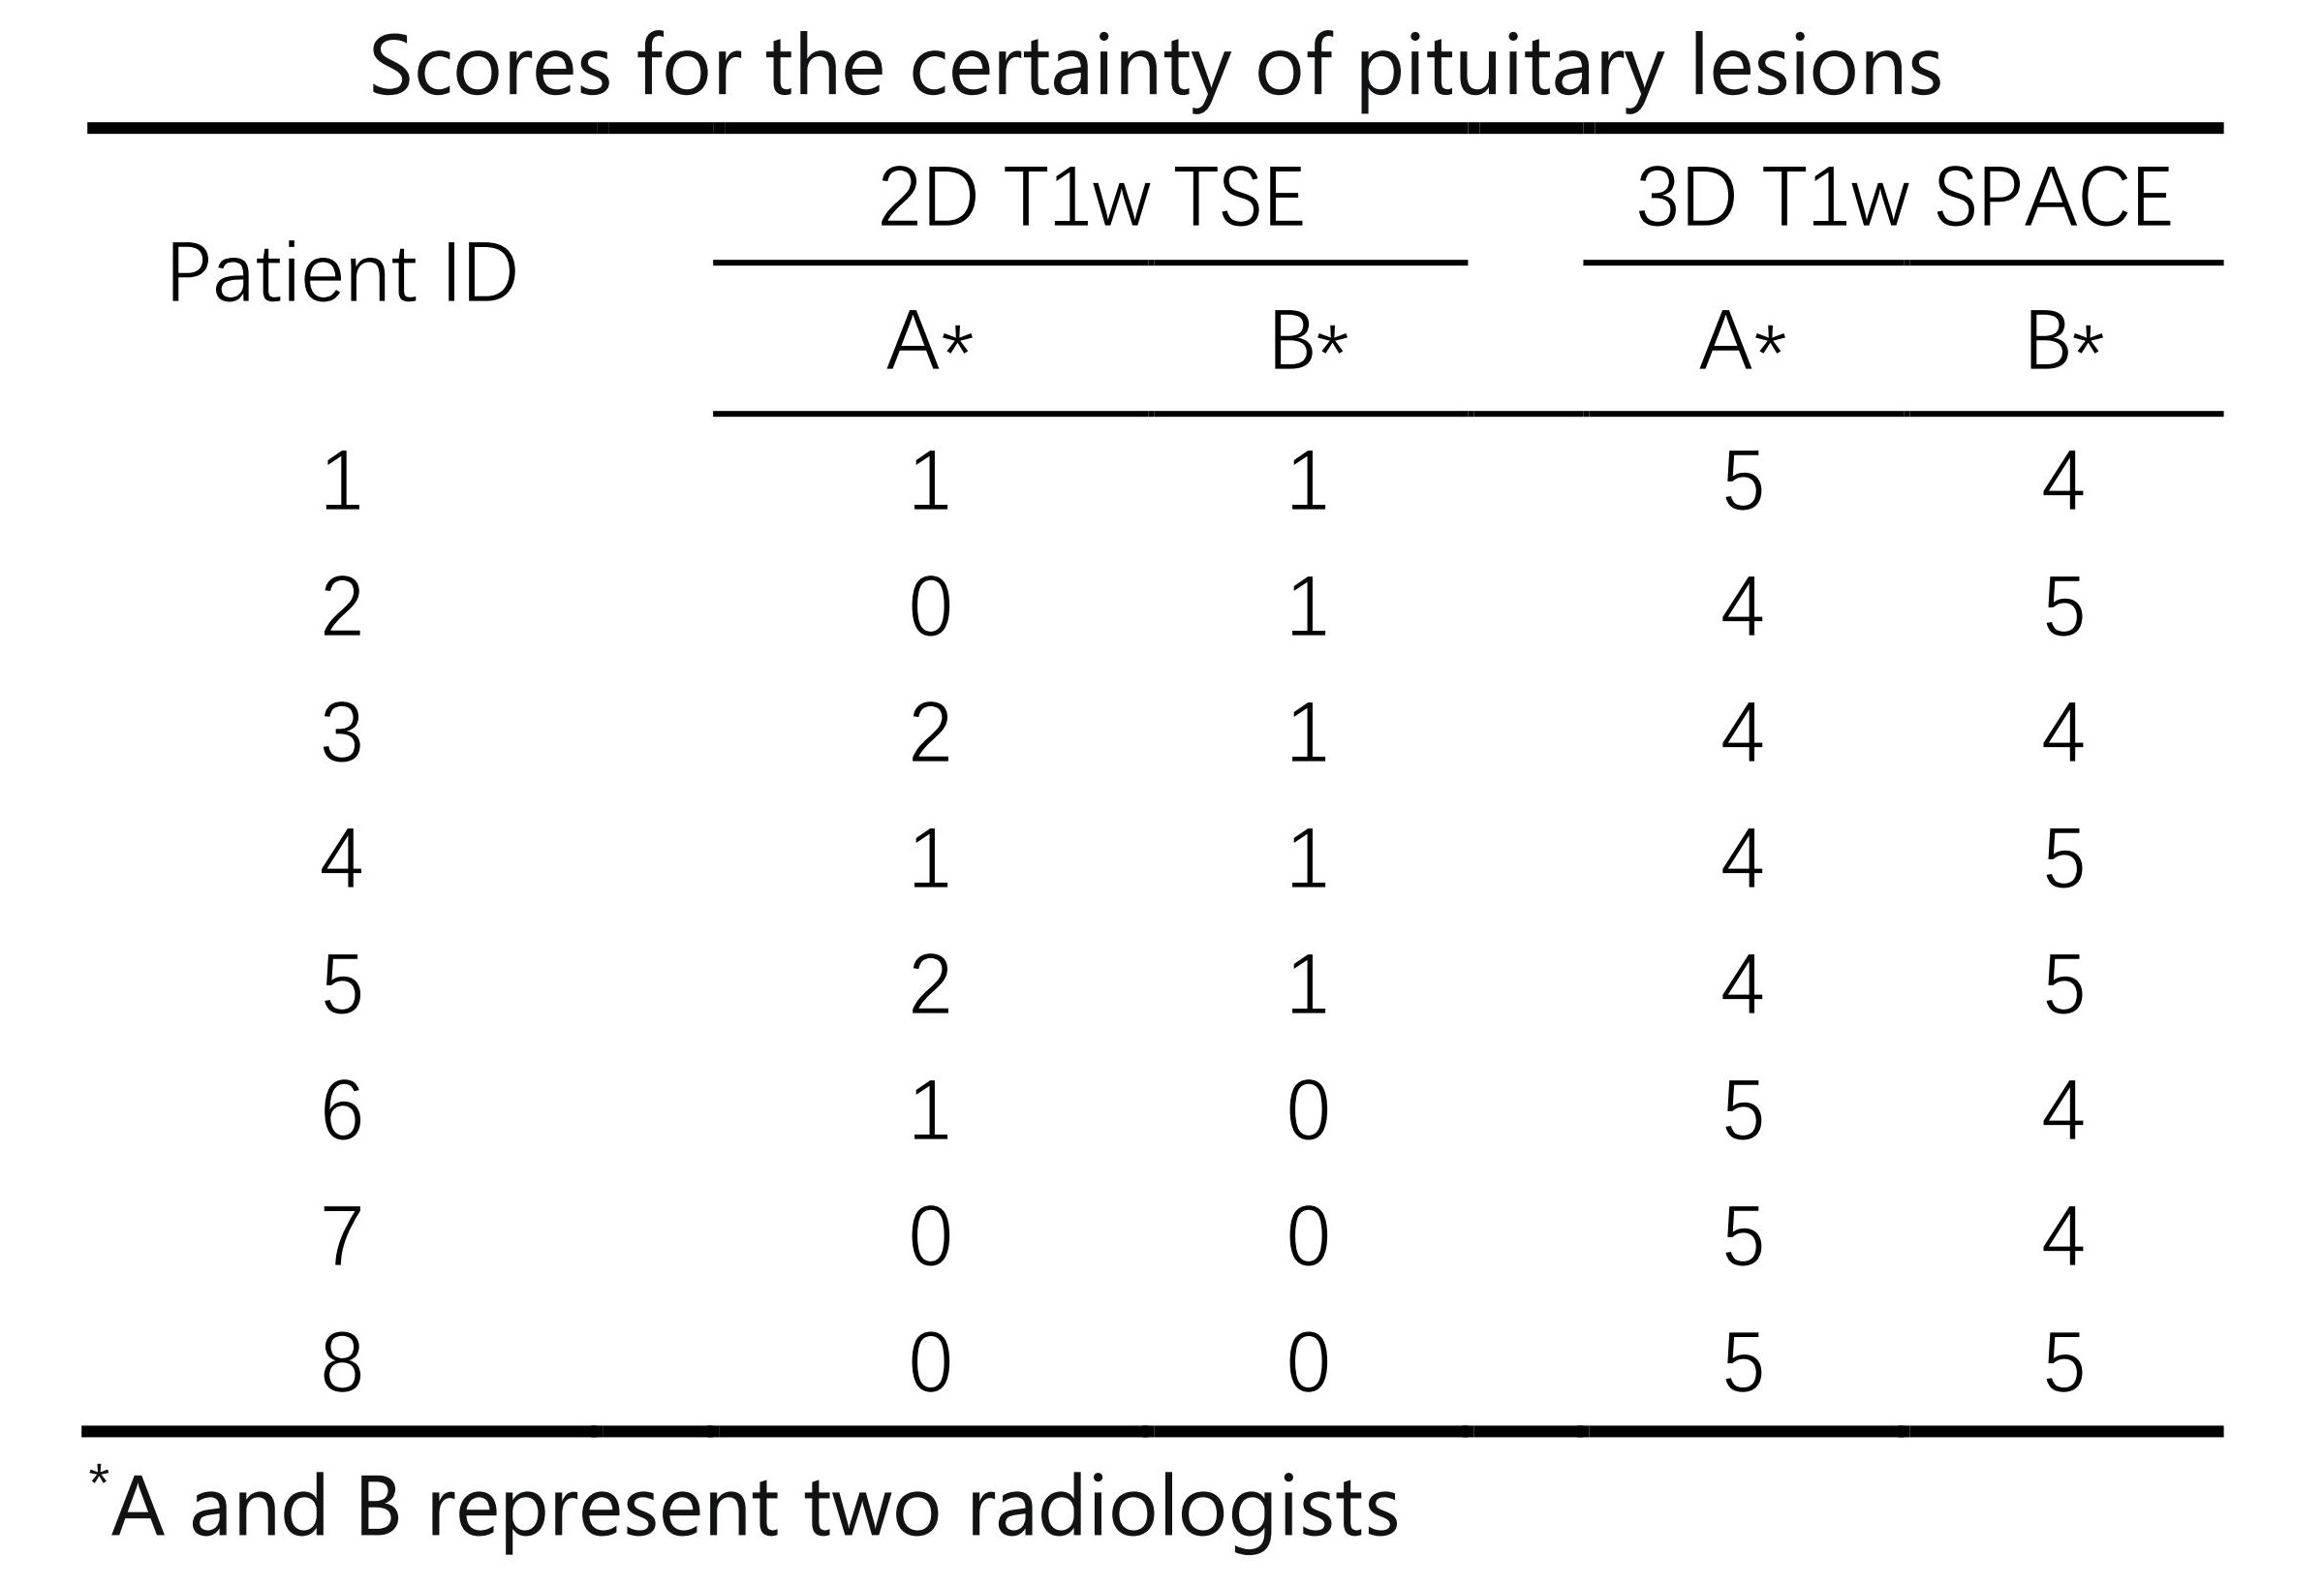
Table 1. Scores for the certainty of the diagnosis of pituitary lesions in 2D T2w TSE and 3D T1w SPACE sequence images. The scores of 3D T1w SPACE images of all patients were significantly higher than that of 2D T1w TSE images.
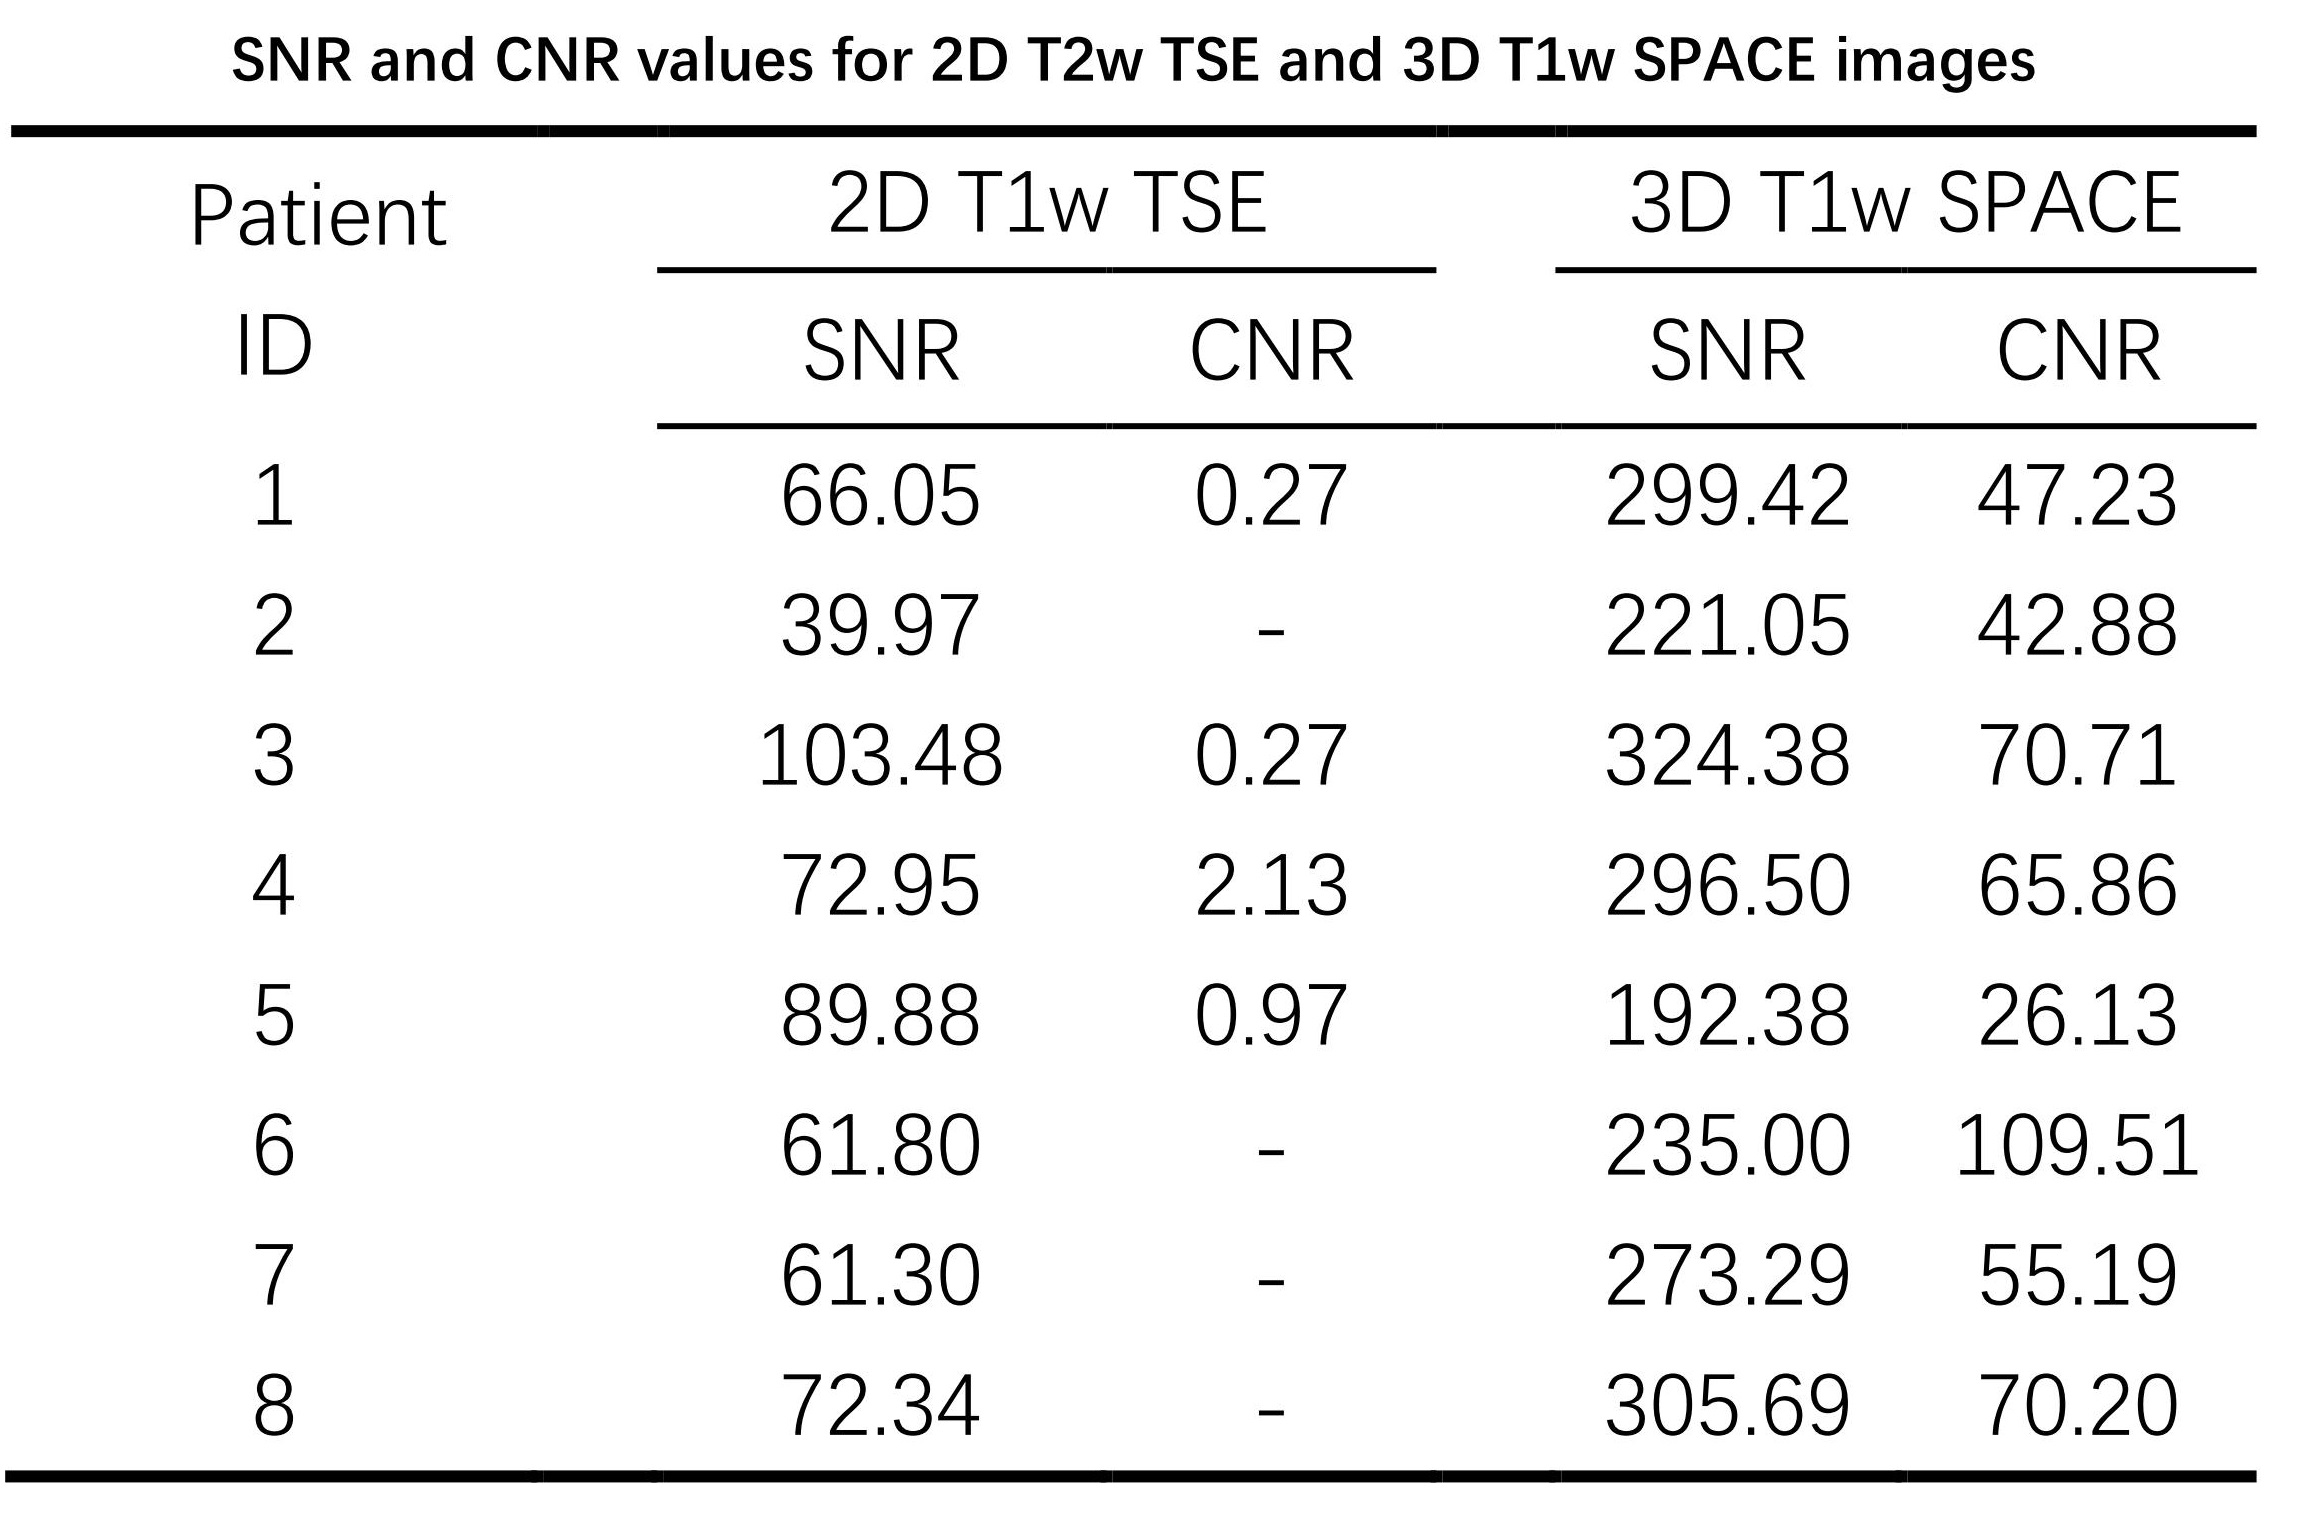
Table 2. SNR (adenohypophysis region) and CNR values for 2D T2w TSE and 3D T1w SPACE sequence images. The SNR and CNR of 3D T1w images of all patients were significantly higher than that of 2D T1w images. CNR values were not measured in images where no lesions were observed.