3216
Retrospective Comparison of Brain Imaging in Patients at 0.55T and 1.5/3T
Anna Lavrova1, John Kim1, Remy Lobo1, Maria Masotti2, Jacob Richardson1, Pedro Itriago-Leon3, Vikas Gulani1, Katherine Wright1, Ashok Srinivasan1, and Nicole Seiberlich1
1Radiology, University of Michigan, Ann Arbor, MI, United States, 2Biostatistics, University of Michigan, Ann Arbor, MI, United States, 3Siemens Medical Solutions USA Inc., Houston, TX, United States
1Radiology, University of Michigan, Ann Arbor, MI, United States, 2Biostatistics, University of Michigan, Ann Arbor, MI, United States, 3Siemens Medical Solutions USA Inc., Houston, TX, United States
Synopsis
Keywords: Tumors, Low-Field MRI
This study aims to compare the image quality of clinical brain imaging on an FDA-approved commercial low-field 0.55T MRI scanner and conventional higher field 1.5/3T MRI systems. The image quality of 205 compatible image series in 30 patients acquired at 0.55T and 1.5T/3T MRI systems was rated by two neuroradiologists. Despite significant differences in image quality ratings between low- and higher-field scanners, all brain sequences performed at 0.55T received ratings indicating that they were acceptable for diagnostic use. This work indicates that the commercial 0.55T system can be used for routine brain imaging in clinical practice.Introduction
The purpose of this work was to compare the image quality of the sequences comprising our routine clinical brain protocol collected on low-field 0.55T and conventional higher-field 1.5/3T MRI systems. Currently, most MRI scanners operate at 1.5T or 3T. Lower-cost, low-field modern MRI scanners with enhanced image post-processing algorithms are increasingly being explored due to the high costs associated with higher field systems1. However, images collected at lower field strengths may suffer from intrinsically lower SNR, necessitating the collection of lower resolution images and even resulting in motion artifacts if averaging must be used2. Because MRI is an established modality for neuroimaging, the quality of clinical brain sequences on these commercial low-field scanners must be sufficient for diagnostic use. Previous work comparing FLAIR and DWI/ADC sequences collected in stroke patients at 0.55T and 1.5T showed that the 0.55T may be deployed for stroke imaging, with image quality comparable to that at 1.5T3. However, the comparison of sequences forming a full routine clinical brain protocol at 0.55T and standard 1.5/3T has not yet been performed. Thus, the goal of this study was to assess the image quality of our routine brain imaging protocol sequences acquired in a variety of patients at 0.55T and to compare them to images collected in the same patients at standard field strengths to determine the feasibility of using this 0.55T system in routine clinical practice.Methods
In this IRB-approved retrospective study, brain MRI images acquired on both a commercial 0.55T (Free.Max, Siemens Healthineers, Erlangen, Germany) and 1.5/3T systems were identified, assessed, and compared. Patients with indications suitable for our routine brain imaging protocol were referred for imaging on the 0.55T scanner. Images from these same patients collected on a 1.5T or 3T system at our institution after August 2020 were retrospectively identified (mean time between scans 5.7 months). In total, 205 compatible image series from 30 patients (17F; mean age 61 years, range 26-85 years) were collected; the sequences assessed included T1w SPACE ± contrast enhancement, axial DWI with computed ADC maps, axial FLAIR, axial SWI (magnitude, filtered phase, combined post-processed magnitude and phase, minimum-intensity projection – mIP), axial T1w TSE, and axial T2w TSE. The sequence parameters used at 0.55T are shown in Fig.1. All images were rated by two neuroradiologists for image quality and visualization of anatomical features using a 3-point Likert scale (1: bad (unacceptable), 2: acceptable, 3: good), as shown in Fig.2. Grading of pathology assessment was not performed due to the time interval between the scans. For each image sequence, the mean and standard deviation of scores were calculated. A paired Wilcoxon test was used to compare the image quality between field strengths. To determine inter-reader agreement, the linear-weighted Cohen’s Kappa coefficient was calculated using all scored features for all images.Results
The ratings for the images collected with the clinical brain protocol at 0.55T show that it is possible to perform diagnostic quality exams on this MRI system, allowing radiologists to answer the clinical question. The following findings were identified: metastatic disease (n=14), normal brain (n=7), vestibular schwannoma (n=2), neurosarcoidosis (n=2), brain abscess (n=1), epidermoid cyst (n=1), post-surgical changes (n=1), microvascular ischemic disease (n=1), stroke (n=1). Examples of images collected at both 0.55T and at the higher field MRI scanners are shown in Fig.3. Image quality ratings for all sequences are shown in Fig.4. Overall, 97.5% of features in all sequences at 0.55T were rated as acceptable (≥2). The one exception was the contrast-enhanced T1w SPACE sequence in one patient, where Reader 1 identified the images as unacceptable (<2) due to motion artifacts. Upon comparison of 0.55T and 1.5/3T systems, a significant difference was found between image quality scores (p≤0.05) in all sequence types. For Reader 1, the image quality scores for all sequences collected at high-field scanners was significantly higher than those from 0.55T. For Reader 2, only DWI/ADC and SWI images collected on higher-field systems were scored significantly higher at high-field than 0.55T; no significant differences were found between field strengths for the other sequences. The scores for each reader and field strength are shown in Fig.5. The inter-reader agreement was determined to be moderate (κ=0.439).Discussion
In this study, a significant difference in brain image quality between 0.55T and 1.5/3T MRI scanners was seen in a diverse patient population. Despite this finding, radiologists were able to answer the clinical question using images collected at 0.55T, and almost all (97.5%) brain sequences at 0.55T received scores indicating that they were acceptable for diagnostic use. The one exception was the contrast enhanced T1w SPACE sequence in a single patient due to motion artifacts. Further studies will be required to assess the use of the 0.55T MRI system for specific patient populations. Moreover, the total scan time was not quantified in this study and should also be considered when assessing the impact of using a 0.55T system on the clinical workflow.Conclusion
Diagnostic quality clinical brain images can be collected in patients at 0.55T. Although neuroradiologists tended to prefer the appearance of images collected on 1.5/3T systems, the clinical question could be answered using the 0.55T system in all patients assessed in this study.Acknowledgements
Research support from Siemens HealthineersReferences
[1] Heiss R, Nagel AM, Laun FB, et al. Low-field magnetic resonance imaging: a new generation of breakthrough technology in clinical imaging. Invest Radiol. 2021; 56:726–733.
[2] Sarracanie M, Salameh N. Low-field MRI: how low can we go? A fresh view on an old debate. Front Phys. 2020. https://doi.org/10.3389/fphy.2020.00172.
[3] Rusche, Thilo, et al. "Potential of Stroke Imaging Using a New Prototype of Low-Field MRI: A Prospective Direct 0.55 T/1.5 T Scanner Comparison." Journal of Clinical Medicine 11.10 (2022): 2798.
Figures
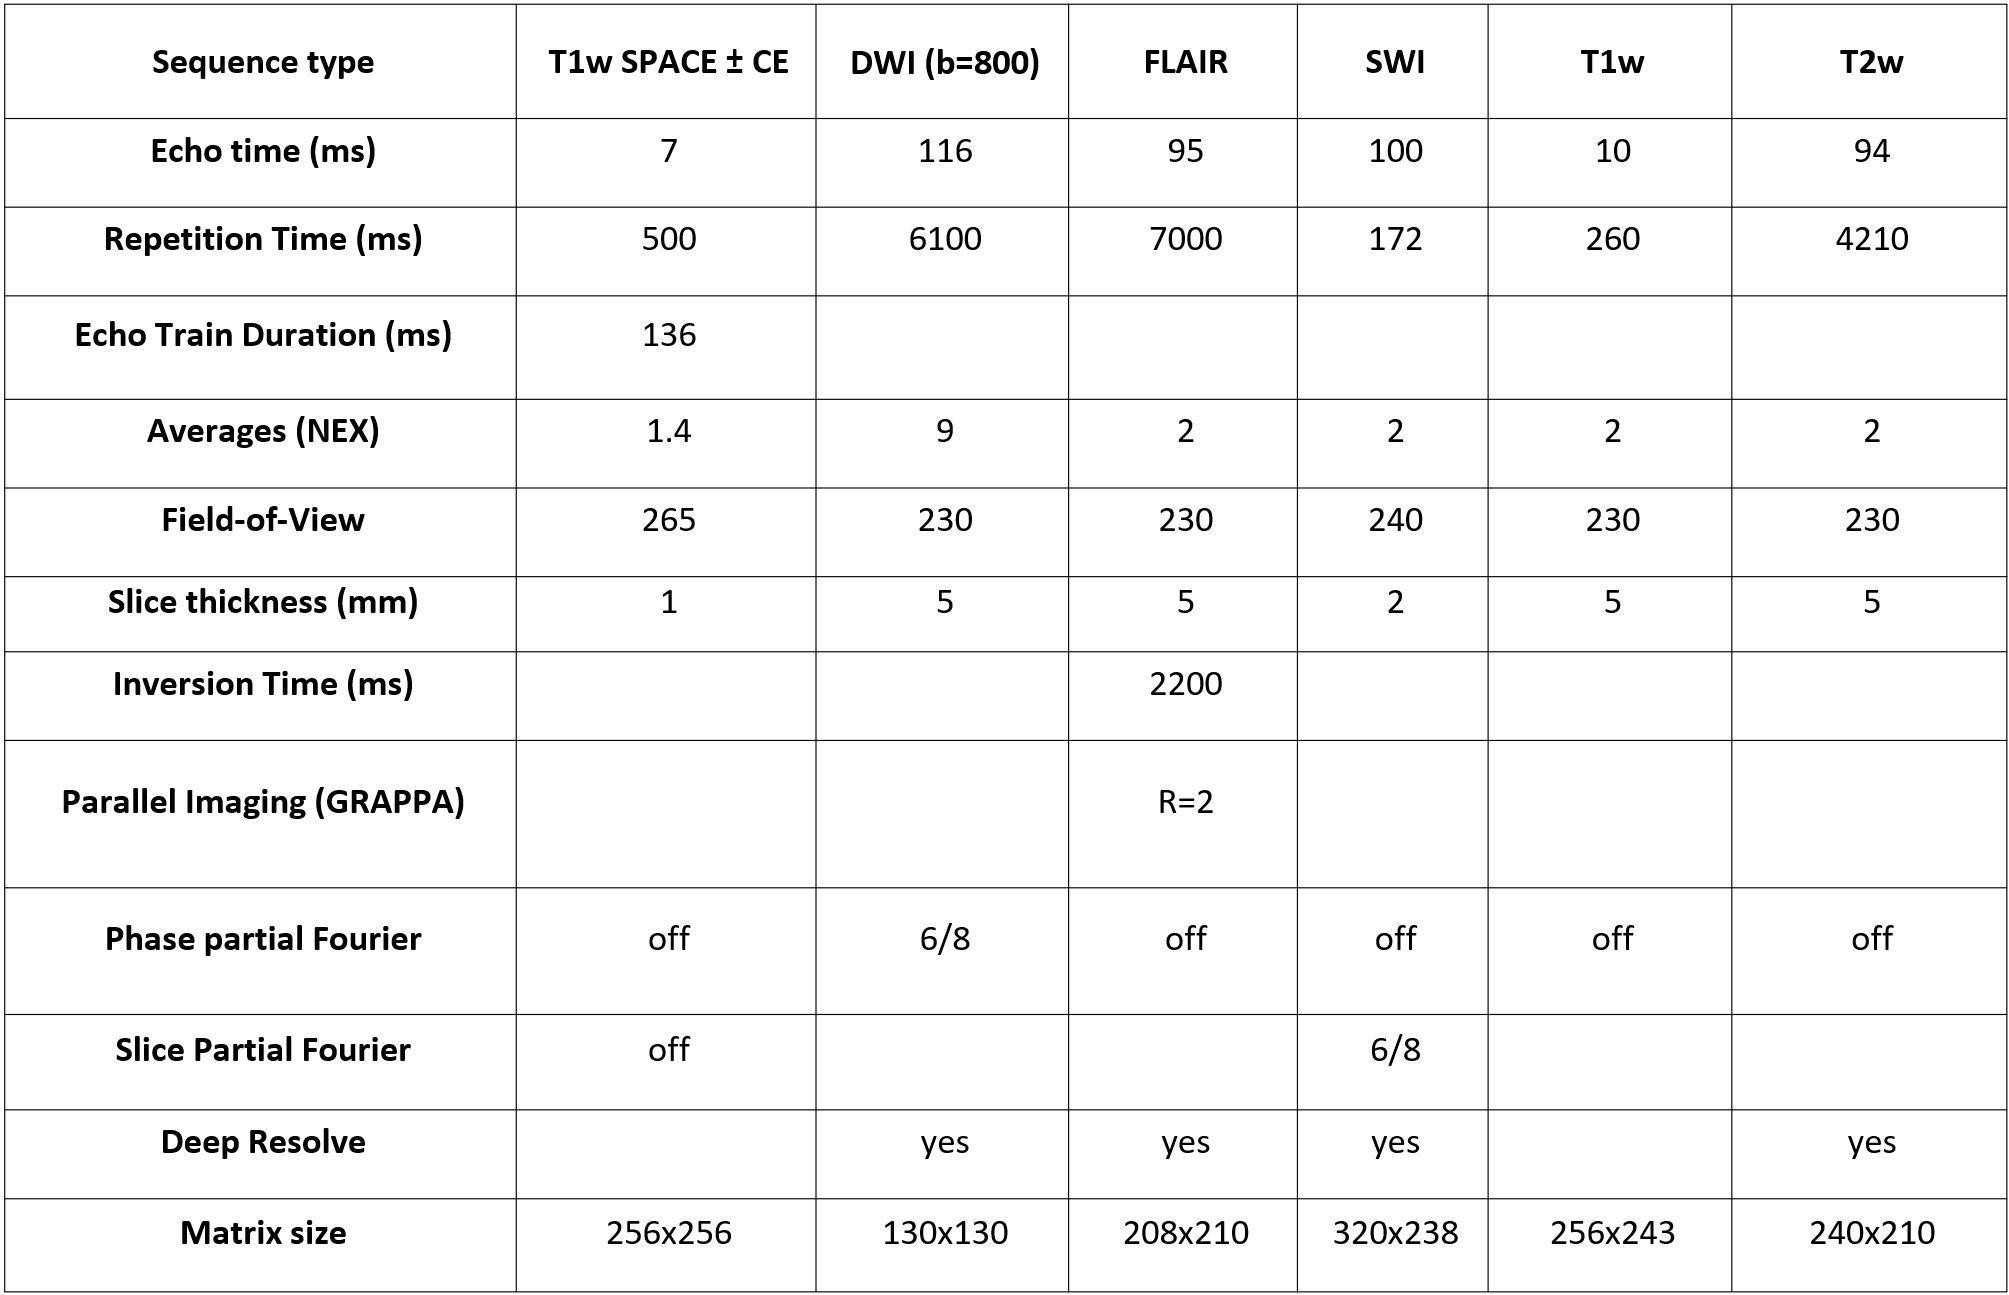
Fig.1. Acquisition
parameters for sequences collected at 0.55T.
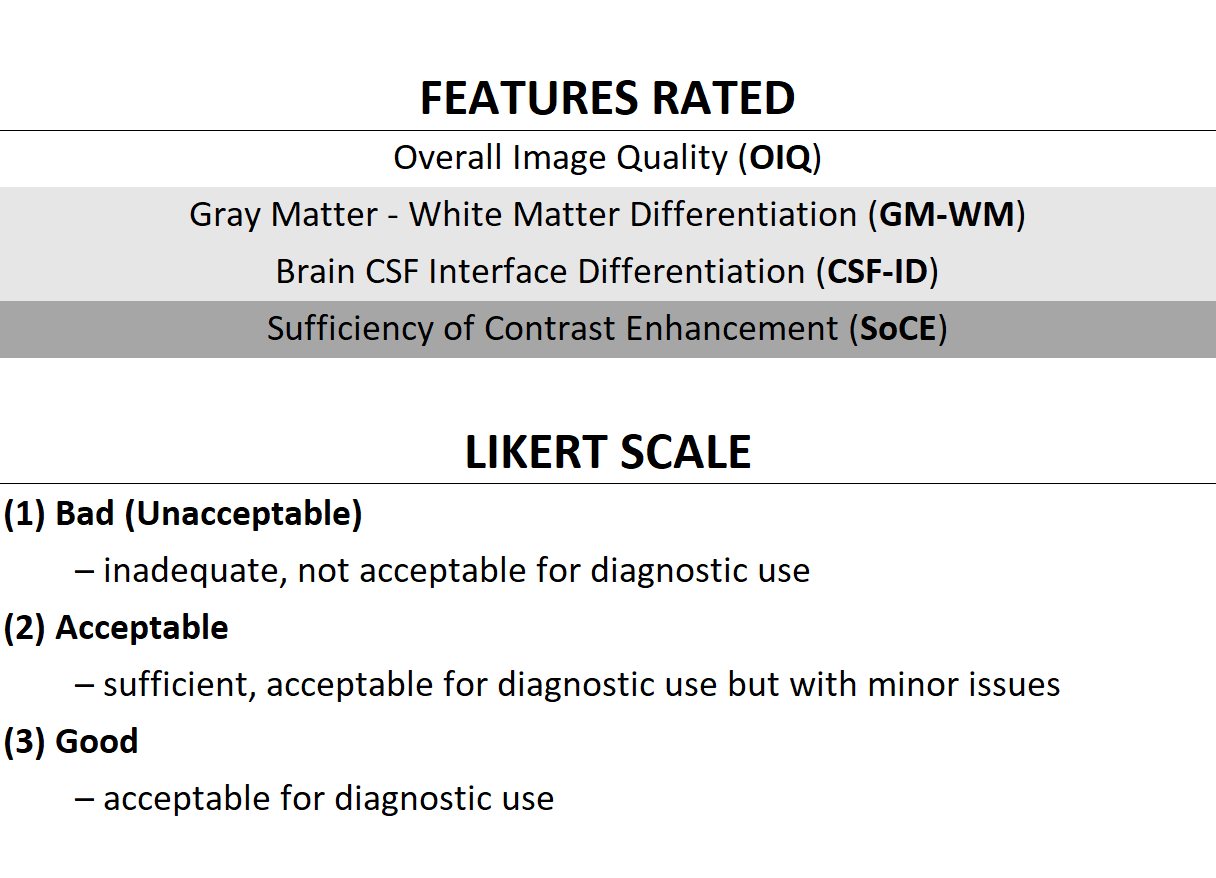
Fig. 2. Features rated in this study (top)
and the Likert scale used for rating (bottom).
Note that gray matter-white matter differentiation and brain CSF
interface differentiation were rated only for a subset of sequences;
sufficiency of contrast enhancement was rated only for contrast-enhanced
images.
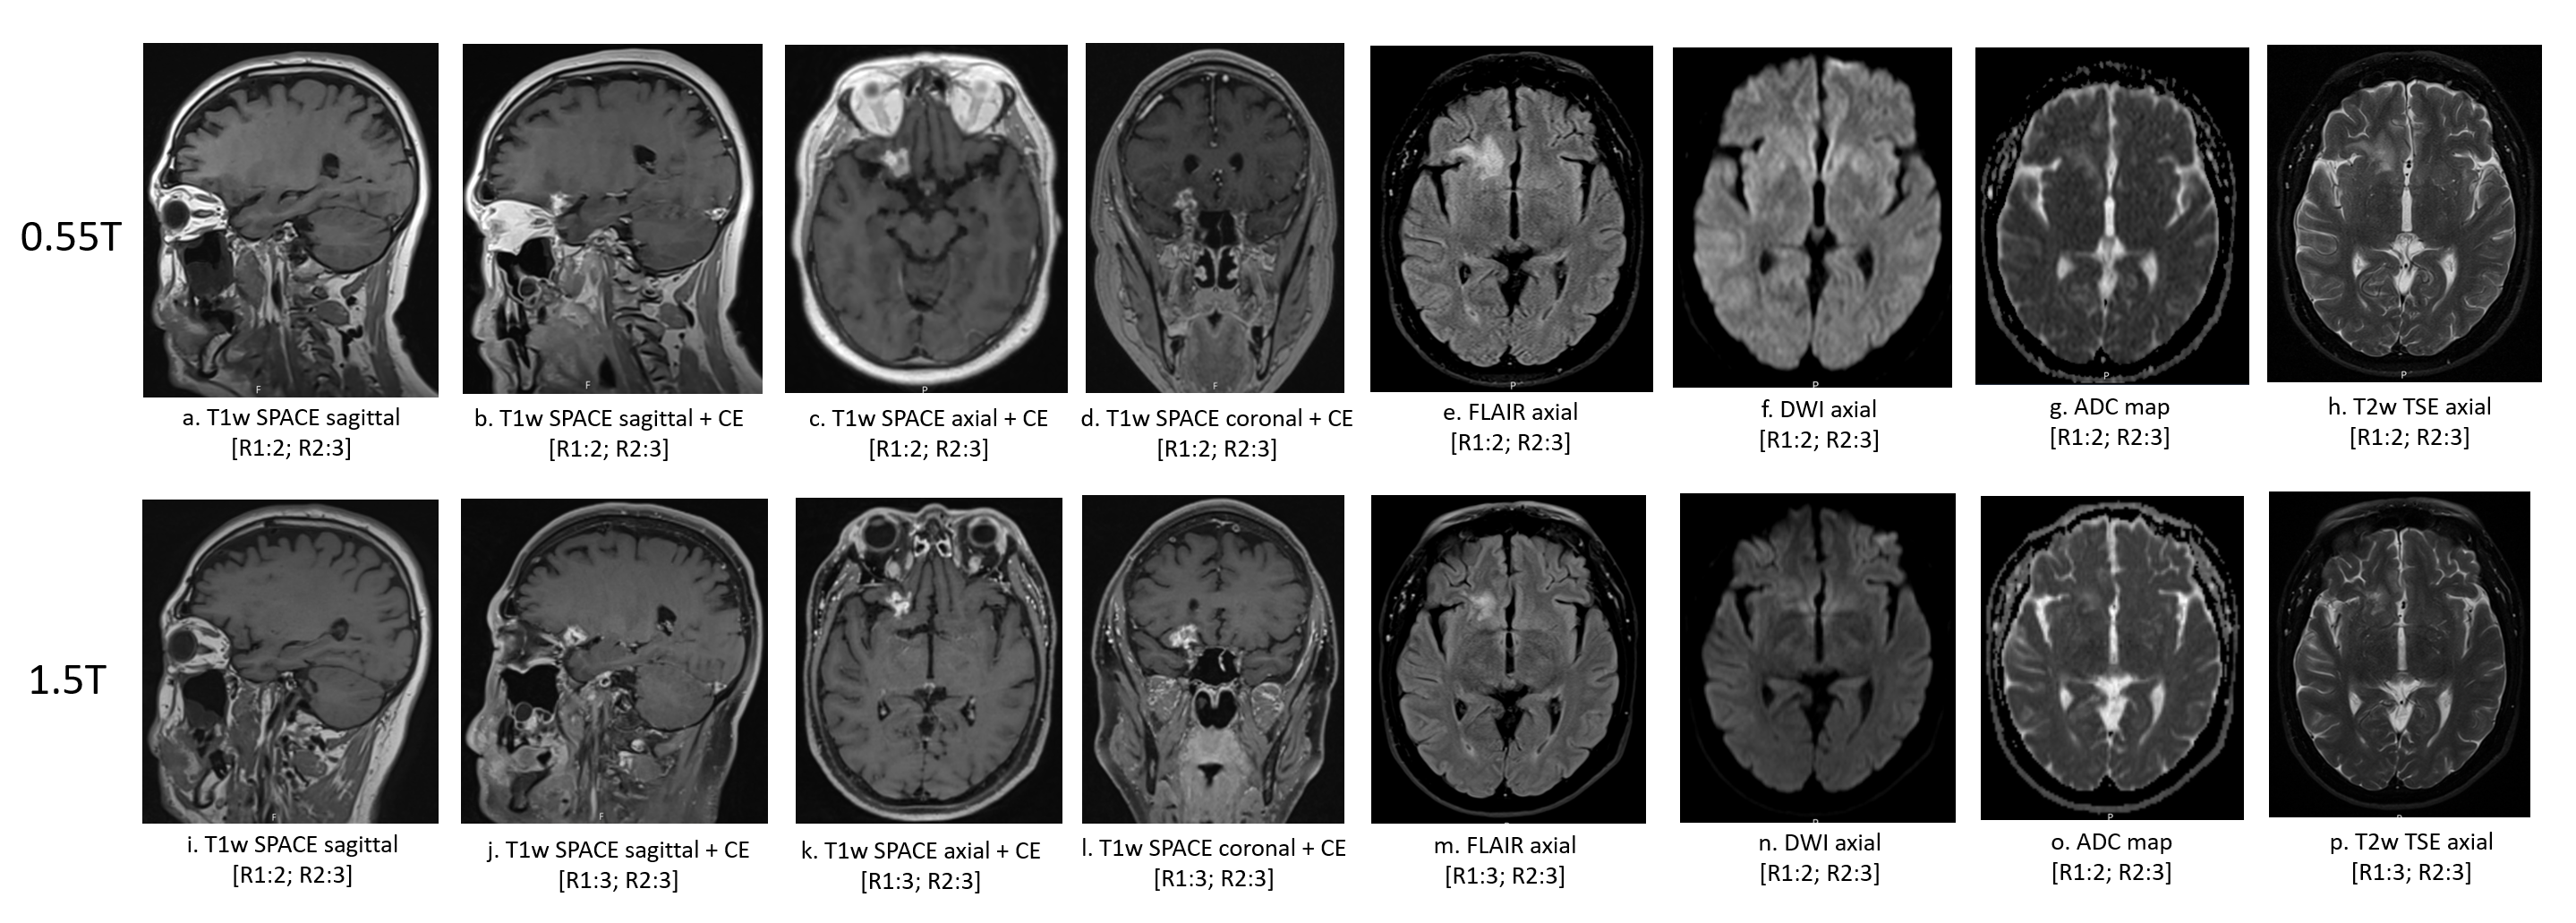
Fig. 3. Examples of brain
images acquired at 0.55T (a-h) and 1.5T (i-p) MRI scanners. Overall image
quality ratings from both readers are indicated in brackets.
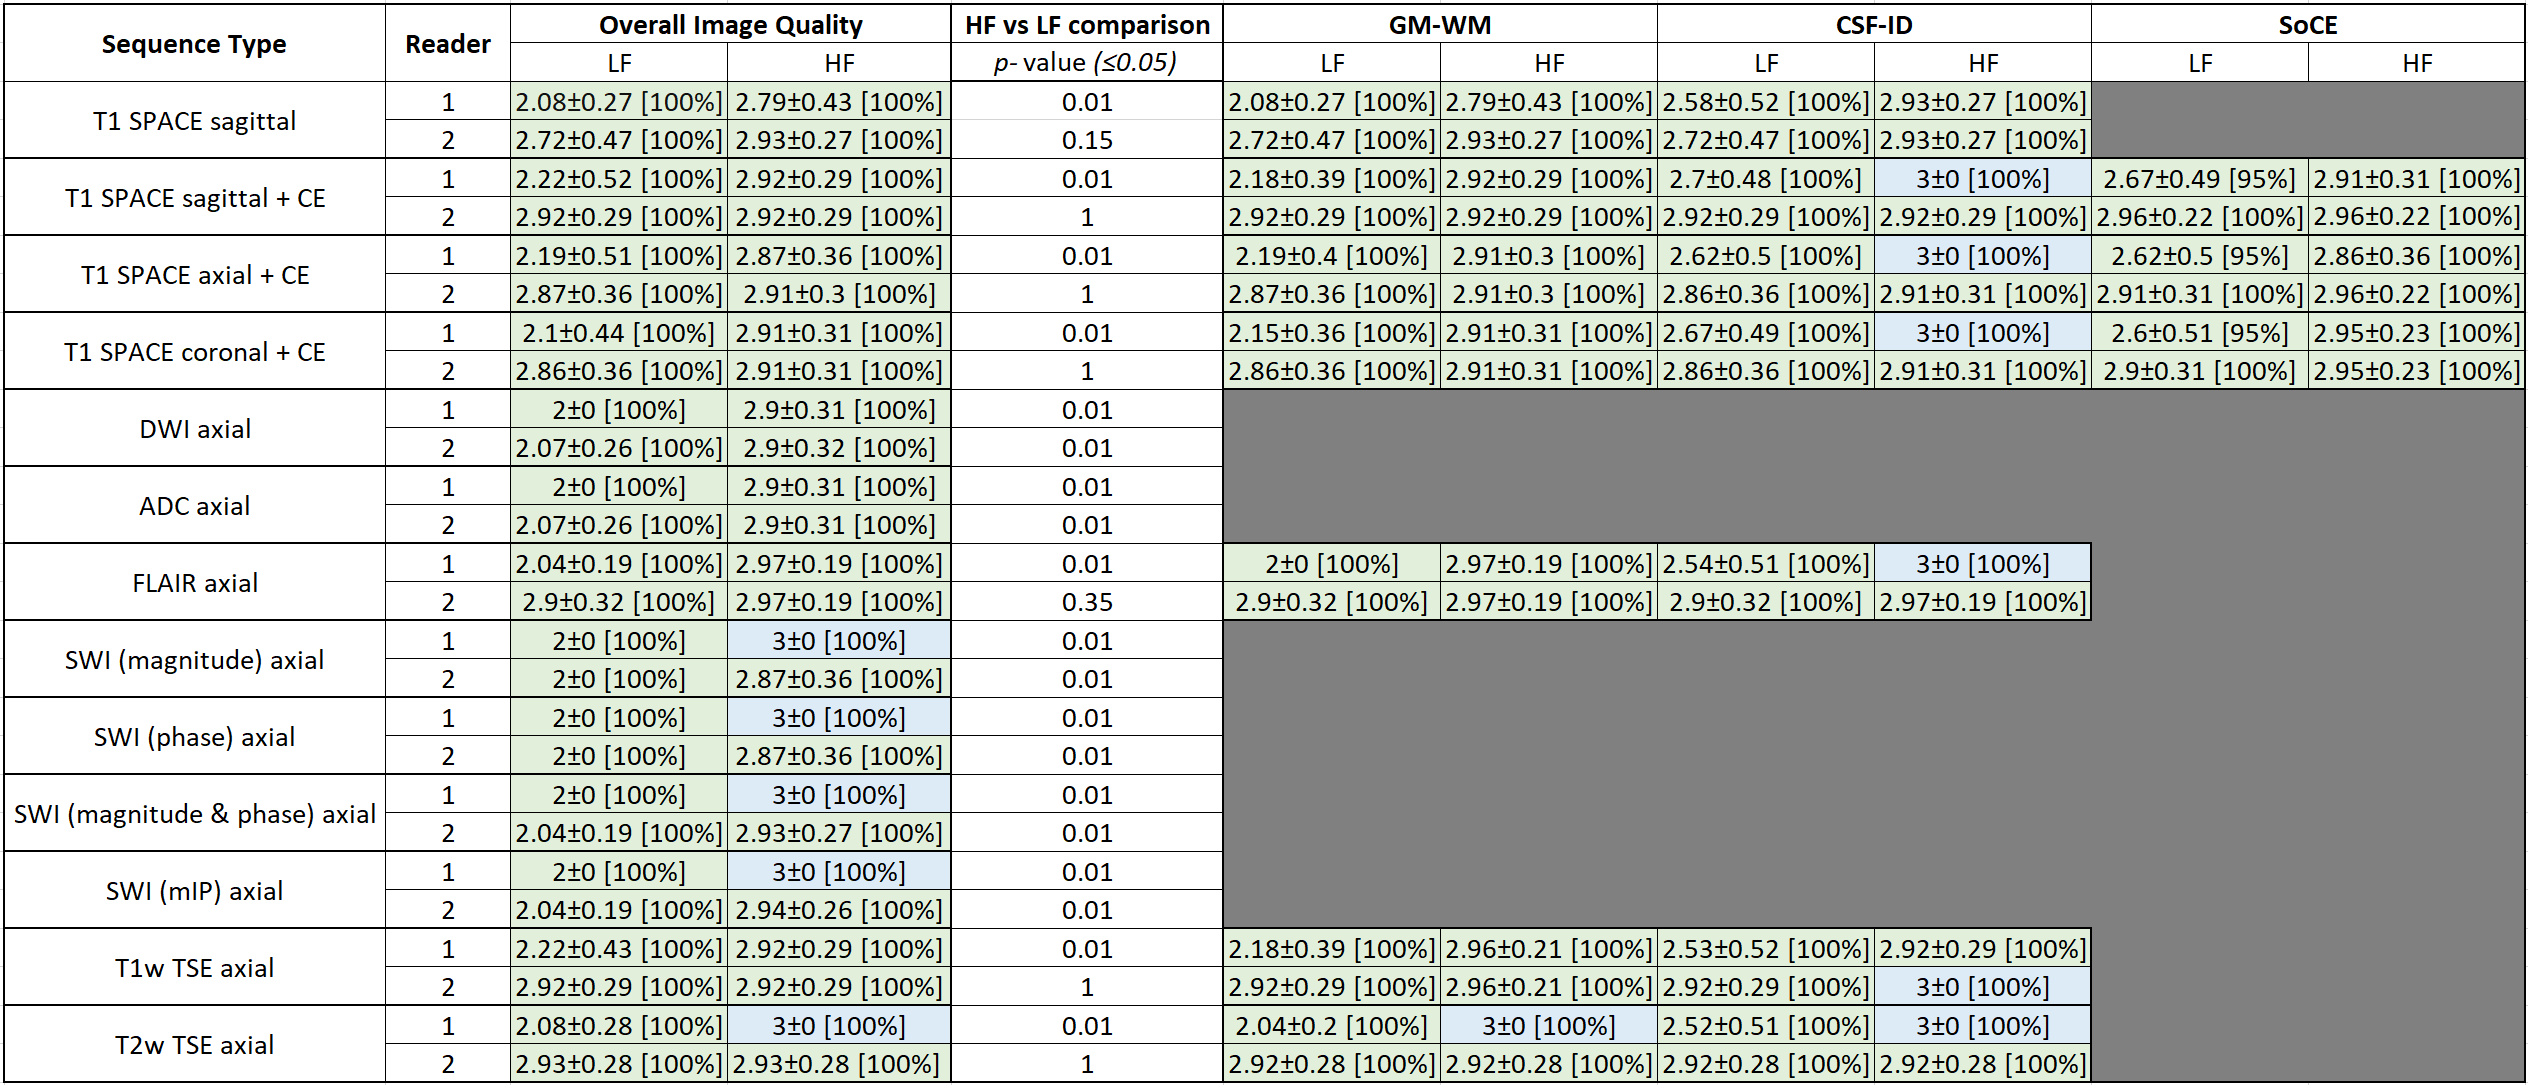
Fig. 4. A summary of the image quality ratings
from low-field (LF) and higher-field (HF) MRI scanners, reported as mean ±
standard deviation [fraction of images rated ≥2], for each sequence and reader.
Shaded boxes indicate that the feature was not applicable for a specific image
type, and therefore not rated.
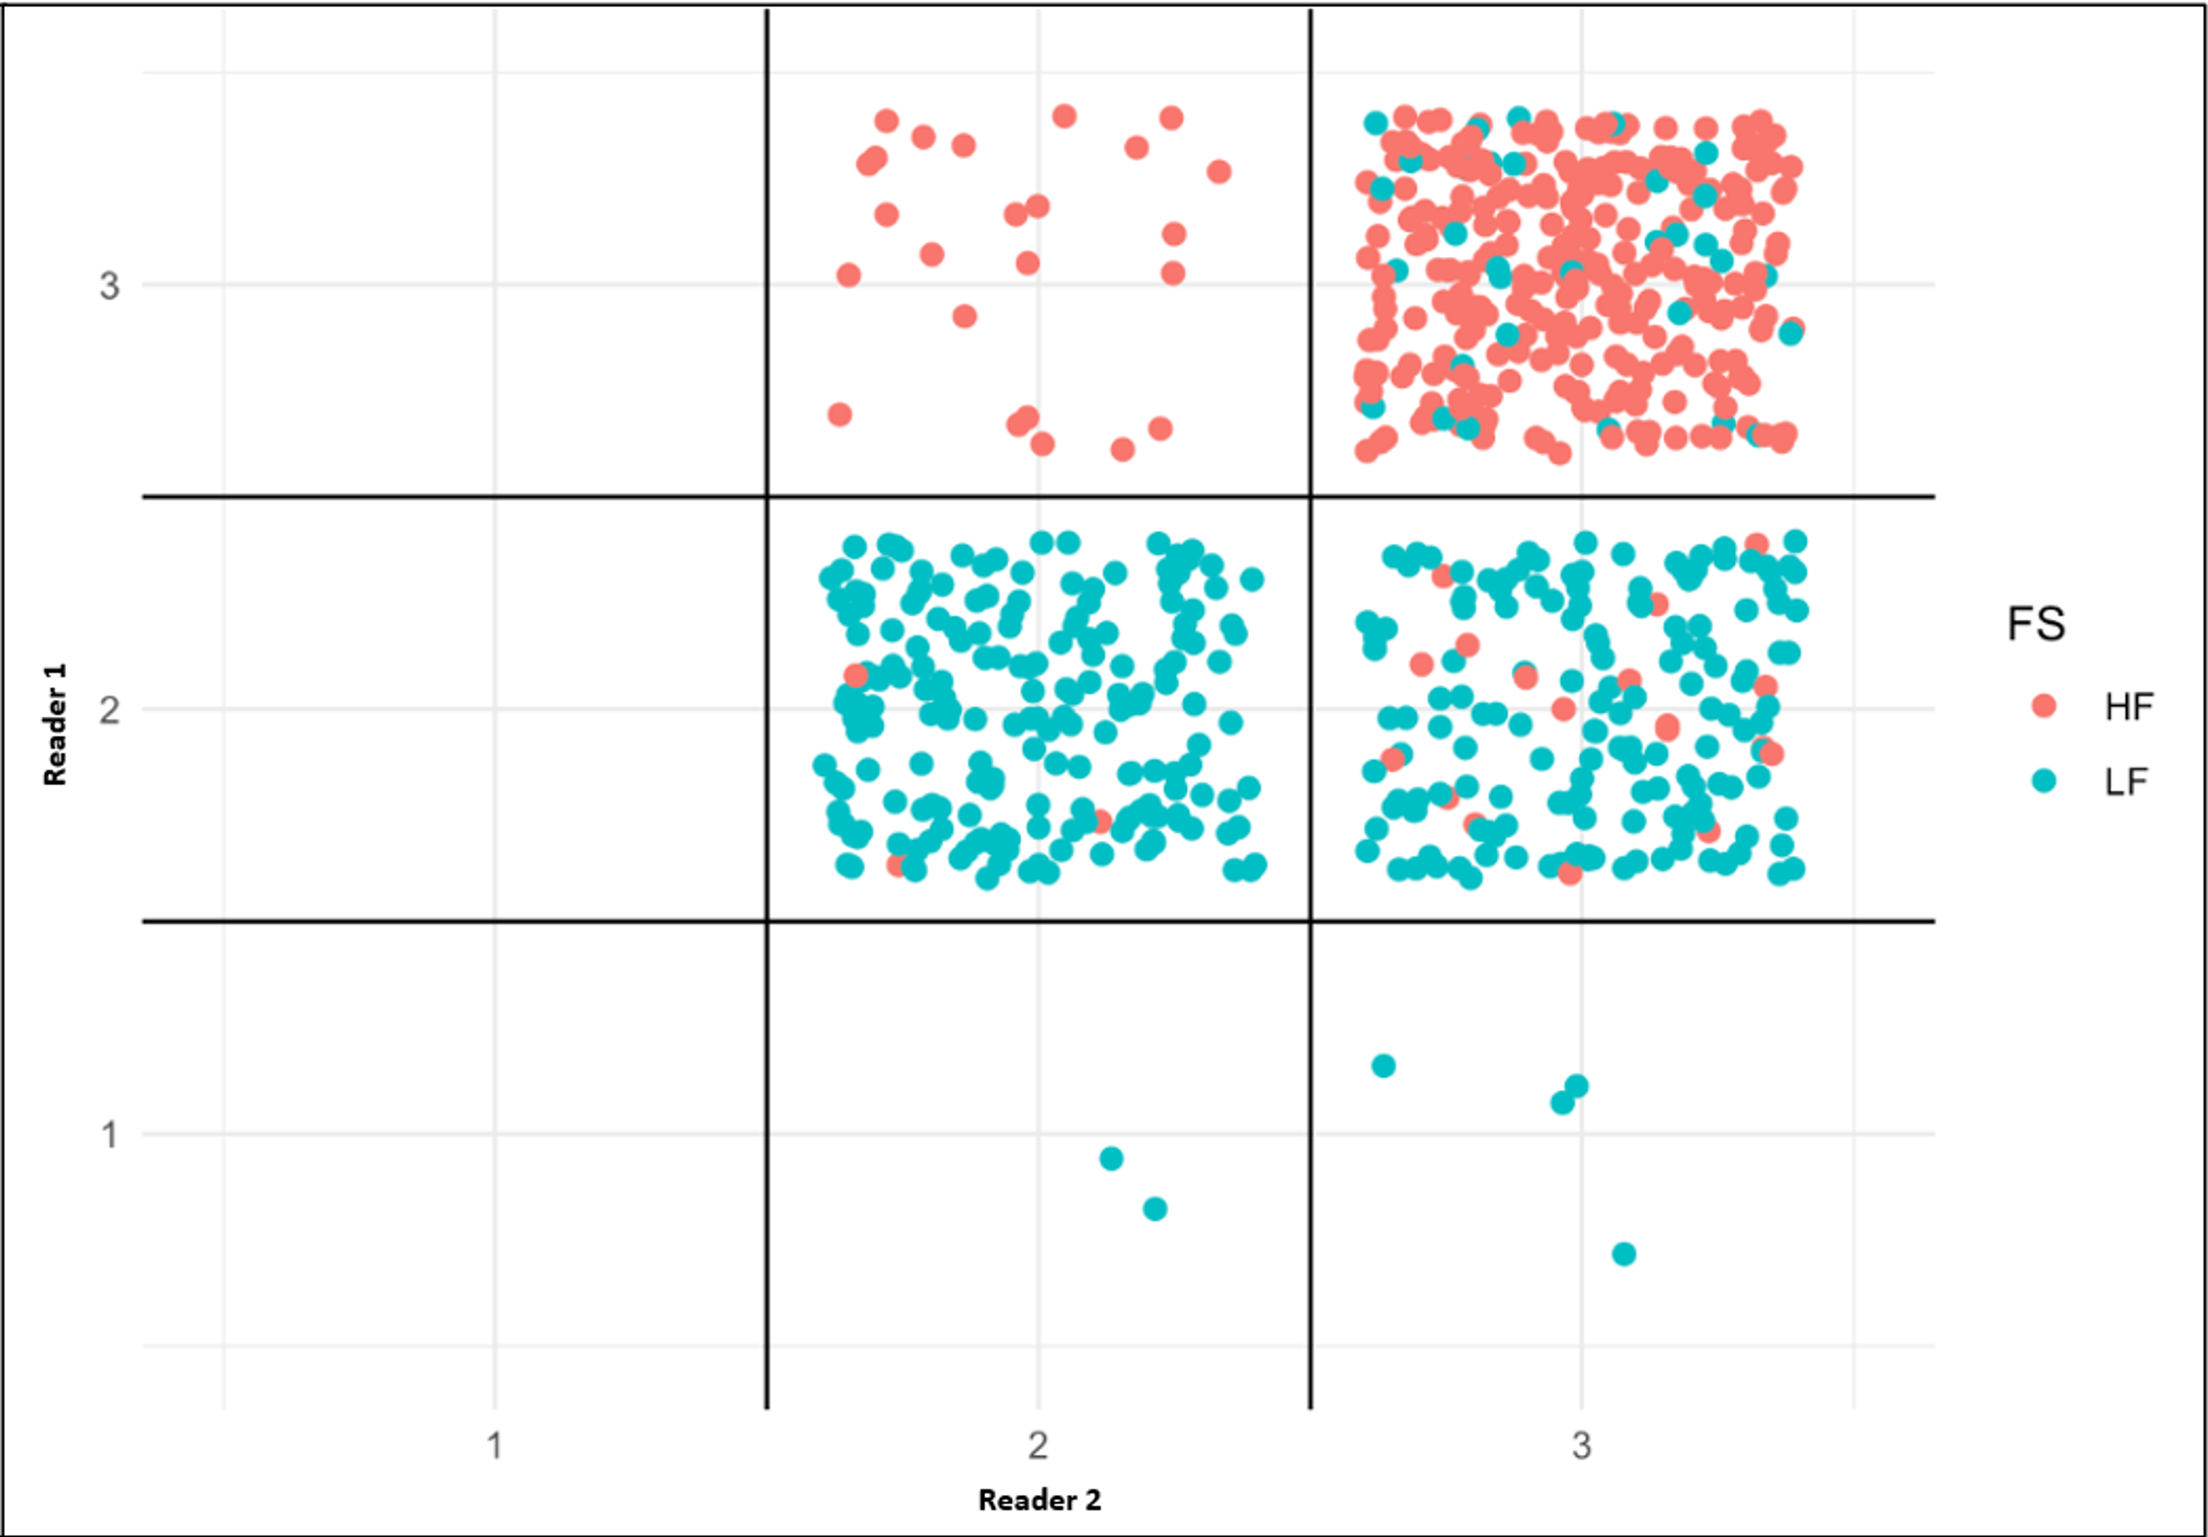
Fig. 5. Distribution of the scores from both
readers at higher-field (HF, 1.5T/3T) and low-field (LF, 0.55T) MRI scanners.
DOI: https://doi.org/10.58530/2023/3216