3211
Multimodal assessment of nigrostriatal degeneration in de novo Parkinson’s disease1HM CINAC, Hospital Universitario HM Puerta del Sur, Móstoles, Spain, 2Universidad Complutense de Madrid, Madrid, Spain, 3Center for Networked Biomedical Research on Neurodegenerative Diseases (CIBERNED), Instituto de Salud Carlos III, Madrid, Spain, 4Neurology Department, Hospital Universitario 12 de Octubre, Madrid, Spain, 5Ken and Ruth Davee Department of Neurology, Northwestern University, Chicago, IL, United States, 6Universidad San Pablo-CEU, Madrid, Spain
Synopsis
Keywords: Parkinson's Disease, Multimodal, Dopamine, free-water DTI, Iron
FDOPA uptake rate, fractional volume of free-water and R2* relaxometry are imaging biomarkers sensitive to dopaminergic decline, microstructural degeneration, and iron disruption respectively, three pathological processes developed within the nigrostriatal system in Parkinson’s disease (PD). A multimodal comprehensive characterization of these biomarkers in early PD was performed, assessing them within striatum and substantia nigra pars compacta in a de novo PD cohort. While iron disruption was not observed, PD subjects revealed dopaminergic and microstructural alterations within the nigrostriatal system, following both similar spatial patterns. These results serve to improve our understanding of nigrostriatal vulnerability and degeneration in early PD.Introduction
Neuroimaging techniques allow studying in-vivo the pathological processes related with Parkinson’s disease (PD) neurodegeneration, mechanisms that are mainly developed within the nigrostriatal system. Several biomarkers like FDOPA uptake rate (Ki), fractional volume of free-water (FW) or R2* relaxometry have proven to be sensitive to some of these pathological processes (dopaminergic decline, microstructural degeneration, and iron disruption respectively), even in PD early stages1–3. However, a multimodal comprehensive characterization of these biomarkers is still lacking in early PD clinical stages. Here, we aimed to study nigrostriatal changes during early PD from a multifactorial perspective, testing how iron disruption and microstructural integrity are connected to dopaminergic denervation.Methods
Thirty de novo PD patients and twenty healthy subjects (HS) underwent PET and MRI studies no later than 12 months from clinical diagnosis. From these sessions Ki, FW and R2* maps were reconstructed from PET, single-shell diffusion MRI (b=1000s/mm2) and 3D multi-echo gradient echo data respectively. Ki was computed applying Patlak’s graphical method using as reference the average-time activity curve from an occipital lobe mask4. FW maps were estimated by fitting the bi-tensor model5 with the regularized gradient descent method and using a hybrid initialization strategy6. R2* maps we reconstructed nonlinearly fitting the complex monoexponential equation with an autoregressive algorithm7. These biomarkers were assessed within caudate, putamen, and substantia nigra pars compacta (SNpc). Striatal regions of interest (ROIs) were partitioned into pre/post-commissural divisions to improve pathological characterization. SNpc was divided into anteromedial/posterolateral ROIs. Single hemibrain data were sorted according to the predominance of motor signs (PD) or hand dominance (HS), i.e., more/less affected sides (MAS/LAS) or dominant/non-dominant sides (DS/nDS). Non-parametric Mann-Whitney’s U tests were applied to study inter-group differences (MAS vs DS and LAS vs nDS). Spearman’s correlation analyses were performed between imaging metrics and with quantitative bradykinesia clinical scores to test biomarker dependencies and correlation with clinics.Results
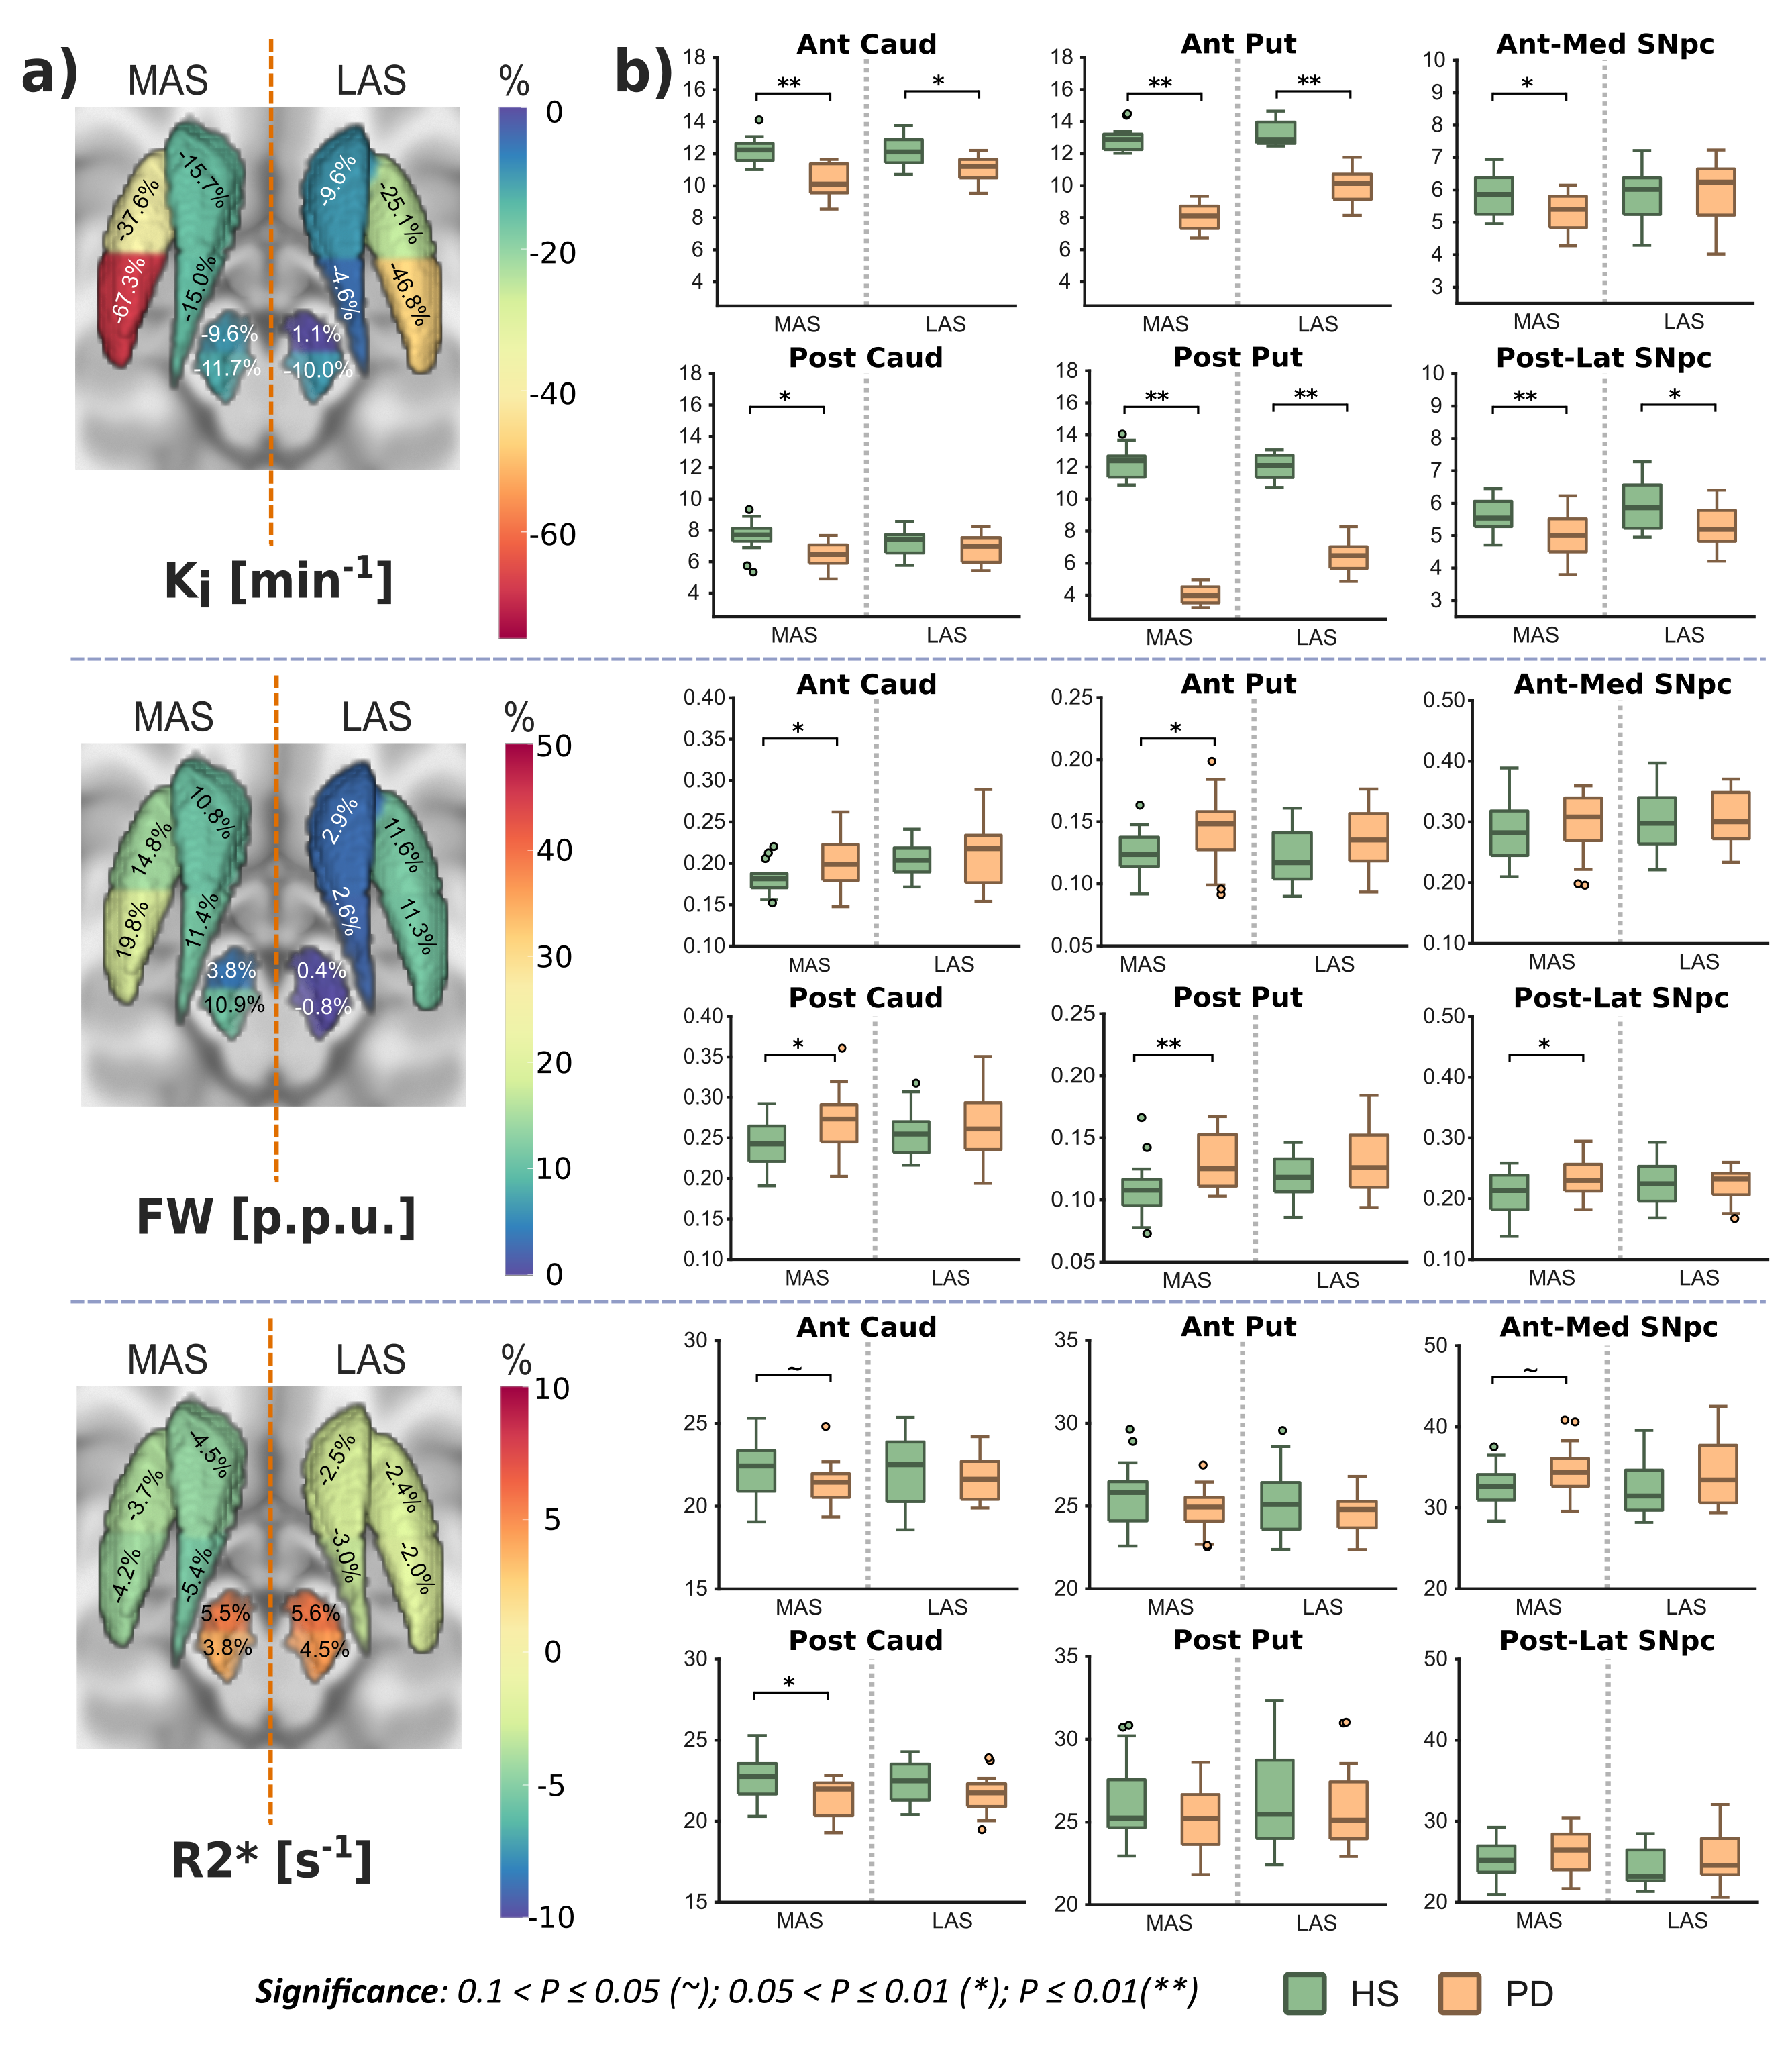
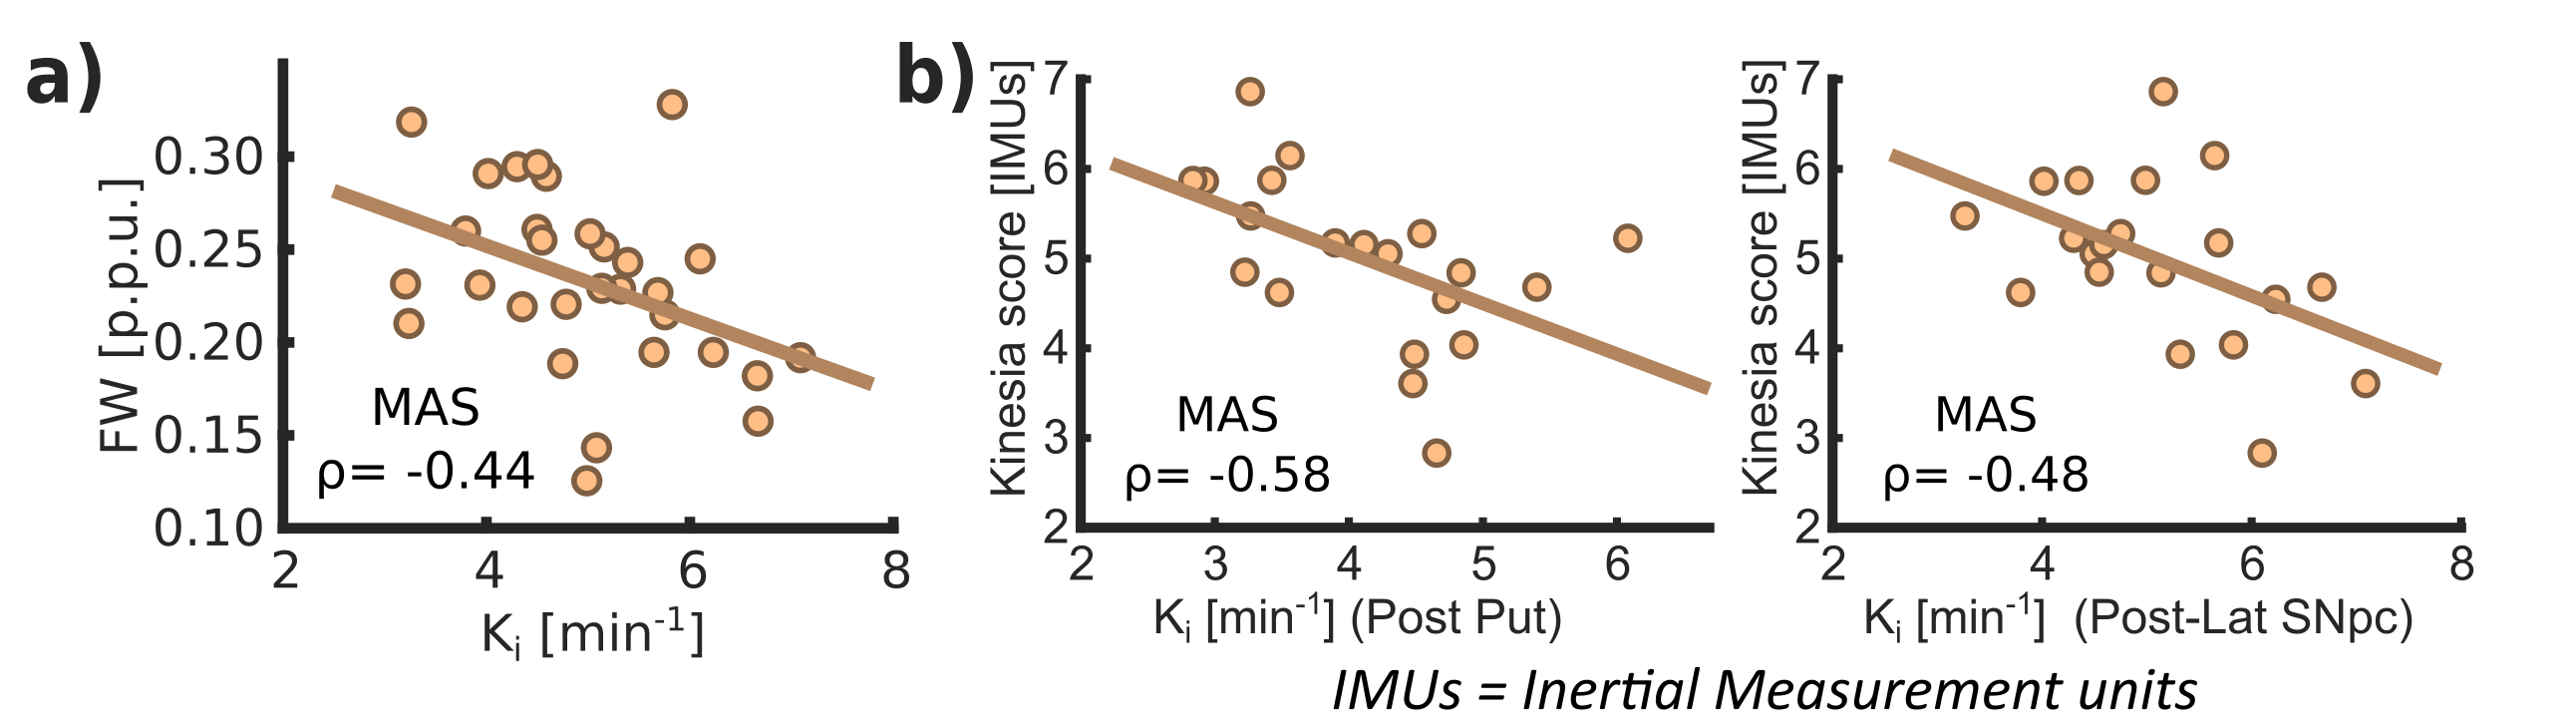
Ki analyses revealed significant differences between HS and PD cohorts across the whole nigrostriatal system, being post-commissural putamen (-67%) and posterolateral SNpc (-11.7%) the most affected regions within striatum and SNpc respectively (Fig. 1). FW revealed microstructural alterations in PD that spatially mirrored the dopaminergic degeneration patterns showed with Ki (+20% in post-commissural putamen and +11% in posterolateral SNpc) (Fig. 1). R2* showed no relevant significant differences (Fig. 1). Ki and FW were significantly correlated within posterolateral SNpc (Fig. 2.a), but not within striatal nuclei. Ki nigrostriatal loss was significantly correlated with bradykinesia scores (Fig. 2.b). FW and R2* were unrelated to clinical scores.Discussion
PD patients displayed a substantial dopaminergic hypofunction within the nigrostriatal system that correlated with clinical scores. Ki decline was non-homogeneous throughout the striatum, exhibiting a maximum decline within post-commissural putamen, behavior frequently reported previously2,8. In addition, a milder dopaminergic loss within SNpc has already been described using other radioligands (DAT and VMAT2)9,10. Moreover, our anteromedial/posterolateral division performed to expand pathological description revealed a higher degeneration within posterolateral ROI. This feature agrees with common understanding of SNpc neuronal vulnerability in PD11,12.Congruent with previous literature, PD patients exhibited a FW increase within posterolateral SNpc, feature already proposed as potential biomarker of PD occurrence1,13. Indeed, here we found an inverse correlation between Ki and FW, so both biomarkers are probably reflecting the death of dopaminergic cells in PD. FW also displayed a widespread striatal increment with post-commissural putamen as more affected region, following then a similar spatial distribution as Ki. This outcome is probably reflecting axonal pruning and increased spacing between membrane layers consequence of PD neurodegeneration14. This demonstrates that FW is also sensitive to microstructural alterations within the striatum, hence constituting a potential biomarker for PD occurrence and/or progression. Although FW and Ki quantification results in similar degeneration patterns, we found no significant inter-metric correlations within striatum. However, since the percentage of striatal change differed significantly (-67% in Ki vs +20% in FW in post-commissural putamen), together with an absence of microstructural alterations in the LAS, we could argue if Ki loss mediated by axonal pruning or alterations in dopaminergic reuptake/ metabolism may precede cellular death within SNpc15, a hypothesis that might be supported by post-mortem findings showing dissociation in nigrostriatal structural alterations16. Moreover, these features are consistent with the dying-back hypothesis, which postulates an early affection of the striatal afferents before progressing retrogradely towards nigral cell soma17,18.
Despite numerous studies have reported iron accumulations within SNpc19,20, here we failed to detect them. However, we found a tendency within anteromedial SNpc, so maybe this phenomenon is still emerging in early PD, although we cannot discard that iron disruption may be too local to be detected through ROI analyses like ours21.
Conclusion
Early stages of clinical PD involve both dopaminergic and microstructural alterations within the nigrostriatal system, both exhibiting similar spatial patterns. Iron disruption may be developed in later disease stages. Dopaminergic depletion was substantially higher compared to microstructural alterations, which suggests that dopaminergic denervation might precede cellular death. These results serve to improve our understanding of nigrostriatal vulnerability and degeneration in early PD.Acknowledgements
This study was supported by the Fundación de investigación HM Hospitales (Madrid). MLA was supported by and a grant from Fundación Jesús de Gangoiti Barrera.References
1. Ofori E, Pasternak O, Planetta PJ, et al. Increased free water in the substantia nigra of Parkinson’s disease: A single-site and multi-site study. Neurobiol Aging. 2015;36(2):1097-1104. doi:10.1016/j.neurobiolaging.2014.10.029
2. Pineda-Pardo JA, Sánchez-Ferro Á, Monje MHG, Pavese N, Obeso JA. Onset pattern of nigrostriatal denervation in early Parkinson’s disease. Brain. Published online March 29, 2022:awab378. doi:10.1093/brain/awab378
3. Du G, Lewis MM, Styner M, et al. Combined R2* and Diffusion Tensor Imaging Changes in the Substantia Nigra in Parkinson’s Disease. Movement Disorders. 2011;26(9). doi:10.1002/mds.23643
4. Patlak CS, Blasberg RG. Graphical evaluation of blood-to-brain transfer constants from multiple-time uptake data. Generalizations. Journal of Cerebral Blood Flow and Metabolism. 1985;5(4):584-590. doi:10.1038/jcbfm.1985.87
5. Pasternak O, Sochen N, Gur Y, Intrator N, Assaf Y. Free water elimination and mapping from diffusion MRI. Magn Reson Med. 2009;62(3):717-730. doi:10.1002/mrm.22055
6. Parker D, Ismail AAO, Wolf R, et al. Freewater estimatoR using iNtErpolated iniTialization (FERNET): Characterizing peritumoral edema using clinically feasible diffusion MRI data. PLoS One. 2020;15(5). doi:10.1371/journal.pone.0233645
7. Pei M, Nguyen TD, Thimmappa ND, et al. Algorithm for fast monoexponential fitting based on Auto-Regression on Linear Operations (ARLO) of data. Magn Reson Med. 2015;73(2). doi:10.1002/mrm.25137
8. Brück A, Aalto S, Rauhala E, Bergman J, Marttila R, Rinne JO. A follow-up study on 6-[18F]Fluoro-L-dopa uptake in early Parkinson’s disease shows nonlinear progressionin the putamen. Movement Disorders. 2009;24(7):1009-1015. doi:10.1002/mds.22484
9. Hsiao IT, Weng YH, Hsieh CJ, et al. Correlation of parkinson disease severity and 18F-DTBZ positron emission tomography. JAMA Neurol. 2014;71(6). doi:10.1001/jamaneurol.2014.290
10. Caminiti SP, Presotto L, Baroncini D, et al. Axonal damage and loss of connectivity in nigrostriatal and mesolimbic dopamine pathways in early Parkinson’s disease. Neuroimage Clin. 2017;14. doi:10.1016/j.nicl.2017.03.011
11. Fearnley JM, Lees AJ. Ageing and parkinson’s disease: Substantia nigra regional selectivity. Brain. 1991;114(5). doi:10.1093/brain/114.5.2283
12. Damier P, Hirsch EC, Agid Y, Graybiel AM. The substantia nigra of the human brain: II. Patterns of loss of dopamine-containing neurons in Parkinson’s disease. Brain. 1999;122(8). doi:10.1093/brain/122.8.1437
13. Burciu RG, Ofori E, Archer DB, et al. Progression marker of Parkinson’s disease: A 4-year multi-site imaging study. Brain. 2017;140(8):2183-2192. doi:10.1093/brain/awx146
14. Kamagata K, Hatano T, Okuzumi A, et al. Neurite orientation dispersion and density imaging in the substantia nigra in idiopathic Parkinson disease. Eur Radiol. 2016;26(8):2567-2577. doi:10.1007/s00330-015-4066-8
15. Blesa J, Trigo-Damas I, Dileone M, del Rey NLG, Hernandez LF, Obeso JA. Compensatory mechanisms in Parkinson’s disease: Circuits adaptations and role in disease modification. Exp Neurol. 2017;298. doi:10.1016/j.expneurol.2017.10.002
16. Kordower JH, Olanow CW, Dodiya HB, et al. Disease duration and the integrity of the nigrostriatal system in Parkinson’s disease. Brain. 2013;136(8). doi:10.1093/brain/awt192
17. Tagliaferro P, Burke RE. Retrograde Axonal Degeneration in Parkinson Disease. J Parkinsons Dis. 2016;6(1). doi:10.3233/JPD-150769
18. Foffani G, Obeso JA. A Cortical Pathogenic Theory of Parkinson’s Disease. Neuron. 2018;99(6). doi:10.1016/j.neuron.2018.07.028
19. Murakami Y, Kakeda S, Watanabe K, et al. Usefulness of quantitative susceptibility mapping for the diagnosis of Parkinson disease. American Journal of Neuroradiology. 2015;36(6). doi:10.3174/ajnr.A4260
20. Langkammer C, Pirpamer L, Seiler S, et al. Quantitative susceptibility mapping in Parkinson’s disease. PLoS One. 2016;11(9). doi:10.1371/journal.pone.0162460
21. Langley J, Huddleston DE, Crosson B, Song DD, Factor SA, Hu X. Multimodal assessment of nigrosomal degeneration in Parkinson’s disease. Parkinsonism Relat Disord. 2020;80. doi:10.1016/j.parkreldis.2020.09.021
Figures