3209
Imaging Nigrosome-1 using Wave-CAIPI Susceptibility Weighted Imaging at 3T
Peng Liu1, Naying He1, Youmin Zhang1, Caixia FU2, Qing Li3, E. Mark Haacke4, Yu Liu1, Wei Liu2, Xinhui Wang1, Daniel Polak5, and Fuhua Yan1
1Ruijin Hospital, Shanghai Jiao Tong University School of Medicine, Shanghai, China, 2Siemens Shenzhen Magnetic Resonance Ltd., Shenzhen, China, 3Siemens Healthineers Ltd., Shanghai, China, 4Wayne State University, Detroit, MI, United States, 5Siemens Healthcare GmbH, Erlangen, Germany
1Ruijin Hospital, Shanghai Jiao Tong University School of Medicine, Shanghai, China, 2Siemens Shenzhen Magnetic Resonance Ltd., Shenzhen, China, 3Siemens Healthineers Ltd., Shanghai, China, 4Wayne State University, Detroit, MI, United States, 5Siemens Healthcare GmbH, Erlangen, Germany
Synopsis
Keywords: Parkinson's Disease, Data Acquisition, Magnetic resonance imaging, Nigrosome-1, Susceptibility Weighted Imaging
In this work, the ability of Wave-CAIPI accelerated 3D SWI for imaging the Nigrosome-1(N1) sign was evaluated. Short-TE, long-TE and conventional SWI protocols were compared for the detection of the N1 sign. Qualitative and quantitative analyses were used to evaluate the presence or absence of the N1 sign and the contrast-to-noise (CNR) of the N1 sign relative to adjacent tissues. The results showed that Wave-CAIPI SWI had no significant differences with conventional SWI for recognizing the N1 sign. Wave-CAIPI SWI can be a replacement of conventional SWI (4 min 52s) with shorter scan times of 2min 26s covering the whole brain.Introduction
The nigrosome (N1) sign has emerged as an important biomarker in Parkinson's disease (PD). It can reflect early changes of iron deposition in the substantia nigra (SN) [1]. Gradient echo MRI has been used to image the N1 sign. However, the identification of the N1 sign is still subjective and depends on the scanning sequences and parameters. Susceptibility Weighted Imaging (SWI) and its variants have been widely used and have shown their ability to detect the N1 sign [2-3]. But conventional SWI protocols accelerated with GRAPPA or SENSE techniques still have long data acquisition times, making them sensitive to motion. In this study, we applied Wave CAIPI [4] to: 1) compare different techniques with conventional SWI regarding N1 detection and CNR and 2) determine the optimal echo time (TE) to display the N1 sign.Methods
Forty volunteers were enrolled and underwent head MRI on a 3T system (MAGNETOM Prisma; Siemens Healthcare, Erlangen, Germany) equipped with a 64-channel head-neck receive coil. The 3D GRE sequence with Wave-CAIPI was performed twice with short and long TE acquisitions, respectively. Other imaging parameters are listed in Table 1. To compare Wave-CAIPI SWI and conventional GRAPPA SWI, we selected the same TE=22.5ms, which is routinely used in the clinic, and compared three different techniques—magnitude, SWI and true-SWI [5] for N1 detection purposes. To improve the signal-to-noise ratio of Wave-CAIPI SWI, two echoes (15ms and 30ms) were combined to get an averaged TE of 22.5ms. The magnitude, filtered phase and the default SWI processing were all performed inline. The true-SWI data were obtained by STAGE [6] processing as they show the N1 sign more clearly. For Wave-CAIPI, we then compared different TE, including: 15ms, 22.5ms, 30ms and 37.5ms for true-SWI to find the optimal TE to display the N1 sign. Qualitative and quantitative analysis were used. The N1 sign was identified visually for each technique by an experienced radiologist. The CNR was calculated on the slice which had the best visibility of the N1 sign via the formula:$$CNR=\frac{\mid\left(S_{N1}\right)-\left(S_{SN}\right)\mid}{STD_{SN}}$$
where SN1 and SSN are the signal intensity of the region of interests (ROIs) in N1 and the surrounding substantia nigra (SN), respectively, and STDSN is the signal standard deviation from an ROI drawn in a uniform adjacent area of white matter.
Results
The data with motion artifacts and missing images were removed and, finally, 33 cases (13 males and 20 females, age: 54 ± 13) were included. For these cases, the N1 sign could be identified in every technique for GRAPPA SWI and Wave-CAIPI SWI. Table 2 compares the CNR of the N1 sign for GRAPPA SWI and Wave-CAIPI SWI. There are no significant differences in magnitude (P=0.071), SWI (P=0.356) and true-SWI (P=0.921). Fig. 1 shows the data from a 70-year-old female where the N1 sign is visible in all images. The CNR of N1 sign in true-SWI with Wave-CAIPI for different TEs are shown in Fig. 2. There were no significant differences among them (P=0.226). Fig. 3 shows the true-SWI for these TEs from the same subject as in Fig. 1.Discussion and Conclusions
The Wave-CAIPI accelerated SWI has comparable performance to the GRAPPA accelerated SWI by technique in imaging the N1 sign. Wave-CAIPI SWI has the distinct advantage that it can provide quick and effective scanning for the whole brain in only 2min 26s, which is twice as fast as the conventional SWI. For the different TEs used in the Wave-CAIPI true-SWI, there were no significant differences among them in detecting the N1 sign, which might be attributed to the reason that true-SWI was calculated by using the quantitative susceptibility maps as masks. This result is different with that of SWI using the phase maps as masks, in which TE is an important factor influencing the detection of the N1 sign [7]. Therefore, we conclude that the conventional TE of 22.5ms was enough for Wave-CAIPI true-SWI to identify the N1 sign and there is no need for longer TEs and longer scanning time. In conclusion, Wave-CAIPI SWI or true-SWI may serve as a practical replacement of conventional GRAPPA accelerated SWI to visualize and identify the N1 sign.Acknowledgements
No acknowledgement found.References
1. Cheng Z., He N., Huang P., et al., Imaging the Nigrosome 1 in the substantia nigra using susceptibility weighted imaging and quantitative susceptibility mapping: An application to Parkinson's disease. Neuroimage Clin, 2020. 25: 102103.2. Schwarz S.T., Afzal M., Morgan P.S., et al., The 'swallow tail' appearance of the healthy nigrosome-a new accurate test of Parkinson's disease: a case-control and retrospective cross-sectional MRI study at 3T. PLoS One, 2014. 9: e93814.
3. Nam Y., Gho S.M., Kim D.H., et al., Imaging of nigrosome 1 in substantia nigra at 3T using multiecho susceptibility map-weighted imaging (SMWI). J Magn Reson Imaging, 2017. 46: 528–536.
4. Bilgic B., Gagoski B.A., Cauley S.F. et al., Wave-CAIPI for highly accelerated 3D imaging. Magn Reson Med, 2015. 73: 2152–2162.
5. Liu S., Mok K., Neelavalli J., et al., Improved MR venography using quantitative susceptibility-weighted imaging. J Magn Reson Imaging, 2014. 40: 698–708.
6. Chen Y., Liu S., Wang Y., et al., STrategically Acquired Gradient Echo (STAGE) imaging, part I: Creating enhanced T1 contrast and standardized susceptibility weighted imaging and quantitative susceptibility mapping. Magn Reson Imaging, 2018. 46:130-139.
7. Fu C., Zhang Y., Li Q., et al., Optimization of TE and Postprocessing for Nigrosome-1 Imaging using Wave-CAIPI Susceptibility Weighted Imaging at 3T. ISMRM, 2022.
Figures
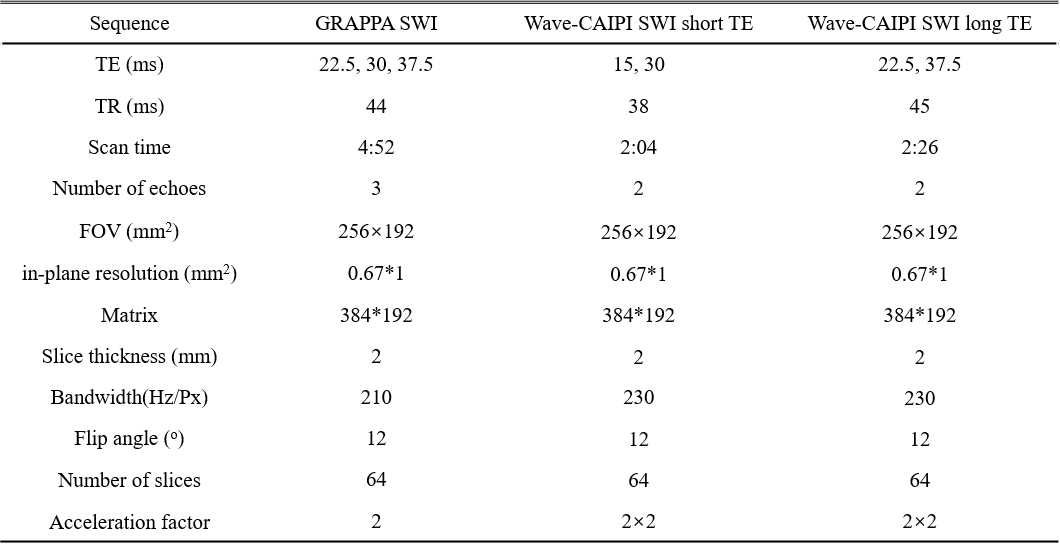
Table 1. Details of the
imaging parameters.

Table 2. CNR for conventional GRAPPA SWI and Wave-CAIPI SWI.
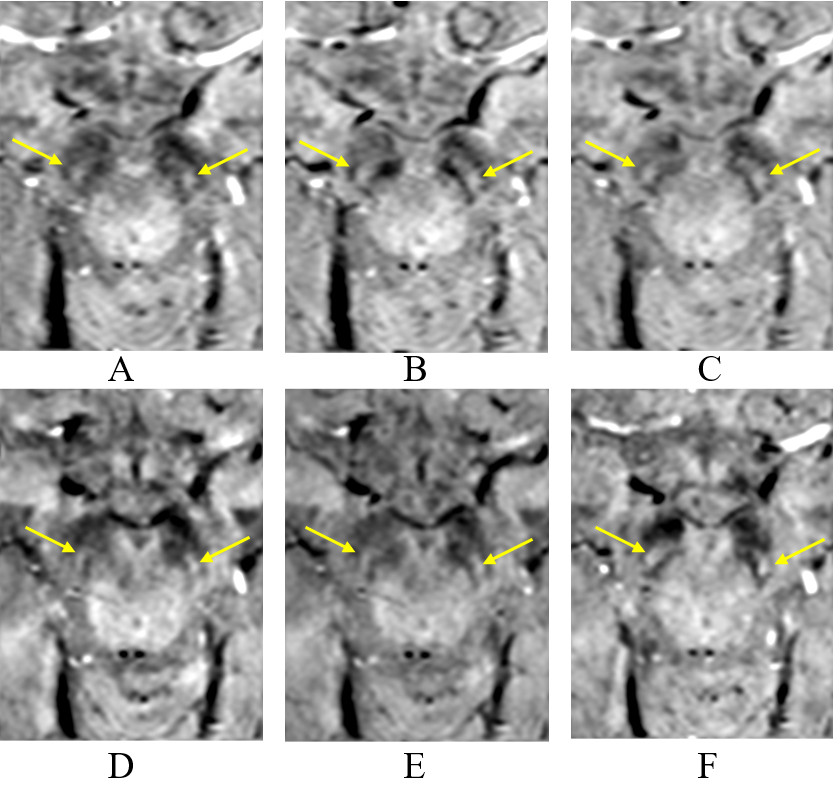
Figure 1. Different images for a 70-year-old female subject, includes the magnitude (A), SWI (B) and true-SWI (C) of conventional GRAPPA SWI with TE=22.5ms and the magnitude (D), SWI (E) of the Wave-CAIPI SWI with averaged TE=22.5ms and the corresponding true-SWI (F).
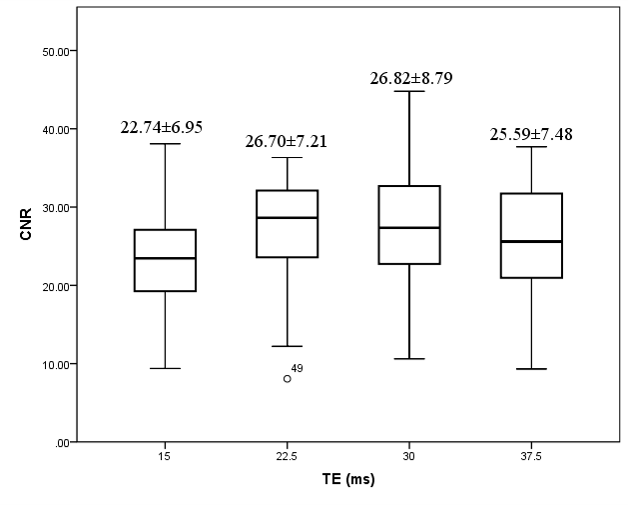
Figure 2. The CNR for different TEs in Wave-CAIPI true-SWI. Although TE = 22.5ms is better on average than TE = 15ms, higher echo times did not reveal any advantage. Higher echo times can sometimes lead to larger dephasing effects and reduction of image quality in the midbrain and around the substantia nigra.
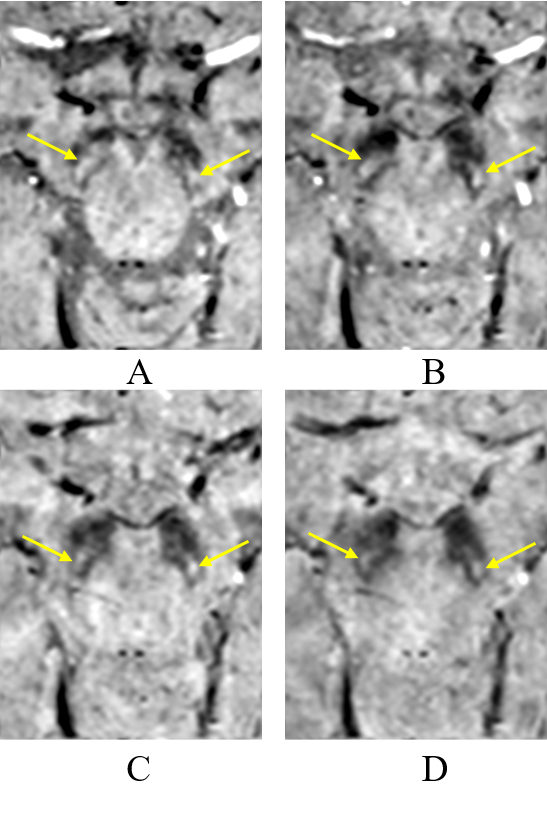
Figure 3. Wave-CAIPI SWI images with TE of 15ms (A), 22.5ms (B), 30ms (C) and 37.5ms (D) of the same subject as in Fig.1.
DOI: https://doi.org/10.58530/2023/3209