3208
Amplitude of low-frequency fluctuation-based regional radiomics similarity network: biomarker for Parkinson’s disease1Department of Radiology, Xiang’an Hospital of Xiamen Uneversity,School of Medicine, Xiamen University, Xiamen, China
Synopsis
Keywords: Parkinson's Disease, Brain Connectivity
Development of more clinically effective and quantifiable biomarkers to detect PD is urgently needed. It confirmed that regional radiomics similarity network (R2SN) had high reproducibility and a biological basis and provided a new perspective for understanding the human brain. Our study showed that R2SN constructed based on ALFF had good reproducibility and stability, and is biological plausibility. We found PD-related brain regions mainly located in the default-mode, sensorimotor, executive control, visual, frontoparietal network, as well as cerebellum, and striatum. ALFF-based R2SN is a novel, robust potential neuroimaging biomarker for PD and could provide new insights into connectome reorganization in PD.Introduction
Parkinson’s disease (PD) is one of the most prevalent progressive neurodegenerative diseases 1-3, and its diagnosis is challenging owing to its highly heterogeneous nature 2,4,5. The mechanism of PD is still not well clear 6-8. Therefore, development of more clinically effective and quantifiable biomarkers to detect PD is urgently needed. The functional connectivity (FC) 9,10, as one of the most commonly used rs-fMRI measurements, has been widely used in neuropsychiatric disorders. The amplitude of low-frequency fluctuation (ALFF), as one of the most commonly used rs-fMRI measurements, has been widely used in neuropsychiatric disorders 11-13. The brain network is a commonly used technique in neuroscience that provides a method to understand brain working mechanisms and sensitive biomarkers to identify neuropsychiatric disorders14-17. Recently, Zhao et al. 18 proposed a novel method of brain network construction called regional radiomics similarity network (R2SN). They confirmed that R2SN had high reproducibility and a biological basis and provided a new perspective for understanding the human brain 18,19. The present study aimed to construct R2SN based on ALFF to assess the feasibility of ALFF-based R2SN in differentiating patients with PD from healthy controls (HCs). Meanwhile, we investigated the association of R2SN indices with clinical characteristics of patients with PD, to explore potential neuroimaging biomarkers and underlying neural mechanisms for PD.Methods
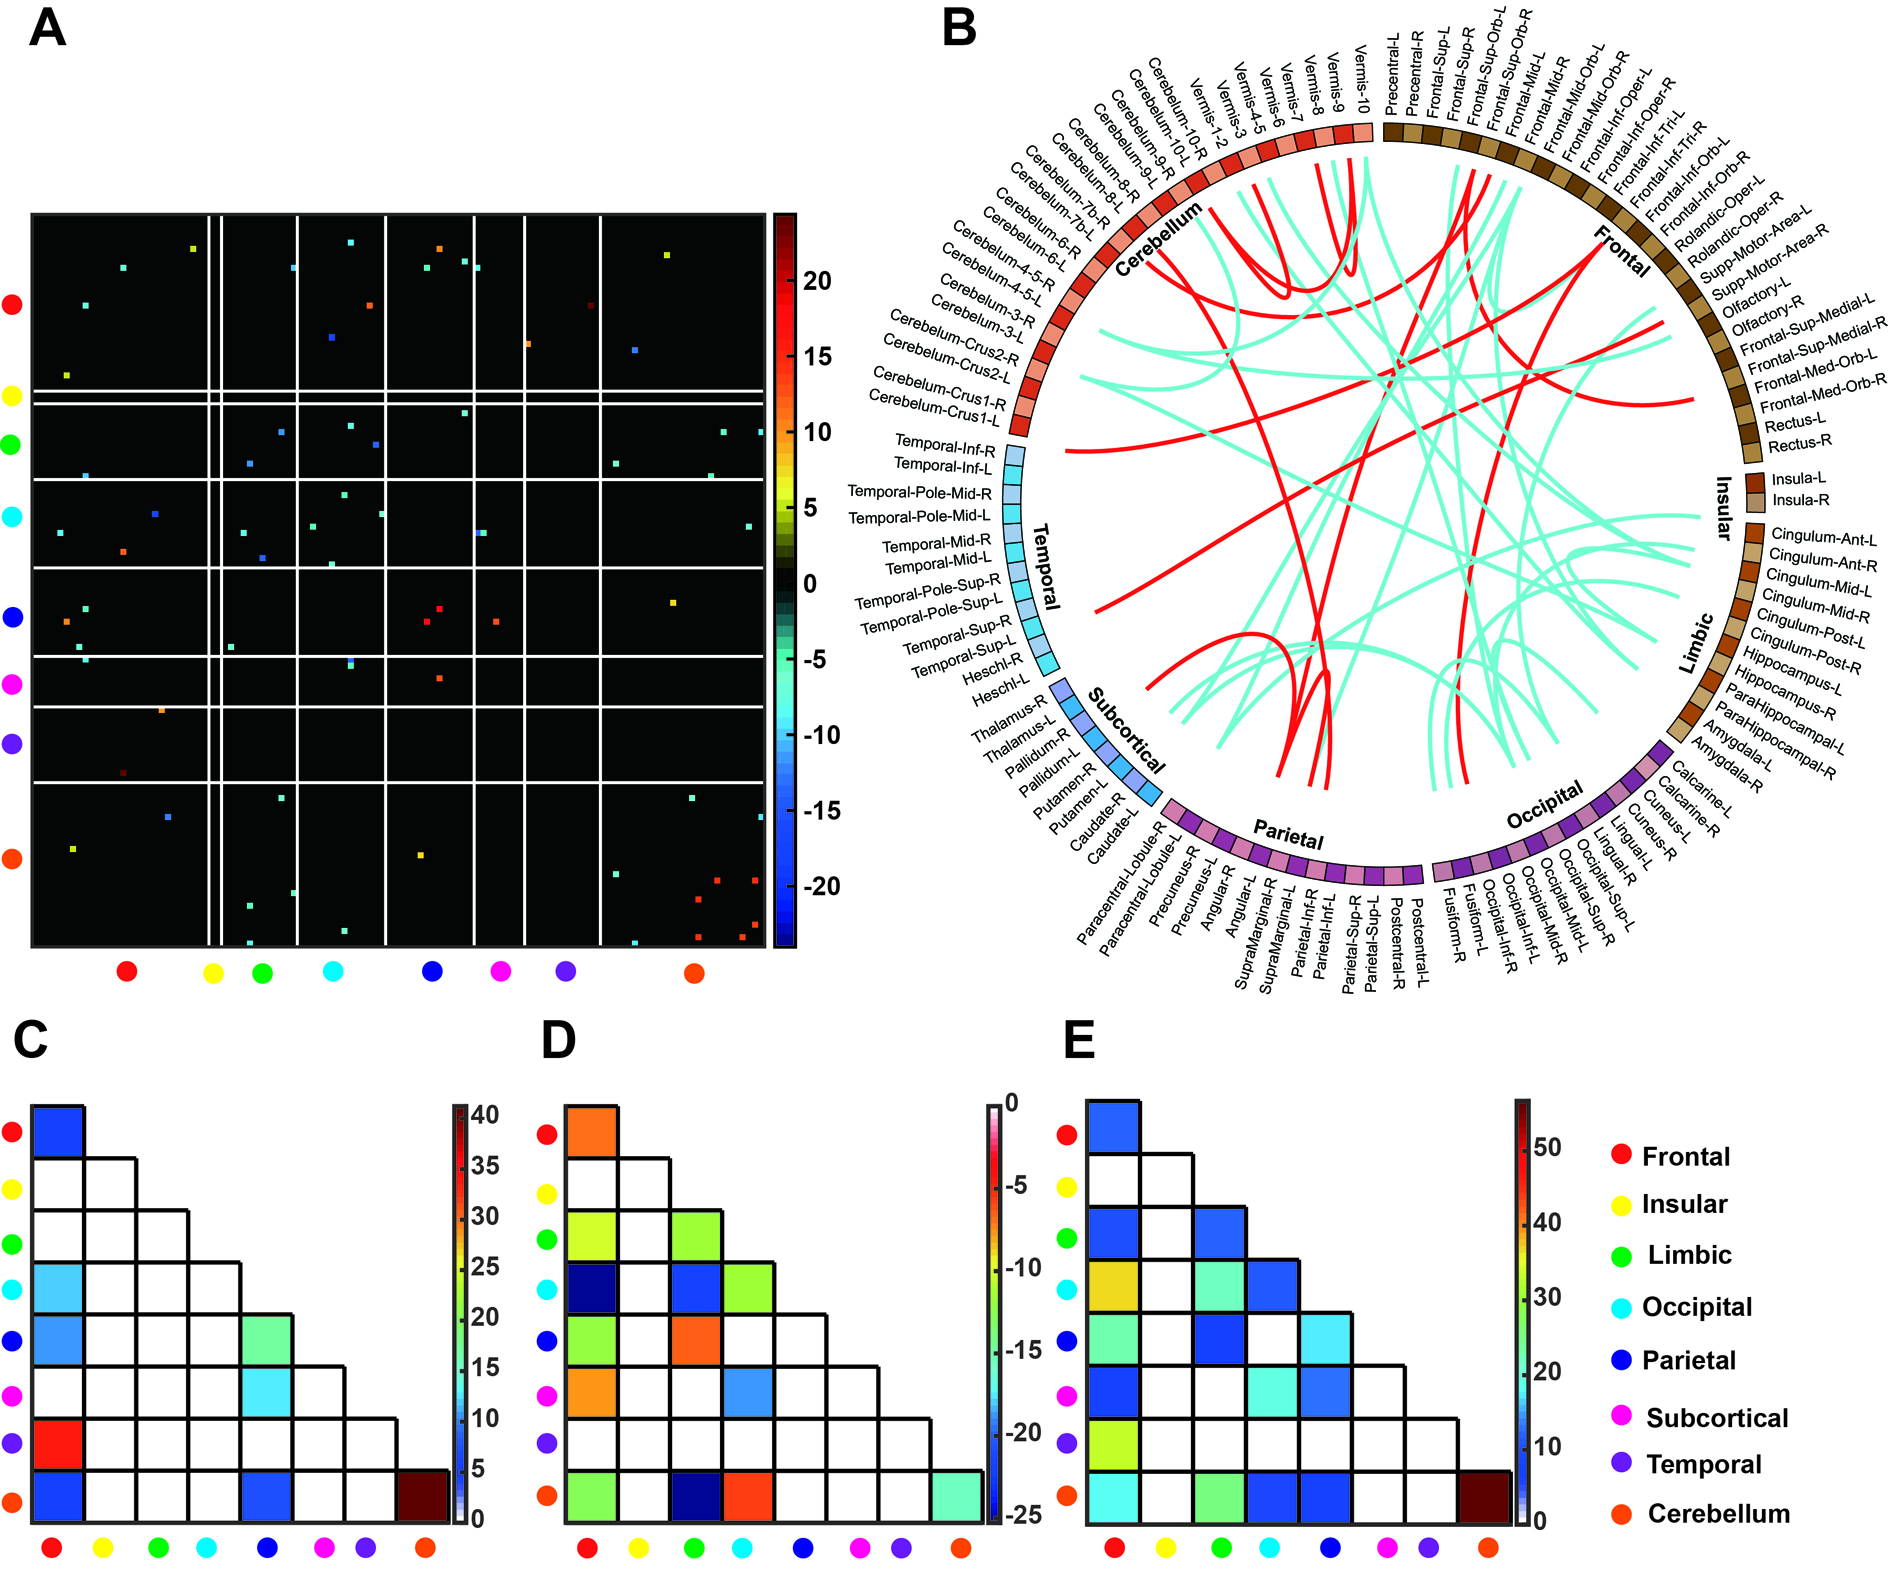
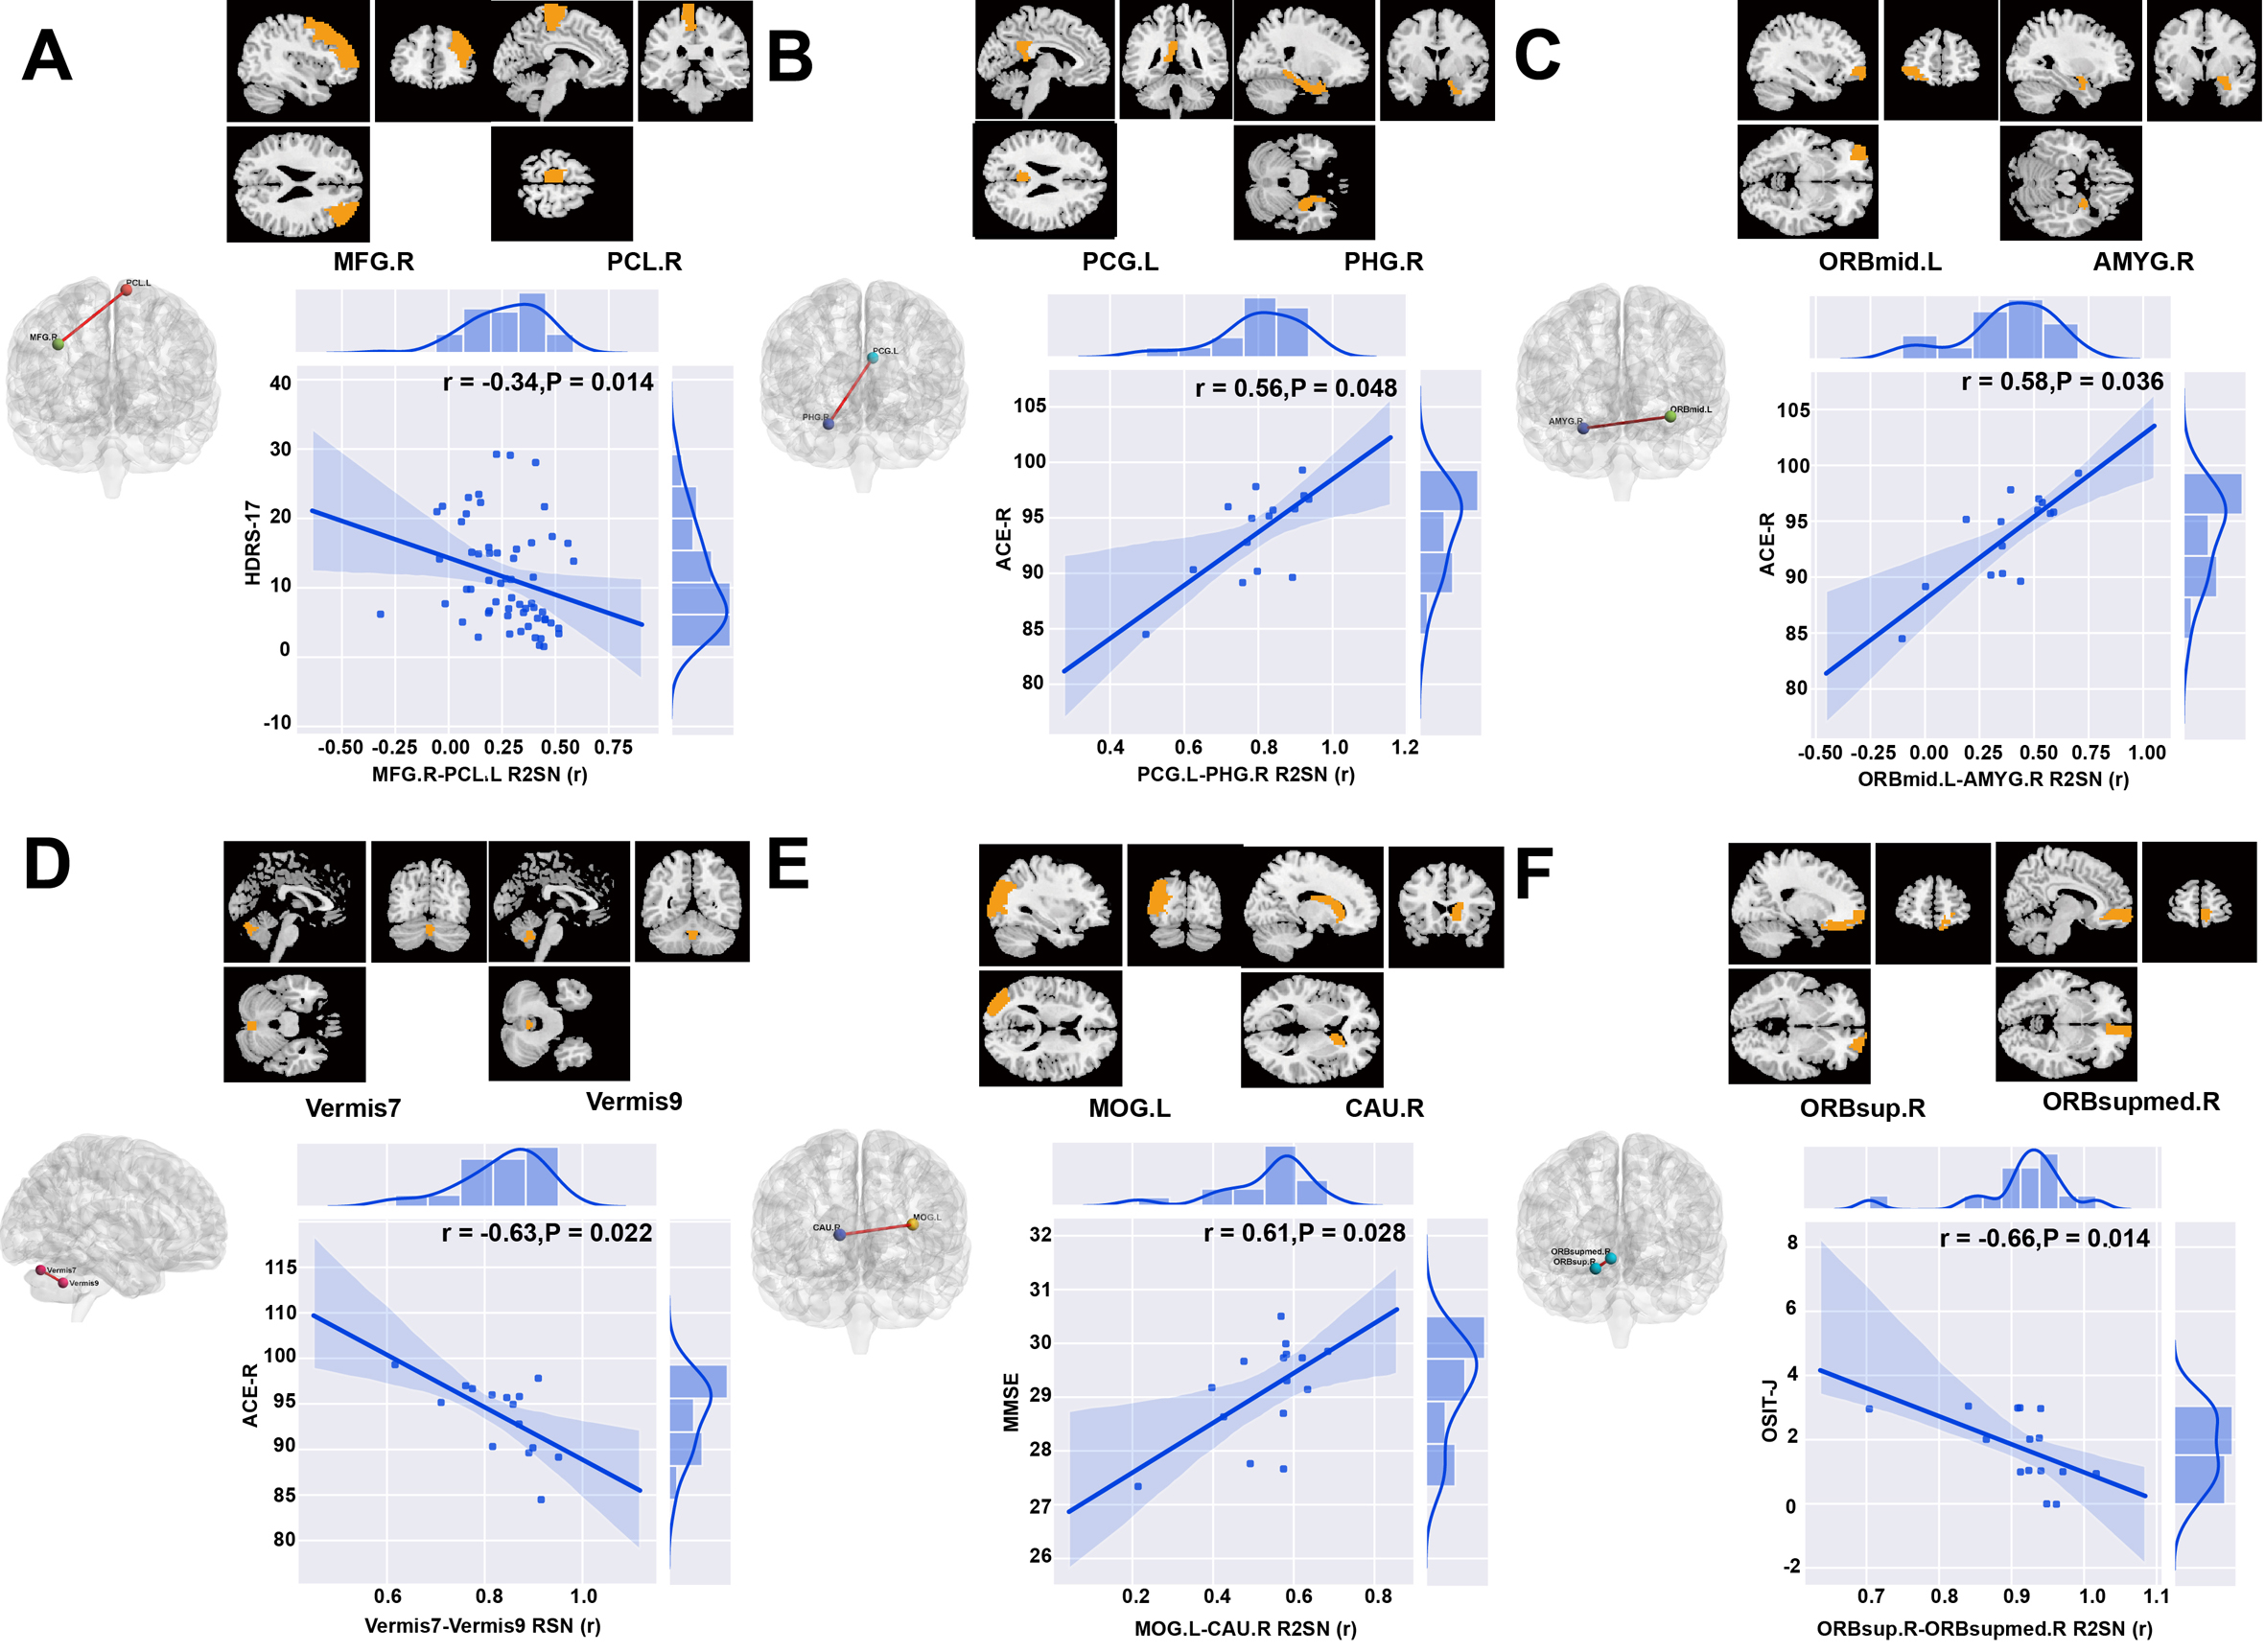
Data from two independent centers were included in this study; the primary set contained 59 patients with PD and 41 age-matched HCs, and the independent external validation set contained 15 patients with PD and 15 HCs. The automatic anatomical labeling (AAL) 116 atlas was used to construct the R2SN. The mean and standard deviation of R2SNs in patients with PD and HCs were calculated separately to estimate the reproducibility and stability of the R2SN. The t-tests and least absolute shrinkage and selection operator were used for feature selection, nested 10-fold cross-validation20 (repeated 100 times) for hyper-parameter optimization and model evaluation, and Gaussian radial basis function support vector machine was used to build the classification model. We tested our results by using the independent external validation set and repeated the above operations with Brainnetome 246 atlas to validate our proposed method. We selected features which absolute value of weights greater than 20% of the maximum absolute weight in 1000 iterations as “discriminative features”21-23 and calculated Spearman partial correlation between discriminative features and clinical evaluations.Results
There were no significant differences between patients with PD and HCs in demographic and clinical characteristics in the primary and independent external validation sets. The R2SNs constructed using AAL 116 and Brainnetome 246 atlases showed good reproducibility and stability. The average AUC and accuracy of the model were 0.85±0.02 and 0.81±0.03 in the training set (both P<0.001) and 0.77 and 0.70 in the external independent test set (both P<0.05). When we used the Brainnetome 246 atlas, the average AUC and accuracy were 0.83±0.03 and 0.76±0.03, respectively (both P<0.001). We identified 35 discriminative features, mainly located in the default-mode, sensorimotor, executive control, visual, frontoparietal network, as well as cerebellum, and striatum. Spearman partial correlation analysis showed that discriminative features were correlated with PD symptom scores (all P < 0.05).Conclusions
With good reproducibility and biological plausibility, ALFF-based R2SN is a novel, robust potential neuroimaging biomarker for PD and could provide new insights into connectome reorganization in PD, which may help to elucidate the underlying pathophysiological mechanisms of PD.Keywords
Parkinson's disease; amplitude of low-frequency fluctuation (ALFF); network; Machine Learning; biomarkerAcknowledgements
his study was supported by the Scientiêc Research Foundationfor Advanced Talents, Xiang’an Hospital of XiamenUniversity(No.PM201809170011).References
1. Kim J, Criaud M, Cho SS, et al. Abnormal intrinsic brain functional network dynamics in Parkinson's disease. Brain. Nov 1 2017;140(11):2955-2967. doi:10.1093/brain/awx233
2. Zhang J, Gao Y, He X, et al. Identifying Parkinson's disease with mild cognitive impairment by using combined MR imaging and electroencephalogram. Eur Radiol. Oct 2021;31(10):7386-7394. doi:10.1007/s00330-020-07575-1
3. Shu ZY, Cui SJ, Wu X, et al. Predicting the progression of Parkinson's disease using conventional MRI and machine learning: An application of radiomic biomarkers in whole-brain white matter. Magn Reson Med. Mar 2021;85(3):1611-1624. doi:10.1002/mrm.28522
4. Sheng W, Guo T, Zhou C, et al. Altered Cortical Cholinergic Network in Parkinson's Disease at Different Stage: A Resting-State fMRI Study. Front Aging Neurosci. 2021;13:723948. doi:10.3389/fnagi.2021.723948
5. Hu J, Xiao C, Gong D, Qiu C, Liu W, Zhang W. Regional homogeneity analysis of major Parkinson's disease subtypes based on functional magnetic resonance imaging. Neurosci Lett. Jul 27 2019;706:81-87. doi:10.1016/j.neulet.2019.05.013
6. Tuovinen N, Seppi K, de Pasquale F, et al. The reorganization of functional architecture in the early-stages of Parkinson's disease. Parkinsonism Relat Disord. May 2018;50:61-68. doi:10.1016/j.parkreldis.2018.02.013
7. Peng B, Wang S, Zhou Z, et al. A multilevel-ROI-features-based machine learning method for detection of morphometric biomarkers in Parkinson's disease. Neurosci Lett. Jun 9 2017;651:88-94. doi:10.1016/j.neulet.2017.04.034
8. Huang LC, Wu PA, Lin SZ, Pang CY, Chen SY. Graph theory and network topological metrics may be the potential biomarker in Parkinson's disease. J Clin Neurosci. Oct 2019;68:235-242. doi:10.1016/j.jocn.2019.07.082
9. Lin H, Cai X, Zhang D, Liu J, Na P, Li W. Functional connectivity markers of depression in advanced Parkinson's disease. Neuroimage Clin. 2020;25:102130. doi:10.1016/j.nicl.2019.102130
10. Shao J, Dai Z, Zhu R, et al. Early identification of bipolar from unipolar depression before manic episode: Evidence from dynamic rfMRI. Bipolar Disord. Dec 2019;21(8):774-784. doi:10.1111/bdi.12819
11. Shi D, Zhang H, Wang G, et al. Machine Learning for Detecting Parkinson's Disease by Resting-State Functional Magnetic Resonance Imaging: A Multicenter Radiomics Analysis. Front Aging Neurosci. 2022;14:806828. doi:10.3389/fnagi.2022.806828
12. Pang H, Yu Z, Yu H, et al. Use of machine learning method on automatic classification of motor subtype of Parkinson's disease based on multilevel indices of rs-fMRI. Parkinsonism Relat Disord. Sep 2021;90:65-72. doi:10.1016/j.parkreldis.2021.08.003
13. Tian ZY, Qian L, Fang L, et al. Frequency-Specific Changes of Resting Brain Activity in Parkinson's Disease: A Machine Learning Approach. Neuroscience. Jun 1 2020;436:170-183. doi:10.1016/j.neuroscience.2020.01.049 14. Chen X, Zhang H, Gao Y, et al. High-order resting-state functional connectivity network for MCI classification. Hum Brain Mapp. Sep 2016;37(9):3282-96. doi:10.1002/hbm.23240
15. Li G, Liu Y, Zheng Y, et al. Large-scale dynamic causal modeling of major depressive disorder based on resting-state functional magnetic resonance imaging. Hum Brain Mapp. Mar 2020;41(4):865-881. doi:10.1002/hbm.24845
16. Wang S, Zhang Y, Lei J, Guo S. Investigation of sensorimotor dysfunction in Parkinson disease by resting-state fMRI. Neurosci Lett. Jan 18 2021;742:135512. doi:10.1016/j.neulet.2020.135512
17. Suo X, Lei D, Li N, et al. Disrupted morphological grey matter networks in early-stage Parkinson's disease. Brain Struct Funct. Jun 2021;226(5):1389-1403. doi:10.1007/s00429-020-02200-9
18. Zhao K, Zheng Q, Che T, et al. Regional radiomics similarity networks (R2SNs) in the human brain: Reproducibility, small-world properties and a biological basis. Netw Neurosci. 2021;5(3):783-797. doi:10.1162/netn_a_00200
19. Zhao K, Zheng Q, Dyrba M, et al. Regional Radiomics Similarity Networks Reveal Distinct Subtypes and Abnormality Patterns in Mild Cognitive Impairment. Adv Sci (Weinh). Apr 2022;9(12):e2104538. doi:10.1002/advs.202104538
20. Wottschel V, Chard DT, Enzinger C, et al. SVM recursive feature elimination analyses of structural brain MRI predicts near-term relapses in patients with clinically isolated syndromes suggestive of multiple sclerosis. Neuroimage Clin. 2019;24:102011. doi:10.1016/j.nicl.2019.102011
21. Yin T, Sun R, He Z, et al. Subcortical-Cortical Functional Connectivity as a Potential Biomarker for Identifying Patients with Functional Dyspepsia. Cereb Cortex. Dec 10 2021;doi:10.1093/cercor/bhab419 22. Ecker C, Marquand A, Mourao-Miranda J, et al. Describing the brain in autism in five dimensions--magnetic resonance imaging-assisted diagnosis of autism spectrum disorder using a multiparameter classification approach. J Neurosci. Aug 11 2010;30(32):10612-23. doi:10.1523/JNEUROSCI.5413-09.2010
23. Yang X, Hu X, Tang W, et al. Multivariate classification of drug-naive obsessive-compulsive disorder patients and healthy controls by applying an SVM to resting-state functional MRI data. BMC Psychiatry. Jul 5 2019;19(1):210. doi:10.1186/s12888-019-2184-6
Figures
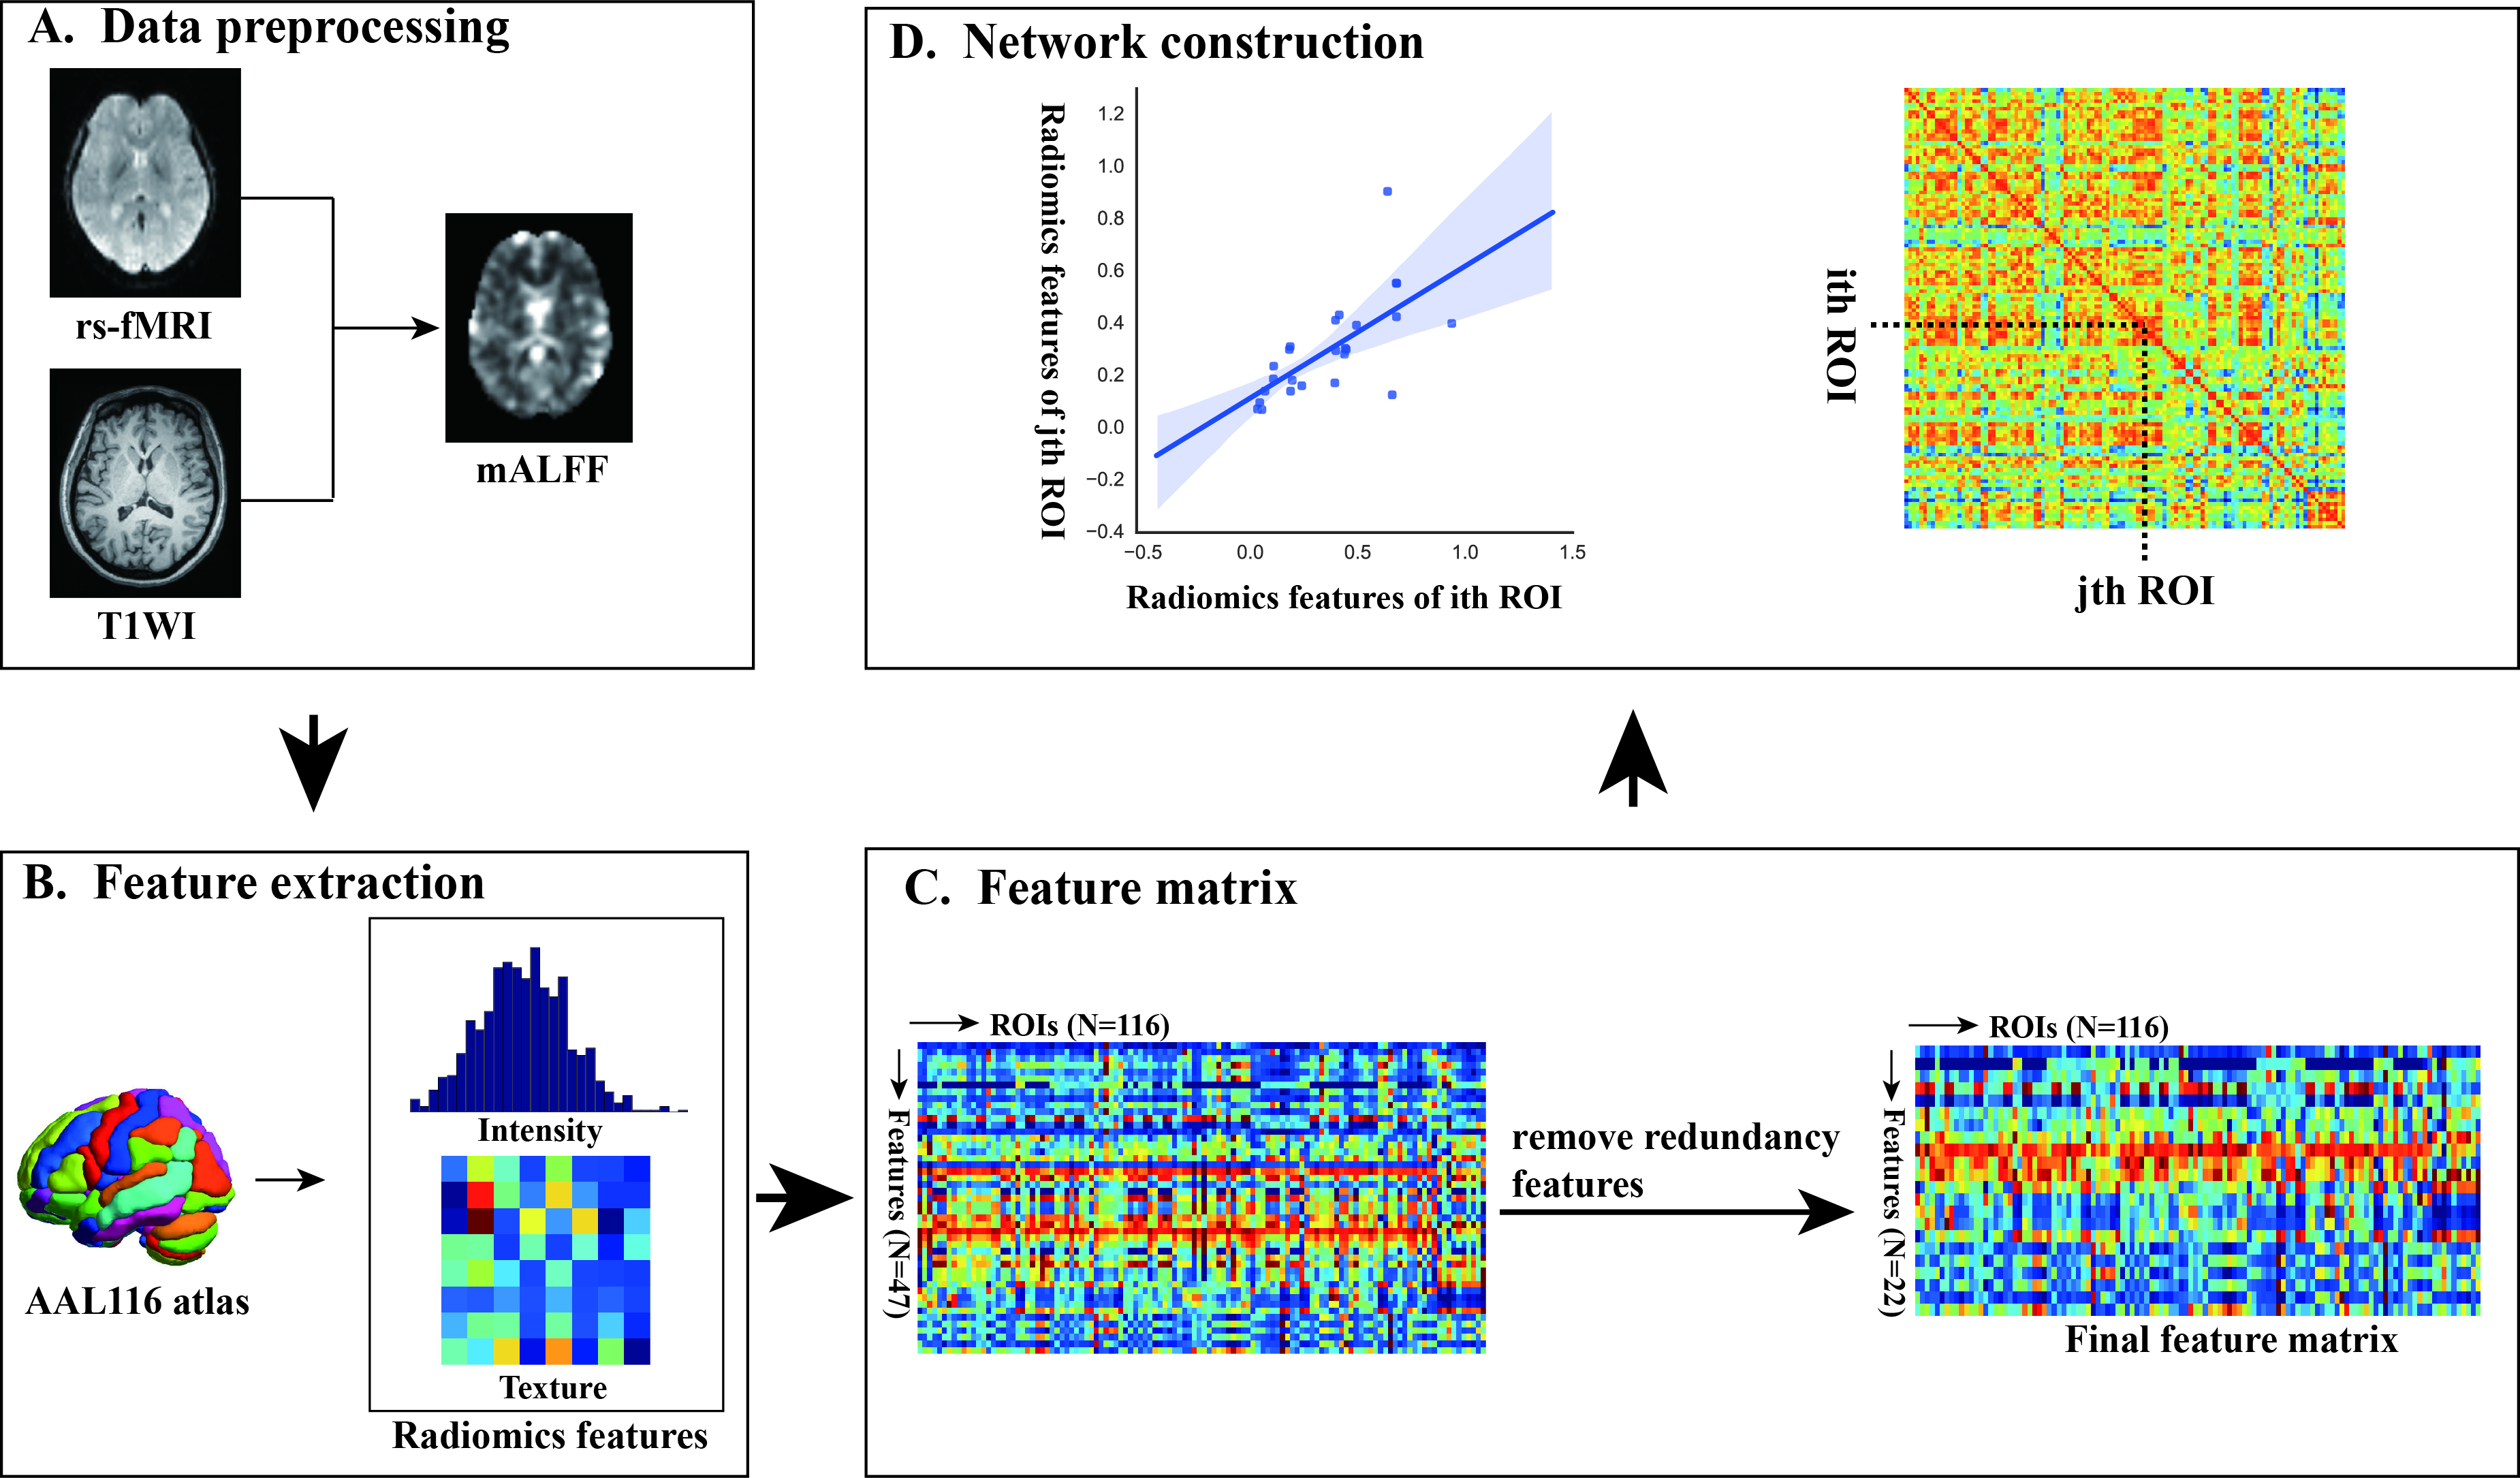
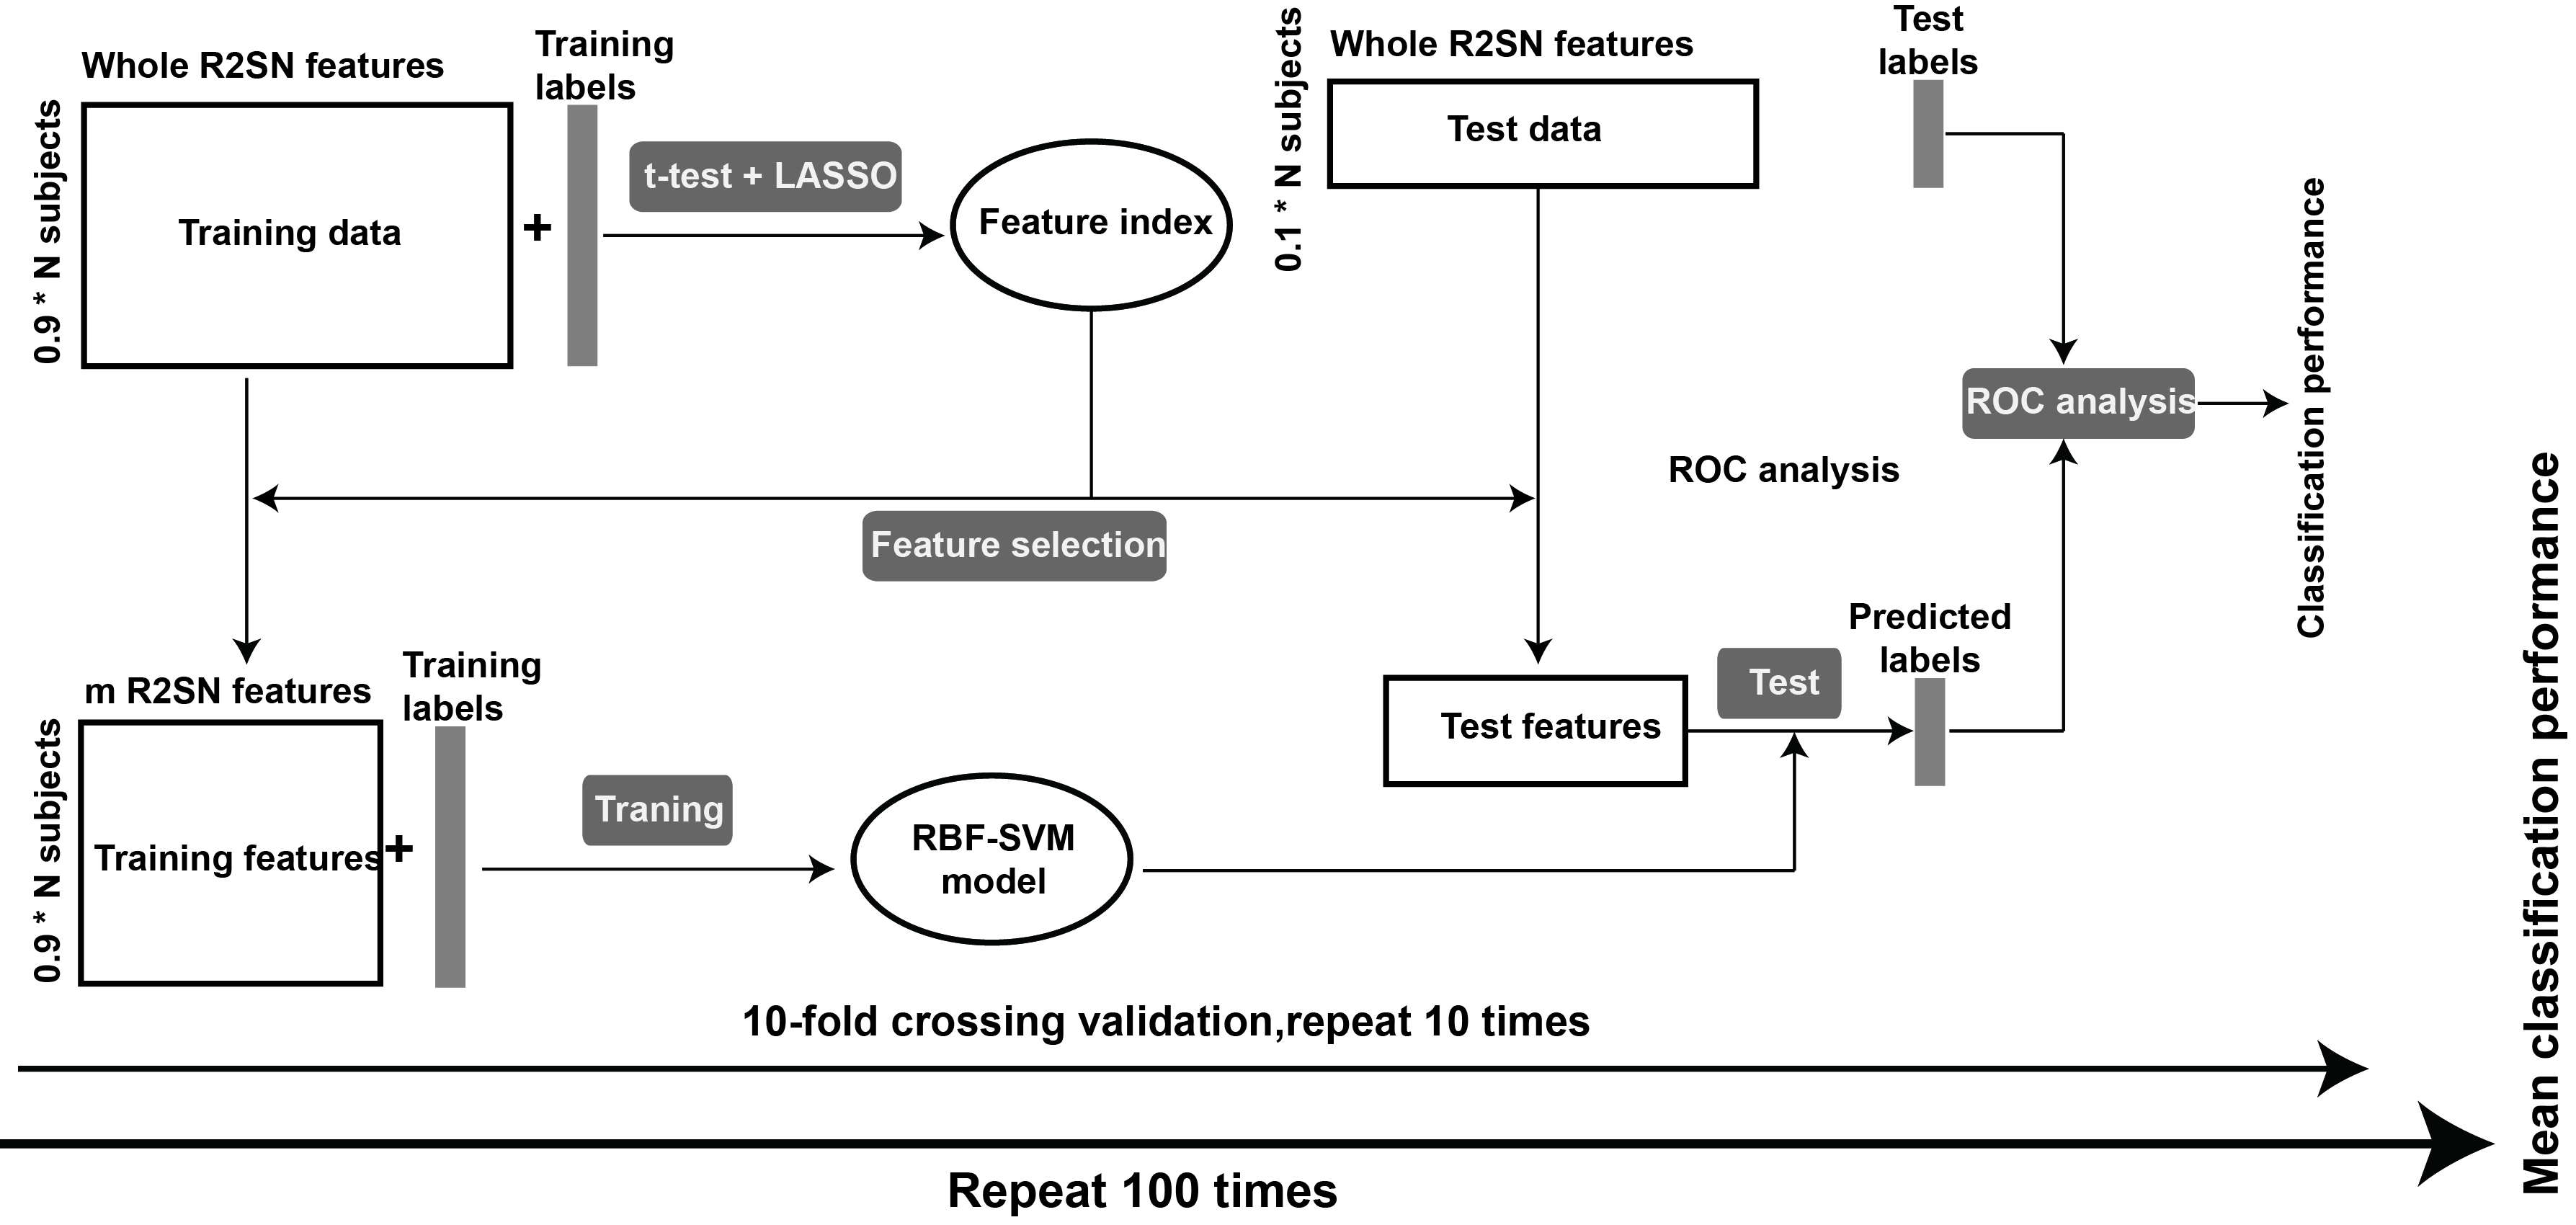
Figure 2 Schematic overview of the feature selection and classification framework. Feature selectionand classification were executed based on the 10-fold cross-validation strategy. The t-test andLASSO were applied for feature selection, and an SVM with Gaussian radial basis function wasapplied to construct the classification model. The 10-fold cross-validation framework was repeatedlyperformed 100 times to get the final mean classification performance.