3206
Quantitative Iron-Neuromelanin MRI Matches Expert Visual Performance and Is Associated with Parkinson’s Disease Severity
Septian Hartono1,2, Robert Chen3, Thomas Welton1, An Sen Tan3, Weiling Lee3, Peik Yen Teh3, Celeste Chen1, Wenlu Hou3, Wei Ping Tham3, Ee Wei Lim1, Prakash Kumar1, Yao-Chia Shih4, Kuan Jin Lee5, Louis Chew Seng Tan1, Eng King Tan1, and Ling Ling Chan3
1National Neuroscience Institute, Singapore, Singapore, 2Duke-NUS Medical School, Singapore, Singapore, 3Singapore General Hospital, Singapore, Singapore, 4Yuan Ze University, Taoyuan, Taiwan, 5Institute of Bioengineering and Bioimaging, Singapore, Singapore
1National Neuroscience Institute, Singapore, Singapore, 2Duke-NUS Medical School, Singapore, Singapore, 3Singapore General Hospital, Singapore, Singapore, 4Yuan Ze University, Taoyuan, Taiwan, 5Institute of Bioengineering and Bioimaging, Singapore, Singapore
Synopsis
Keywords: Parkinson's Disease, Parkinson's Disease
Nigrosome-1, a subregion of substantia nigra (SN), and neuromelanin have been identified as good biomarkers of Parkinson's disease (PD) pathology. We investigated the diagnostic accuracy of quantitative iron-neuromelanin parameters and compared these against visual analysis of nigrosome-1 and neuromelanin hyperintensity as proxies of nigral dopaminergic neurodegeneration. Susceptibility map-weighted imaging surpassed neuromelanin sensitive MRI in blinded visual PD classification; reader expertise affected performance. Composite quantitative iron-neuromelanin marker matched diagnostic accuracy of expert reader in visual evaluation of nigrosome-1 using susceptibility map-weighted imaging, potentially improving diagnostic confidence in non-experts. Quantitative susceptibility mapping showed moderate negative correlation with motor dysfunction in PD patients.Introduction
Iron- and neuromelanin-sensitive (NMS) MRI are promising non-invasive markers of nigrostriatal integrity in Parkinson’s disease (PD). However, these studies in the literature are often limited by small sample sizes. In a large case-control PD cohort, we evaluated the diagnostic accuracy of quantitative iron-neuromelanin parameters and compared these against visual analysis of nigrosome-1 and neuromelanin hyperintensity as proxies of nigral dopaminergic neurodegeneration.Methods
This study was approved by the local ethics board and informed consent obtained from all participants. Eighty PD patients and 111 healthy controls (HC) were included in the study (Figure 1). All subjects underwent brain MRI scan on a 3T scanner.3D high resolution T2* SWI images were acquired using a multi-echo gradient echo sequence with TR=48ms, TE=13.77/26.39/39ms, FA=20°, in-plane resolution=0.5x0.5x1mm3, number of slices=32, scan duration 4:09mins. An oblique-coronal imaging plane oriented perpendicular to the midbrain structure was chosen.1 A high-resolution NMS imaging was performed using a T1 TSE sequence with TR/TE=938/15ms, voxel size=0.5x0.5x3mm3, number of slices=13, scan duration 10:25mins. The imaging tilting and slice placement was copied from the SWI acquisition. QSM and SMWI images were reconstructed from the multi-echo GRE images with SMWI software (Seoul National University, Seoul, South Korea).1
Visual assessment of SMwI and NMS images was performed by 4 readers: Reader 1 with >20 years of neuroradiology practice, Reader 2 with >10 years and Reader 3 with a year of neuroradiology practice, and Reader 4 with 6 years of non-neuroradiology practice. SMwI images were rated according to a 2-point ordinal scale: 0, normal visualization of a hyperintense nigrosome-1 in the SN; 1, possible or definite abnormality with loss of nigrosome-1. NMS images were likewise rated: 0, normal high signal intensity bilaterally in the SN without volume loss; 1, possible or definite SN abnormality with reduced signal or size unilaterally or bilaterally.
Blinded manual SN segmentation was independently performed by Reader 1 and Reader 5, a postdoctoral researcher. SMwI images were cranio-caudally inspected to identify the first slice where the red nuclei were barely or no longer seen. The SN mask was drawn on this and two inferior consecutive slices. The hyperintense SN was similarly segmented on QSM and NMS images. The mid-slice of the latter corresponded to the first slice used for SN segmentation on SMwI (Figure 2).2
The following parameters were extracted from the SN masks and background ROIs using MATLAB (Mathworks, MA): mean signal intensity (SI) on NMS/SMwI or susceptibility on QSM, and size of the SN masks. Mask sizes after optimized voxel-wise thresholding for low susceptibility (<70 ppb) on QSM2, high/low SI relative to the background ROI on NMS/SMwI2,3, and SI_maxmin ratio as defined by the ratio of the 90th to 10th percentile of SI in the NMS mask were also obtained.
Results
PD classification performance (Figure 3) was variable across Readers 1-4 on SMwI (sensitivity 74-100%, specificity 80-98%, accuracy 78-99%) and NMS (58-100%, 59-93%, 58-88%), and superior in experts (Readers 1-2).Group differences, effect sizes and classification performance for quantitative parameters are detailed in Figure 4.
SN masks were more hyperintense and contained higher contrast range (SI_maxmin ratio) within in HC than in patients. Good PD classification performance was seen with both SI_maxmin ratio (sensitivity 80.2%, specificity 84.1%, AUC 0.86) and mask size after SI thresholding (79.3%, 74.4%, 0.83).
SN masks were smaller and contained higher mean susceptibility in patients than in HC. Good classification performance was seen with mask size after SI thresholding (sensitivity 76.6%, specificity 81.7%, AUC 0.84).
SMwI masks were darker and smaller in patients than HC but became 1.8 times larger in patients after optimized thresholding for low SI. The latter showed decent PD classification performance (sensitivity 65.6%, specificity 78.7%, AUC 0.79).
Based on the above findings, we derived a composite quantitative NMS-QSM marker by combining the best performing measures (Figure 4) into a simple formula, composed of the product of the NMS SI_maxmin ratio, and SN mask sizes after thresholding for voxels with SI hyperintensity on NMS and low susceptibility on QSM. This yielded excellent AUC of 0.94 at optimum cut-offs of 85% sensitivity, 94% specificity and 90% accuracy (Figure 5), which compared reasonably against visual analysis.
SN mask size on QSM after thresholding for low susceptibility correlated with UPDRS-III score in patients (r = -0.262, p = 0.035).
Discussion
This is a large case-control PD cohort study with complete clinico-imaging data, assessing the value add of multimodal iron- and neuromelanin-sensitive midbrain sequences for radiological screening and diagnosis, their performance across radiological readers of varied expertise, and utility of the quantitative measures and their clinical correlates. Our expert readers excelled in visual analysis for PD classification using SMwI, and this was superior to NMS for both accuracy and inter-rater agreement. Reader expertise affected performance for visual analysis of both SMwI and NMS. Unique information from quantitative parameters extracted from manually segmented SN masks were harnessed in a composite quantitative NMS-QSM marker which matched expert visual analysis using SMwI.Conclusion
Iron- and NMS are complementary MR techniques providing high diagnostic accuracy that hold promise to aid PD diagnoses that are more objective, accurate, timely, and cost effective on a wide-scale in the clinic.Acknowledgements
This study is supported by National Medical Research Council, Singapore. We would also like to thank Professor Lee Jongho from Seoul National University who has kindly shared his SMwI toolbox for this study.References
1. Nam Y, Gho SM, Kim DH, et al. Imaging of nigrosome 1 in substantia nigra at 3T using multiecho susceptibility map-weighted imaging (SMWI). J Magn Reson Imaging. 2017;46(2):528-536.
2. Kim EY, Sung YH, Shin HG, et al. Diagnosis of Early-Stage Idiopathic Parkinson's Disease Using High-Resolution Quantitative Susceptibility Mapping Combined with Histogram Analysis in the Substantia Nigra at 3 T. J Clin Neurol. 2018;14:90-97.
3. Cho SJ, Bae YJ, Kim JM, et al. Diagnostic performance of neuromelanin-sensitive magnetic resonance imaging for patients with Parkinson's disease and factor analysis for its heterogeneity: a systematic review and meta-analysis. Eur Radiol. 2021;31:1268-1280.
Figures
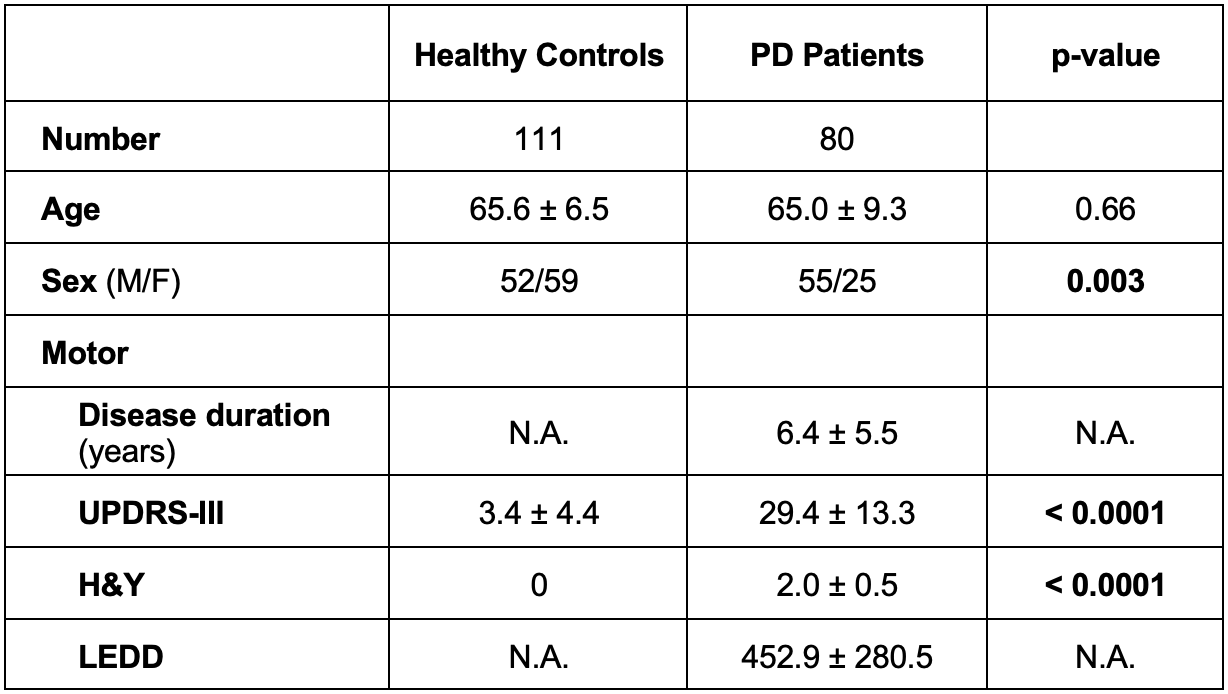
Figure 1. Clinical demographics of the study. Note: Statistical significance is defined at p < 0.05 (marked in bold). Abbreviations: F = Female, H&Y = Hoehn and Yahr staging, LEDD = Levodopa equivalent daily dose, M = Male, N.A. = Not applicable, PD = Parkinson’s Disease, UPDRS = United Parkinson Disease Rating.
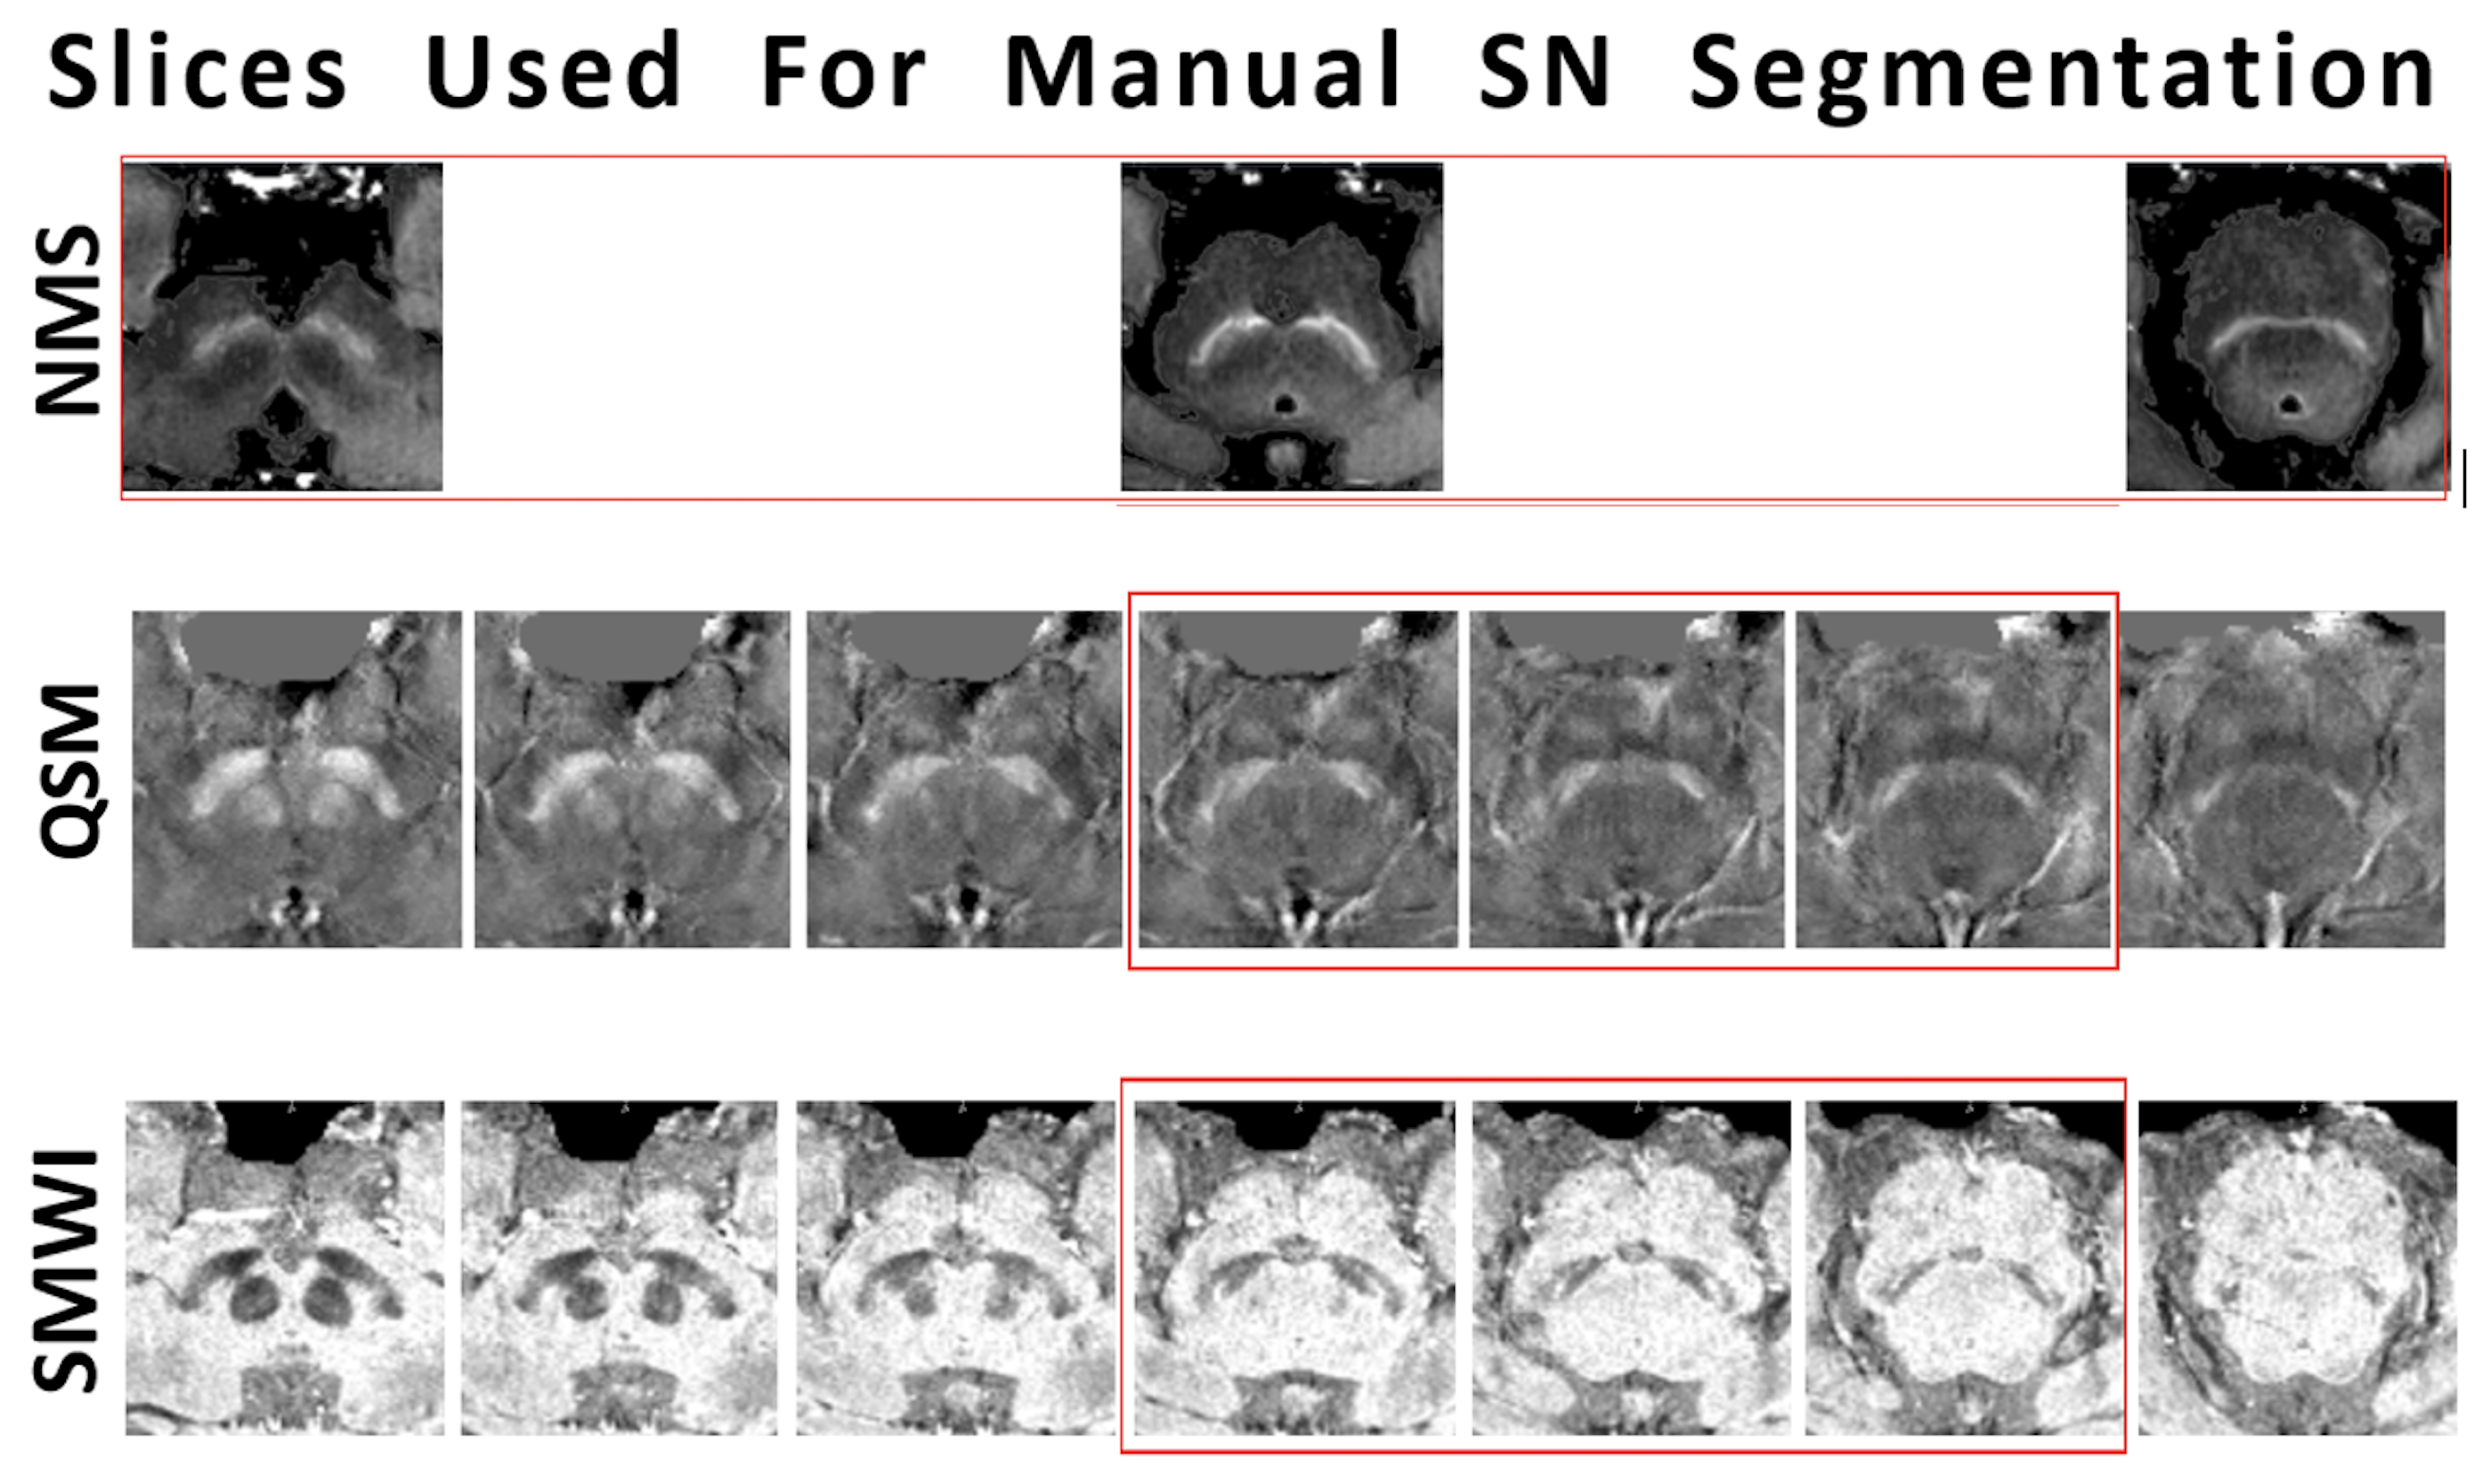
Figure 2. Relationship between NMS and reconstructed QSM and SMWI images used for manual segmentation of the hyperintense/hypointense SN.
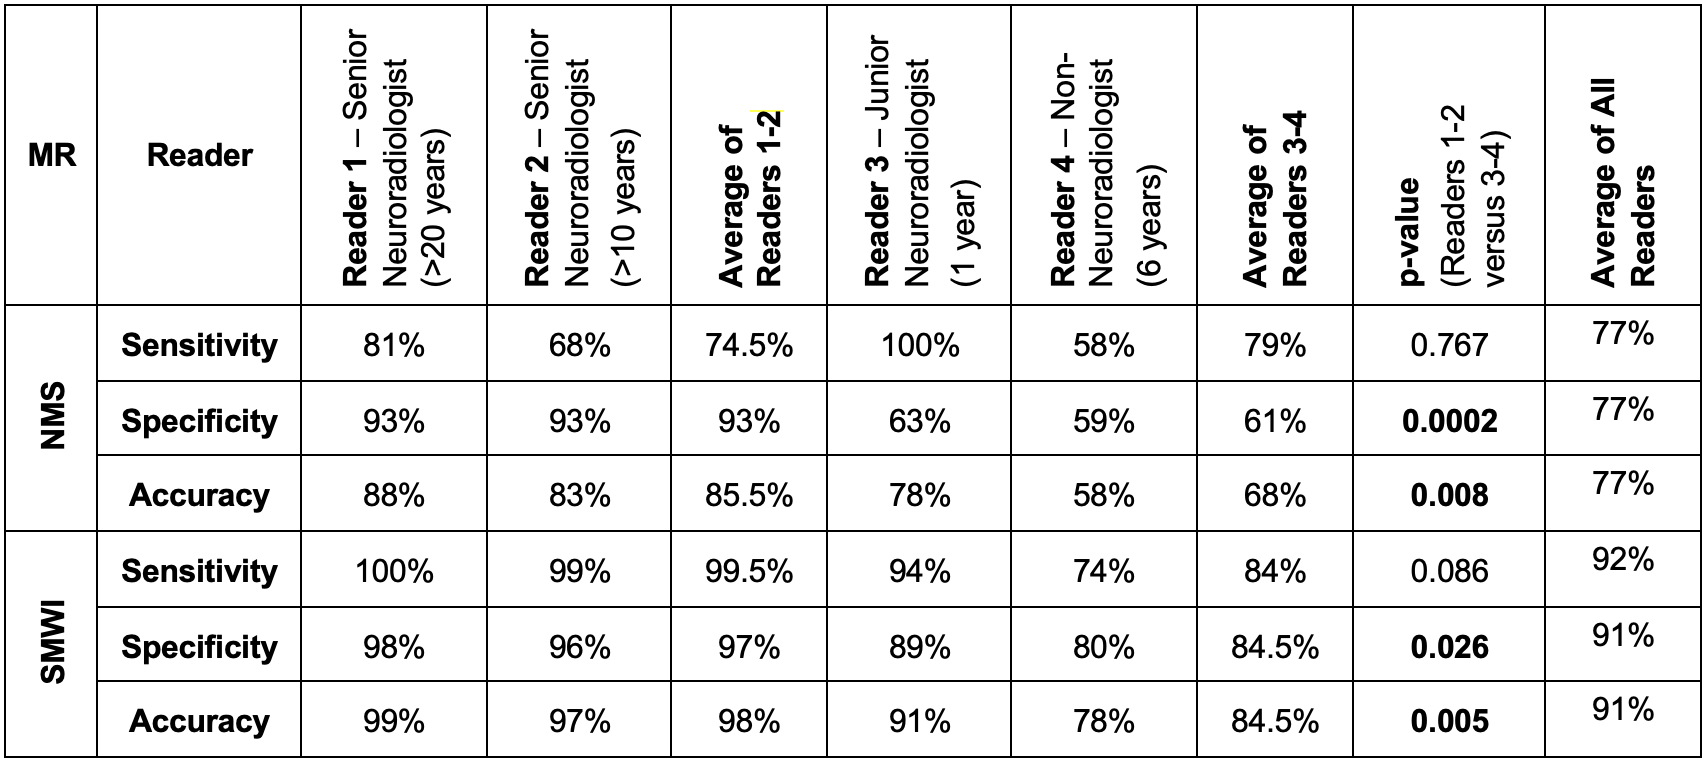
Figure 3. Classification performance of qualitative visual nigral assessment using NMS and SMWI by four radiologists. Note: Statistical significance is defined at p < 0.05 (marked in bold).
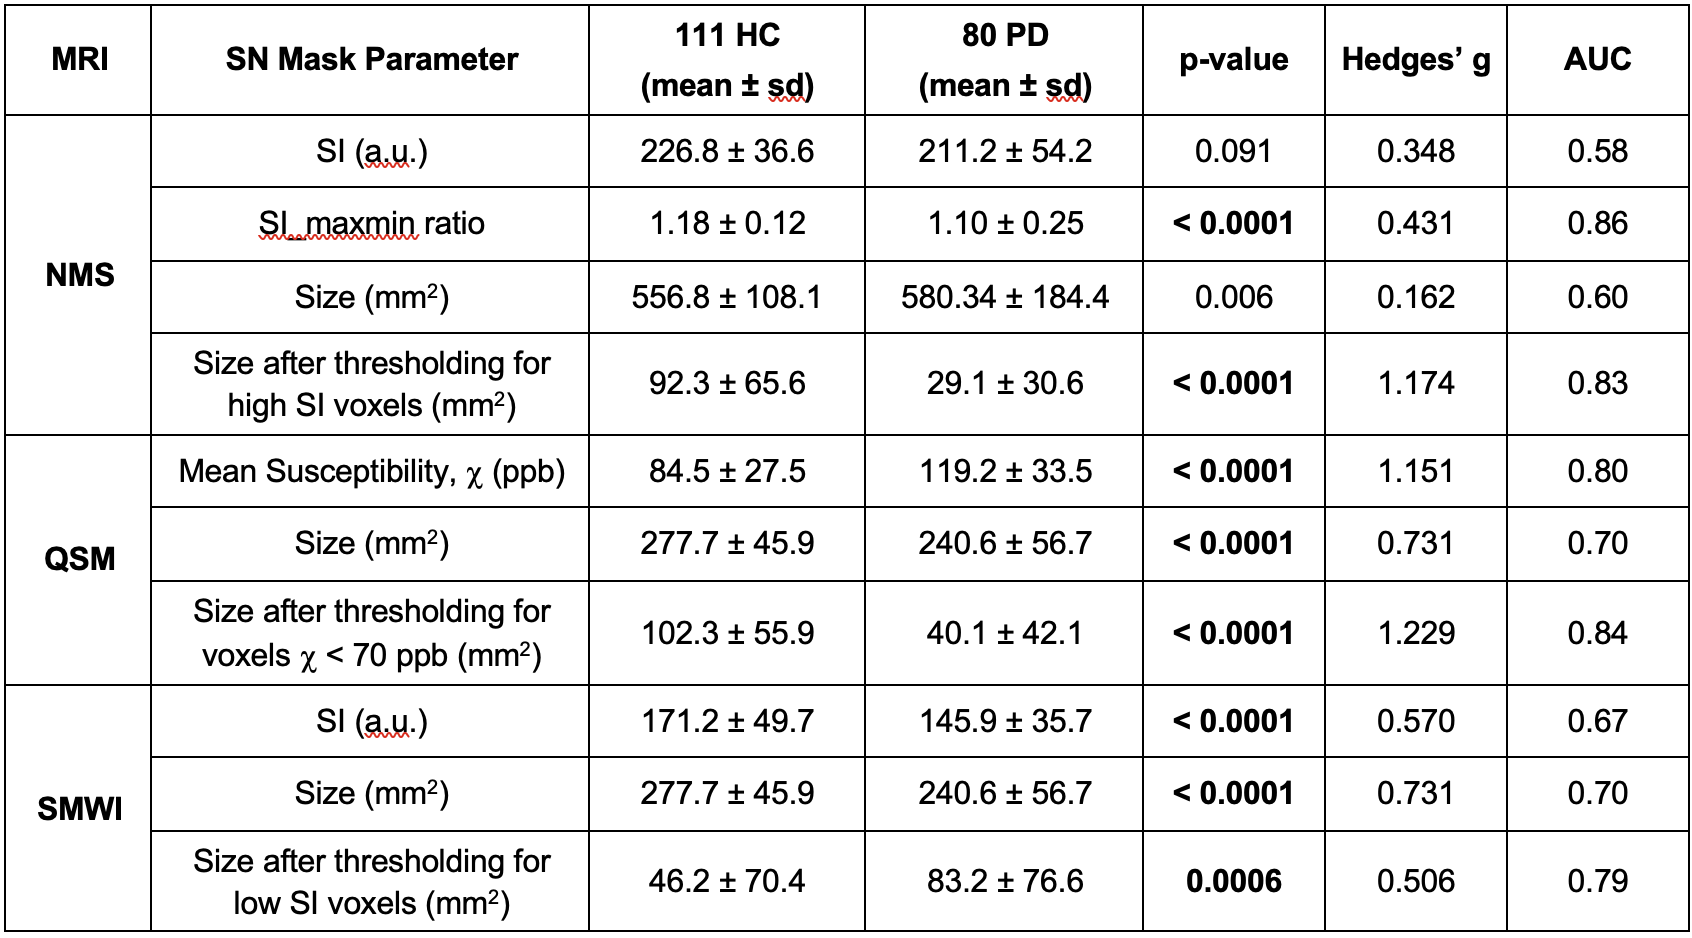
Figure 4. Group differences in quantitative NMS, QSM and SMWI. Note: Statistical significance is defined at p < 0.005 (marked in bold) after Bonferroni correction. Abbreviations: a.u. = arbitrary units, AUC = area under the ROC curve, SI = signal intensity, SI_maxmin = ratio of 90th to 10th percentile of SI.
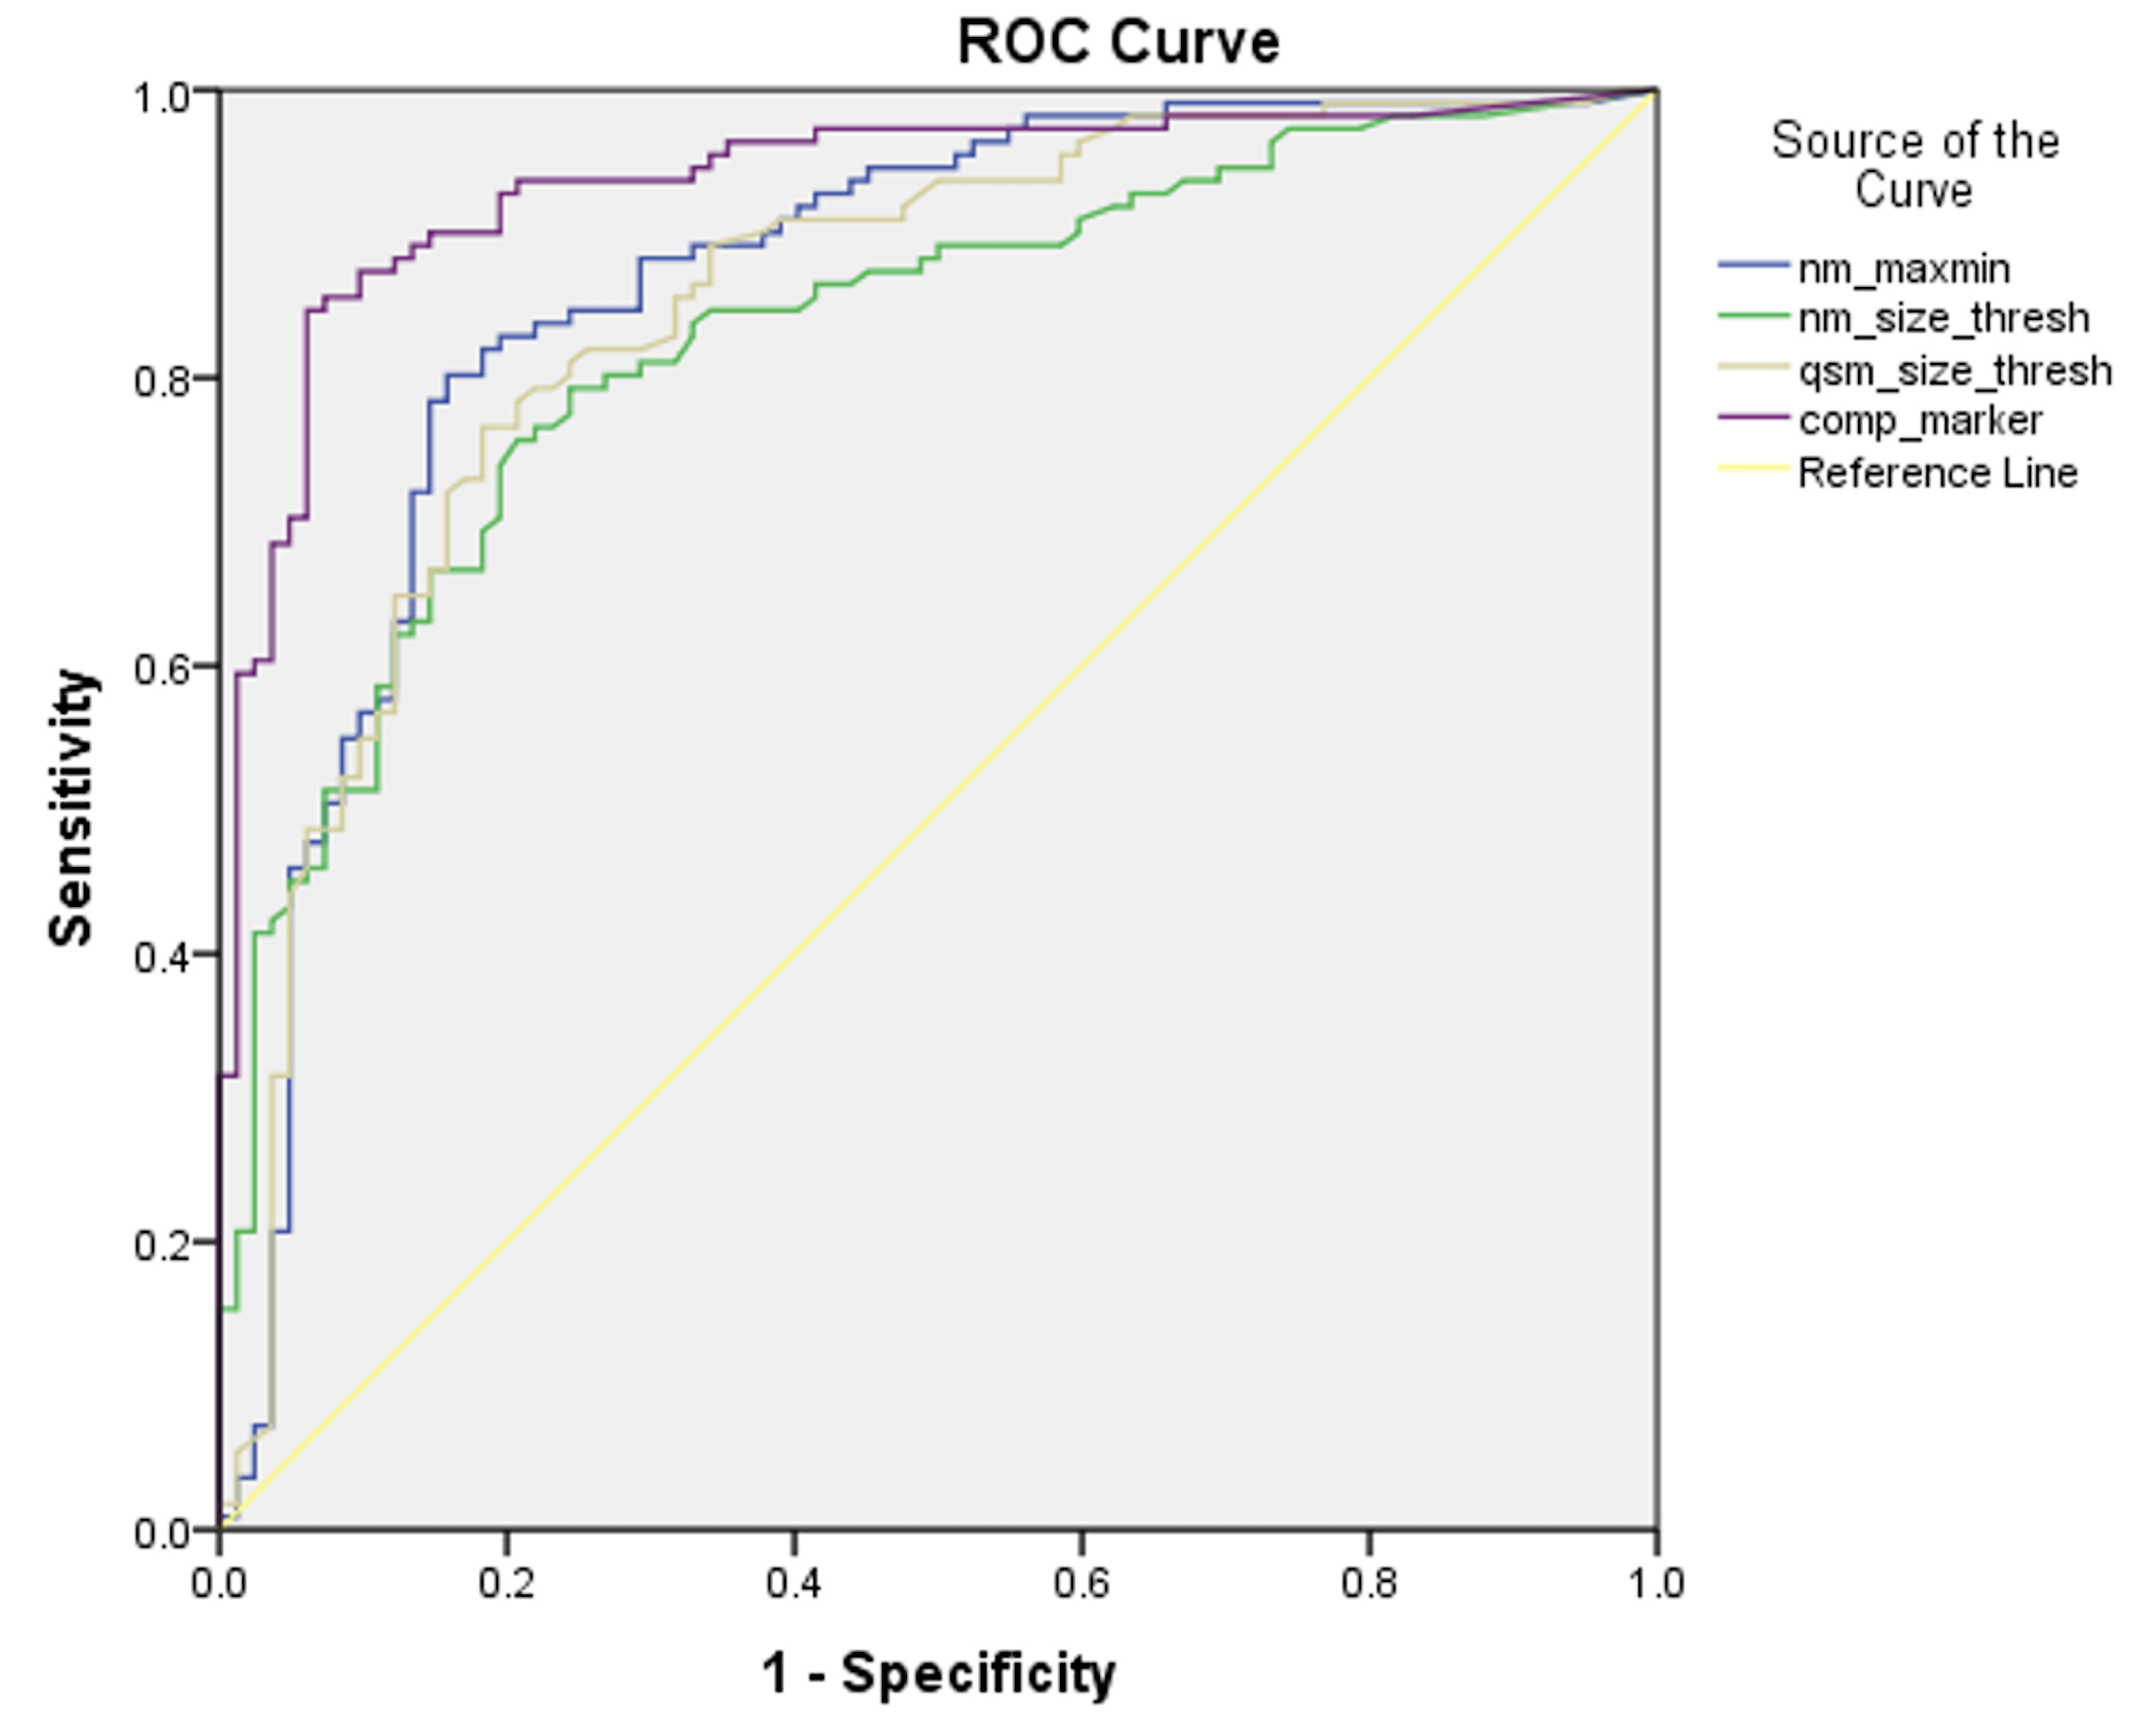
Figure 5. ROC curves of the best performing individual iron- and NMS parameters and the composite NMS-QSM marker (AUC = 0.94).
DOI: https://doi.org/10.58530/2023/3206