3205
Exploring the effects of tissue iron in neuromelanin MRI1Department of Electrical and Computer Engineering, Seoul National University, Seoul, Korea, Republic of, 2Department of Biomedical Engineering, Hankuk University of Foreign Studies, Gyeonggi-do, Korea, Republic of, 3Department of Radiology, Samsung Medical Center, Seoul, Korea, Republic of
Synopsis
Keywords: Parkinson's Disease, Parkinson's Disease
Neuromelanin MRI signal decreases in IPD patients in the substantia nigra. In this study, we investigated that the decrease is caused by not only the reduction of neuromelanin but also iron deposition. Neuromelanin reduction in IPD patients was shown by the result of the substantia nigra volume decrease. The comparison result of contrast ratio, calculated between substantia nigra and crus cerebri, of IPD patients versus healthy controls demonstrated that iron deposition also decreases the signal of NM-MRI. T2*, susceptibility, and overlapped area between substantia nigra from neuromelanin MRI and hypo-intense area from SMWI also represented the tendency of iron deposition.
Introduction
Idiopathic Parkinson’s disease (IPD) is a disorder of neurodegeneration leading to the loss of dopaminergic neurons including neuromelanin (NM)1. This finding is observed in NM-MRI in the form of a volume decrease and decay of signals in substantia nigra (SN)2. Iron is also accumulated in nigrosome 1 which is included in SN3, and which may contribute to the signal decay of NM-MRI using multi-echo GRE sequence.Therefore, in this study, we analyzed the effects of iron in signal changes of NM-MRI by comparing the contrast ratio of SN and crus cerebri (CC), T2* values, and susceptibility between IPD patients and healthy controls (HCs)4,5. Also, overlapped regions between SN from NM-MRI and hypo-intense area from SMWI were compared between two groups6. Results demonstrated that both NM decrease and iron deposition affect NM-MRI signal changes.
Methods
Data acquisition A total of 87 Multi-echo gradient echo image (GRE) data were acquired from HCs and IPD patients using sandwichNM7 (HCs:IPDs 39:48; IRB approved; Ingenia CX, Philips, Samsung Medical Center, Seoul, Korea). The ages of the two groups were aligned (HCs: 64.3 ± 7.4 years, IPD patients: 71.1 ± 6.8 years; p < 0.001) to mitigate NM reduction effect with age. The scan parameters were: voxel size = 0.76 × 0.76 × 1.20 mm3, TE=3.9:5.9:27.6 ms, and TR=60 ms.T2* and QSM mapping For T2* mapping and extrapolation to TE = 0 ms images (zero-echo images), a non-linear fitting based on an exponential decay model was performed on each voxel from the magnitude images of multi-echo GRE using MATLAB (Mathworks Inc., Natick, MA). Quantitative susceptibility mapping (QSM) maps were also reconstructed using iLSQR8.
For analysis, SN regions of interest (ROIs) and CC ROIs were masked on first- and last-echo as interest and reference region, respectively. Both masks were manually masked on the same single slice where the SN was most clearly observed. Deep learning (DL) -based neural network was also utilized to segment whole SN volumes from 10 subjects each of HCs and IPD patients who displayed a decrease in the nigral hyperintensity sign for supplementary experiments to alleviate the bias of hand-craft masks.
NM reduction effect was qualified by SN volumetric evaluation using both hand-craft and DL-based SN ROIs of HCs and IPD patients on zero-echo images, which may suffer the least from iron-induced effects due to T2* decay compensation. To investigate the iron deposition effect on NM-MRI images, the contrast ratio between SN and CC (CRSN-CC) was calculated both on zero- and first-echo images in HCs and IPD patients. ROI-averaged T2* and susceptibility values were also calculated in the hand-craft SN ROIs and compared between HCs and IPD patients.
SN ROIs from NM-MRI were overlapped in susceptibility map-weighted imaging (SMWI) images to investigate the overlap of SN with the hypo-intense area in SMWI.
Results
Zero- and first-echo images, QSM map, and T2* map with SN and CC ROIs are displayed for one HC and one IPD patient in Fig. 2. The volume of SN ($$$SN_{volume}$$$) is significantly reduced in IPD patients compared to HCs for zero-echo images with hand-craft SN ROIs, first-echo images with hand-craft SN ROIs, and first-echo images with DL-based SN ROIs, but no significant difference was found between HCs and IPD patients in case of the volume of SN of zero-echo images using DL-based SN ROIs (Fig. 3).For the first-echo images, CRSN-CC had a significant reduction in IPD patients, while no significant difference was found in zero-echo images (Fig. 4 (a), (b)). T2* values decreased and susceptibility values increased in IPD patients compared to HCs (Fig. 4 (c), (d)).
In the case of IPD patients, SN masks from NM-MRI display a larger overlap to the hypo-intense area in SMWI than HCs (Fig. 5).
Discussion and Conclusions
In this study, we explored the sources of NM-MRI signal changes in IPD patients. The decrease of SN volume in zero- and first-echo images showed the effect of NM reduction and the effect of NM reduction with the iron deposition, respectively. CRSN-CC of IPD patients was smaller than that of HCs in the first-echo images, whereas there was no significant difference in the zero-echo images between the two groups, potentially demonstrating the iron effect. A decrease of T2* and an increase of susceptibility on NM-MRI revealed that iron is accumulated in IPD patients compared to HCs in SN. Also, the larger overlap between SN masks from NM-MRI and SMWI hypo-intense areas in the case of IPD patients reinforced iron deposition. In conclusion, NM-MRI signal change in IPD patients results from both NM decrease and iron deposition.Acknowledgements
This work was supported by Heuron. Co. Ltd. and
This work was supported by the National Research Foundation of Korea(NRF) grant funded by the Korea government(MSIT) (NRF-2022R1F1A1073551).
References
1. Isaias, I. U., Trujillo, P., Summers, P., Marotta, G., Mainardi, L., Pezzoli, G., ... & Costa, A. (2016). Neuromelanin imaging and dopaminergic loss in Parkinson's disease. Frontiers in aging neuroscience, 8, 196.
2. Pavese, N., & Tai, Y. F. (2018). Nigrosome imaging and neuromelanin sensitive MRI in diagnostic evaluation of parkinsonism. Movement disorders clinical practice, 5(2), 131-140.
3. Friedrich, I., Reimann, K., Jankuhn, S., Kirilina, E., Stieler, J., Sonntag, M., ... & Morawski, M. (2021). Cell specific quantitative iron mapping on brain slices by immuno-µPIXE in healthy elderly and Parkinson’s disease. Acta Neuropathologica Communications, 9(1), 1-17.
4. Lehéricy, S., Sharman, M. A., Santos, C. L. D., Paquin, R., & Gallea, C. (2012). Magnetic resonance imaging of the substantia nigra in Parkinson's disease. Movement disorders, 27(7), 822-830.
5. Langkammer, C., Schweser, F., Krebs, N., Deistung, A., Goessler, W., Scheurer, E., ... & Reichenbach, J. R. (2012). Quantitative susceptibility mapping (QSM) as a means to measure brain iron? A post mortem validation study. Neuroimage, 62(3), 1593-1599.
6. Langley, J., He, N., Huddleston, D. E., Chen, S., Yan, F., Crosson, B., ... & Hu, X. (2019). Reproducible detection of nigral iron deposition in 2 Parkinson's disease cohorts. Movement Disorders, 34(3), 416-419.
7. Ji, S., Choi, E. J., Sohn, B., Baik, K., Shin, N. Y., Moon, W. J., ... & Lee, J. (2022). Sandwich spatial saturation for neuromelanin-sensitive MRI: development and multi-center trial. NeuroImage, 119706.
8. Li, W., Wang, N., Yu, F., Han, H., Cao, W., Romero, R., ... & Liu, C. (2015). A method for estimating and removing streaking artifacts in quantitative susceptibility mapping. Neuroimage, 108, 111-122.
Figures
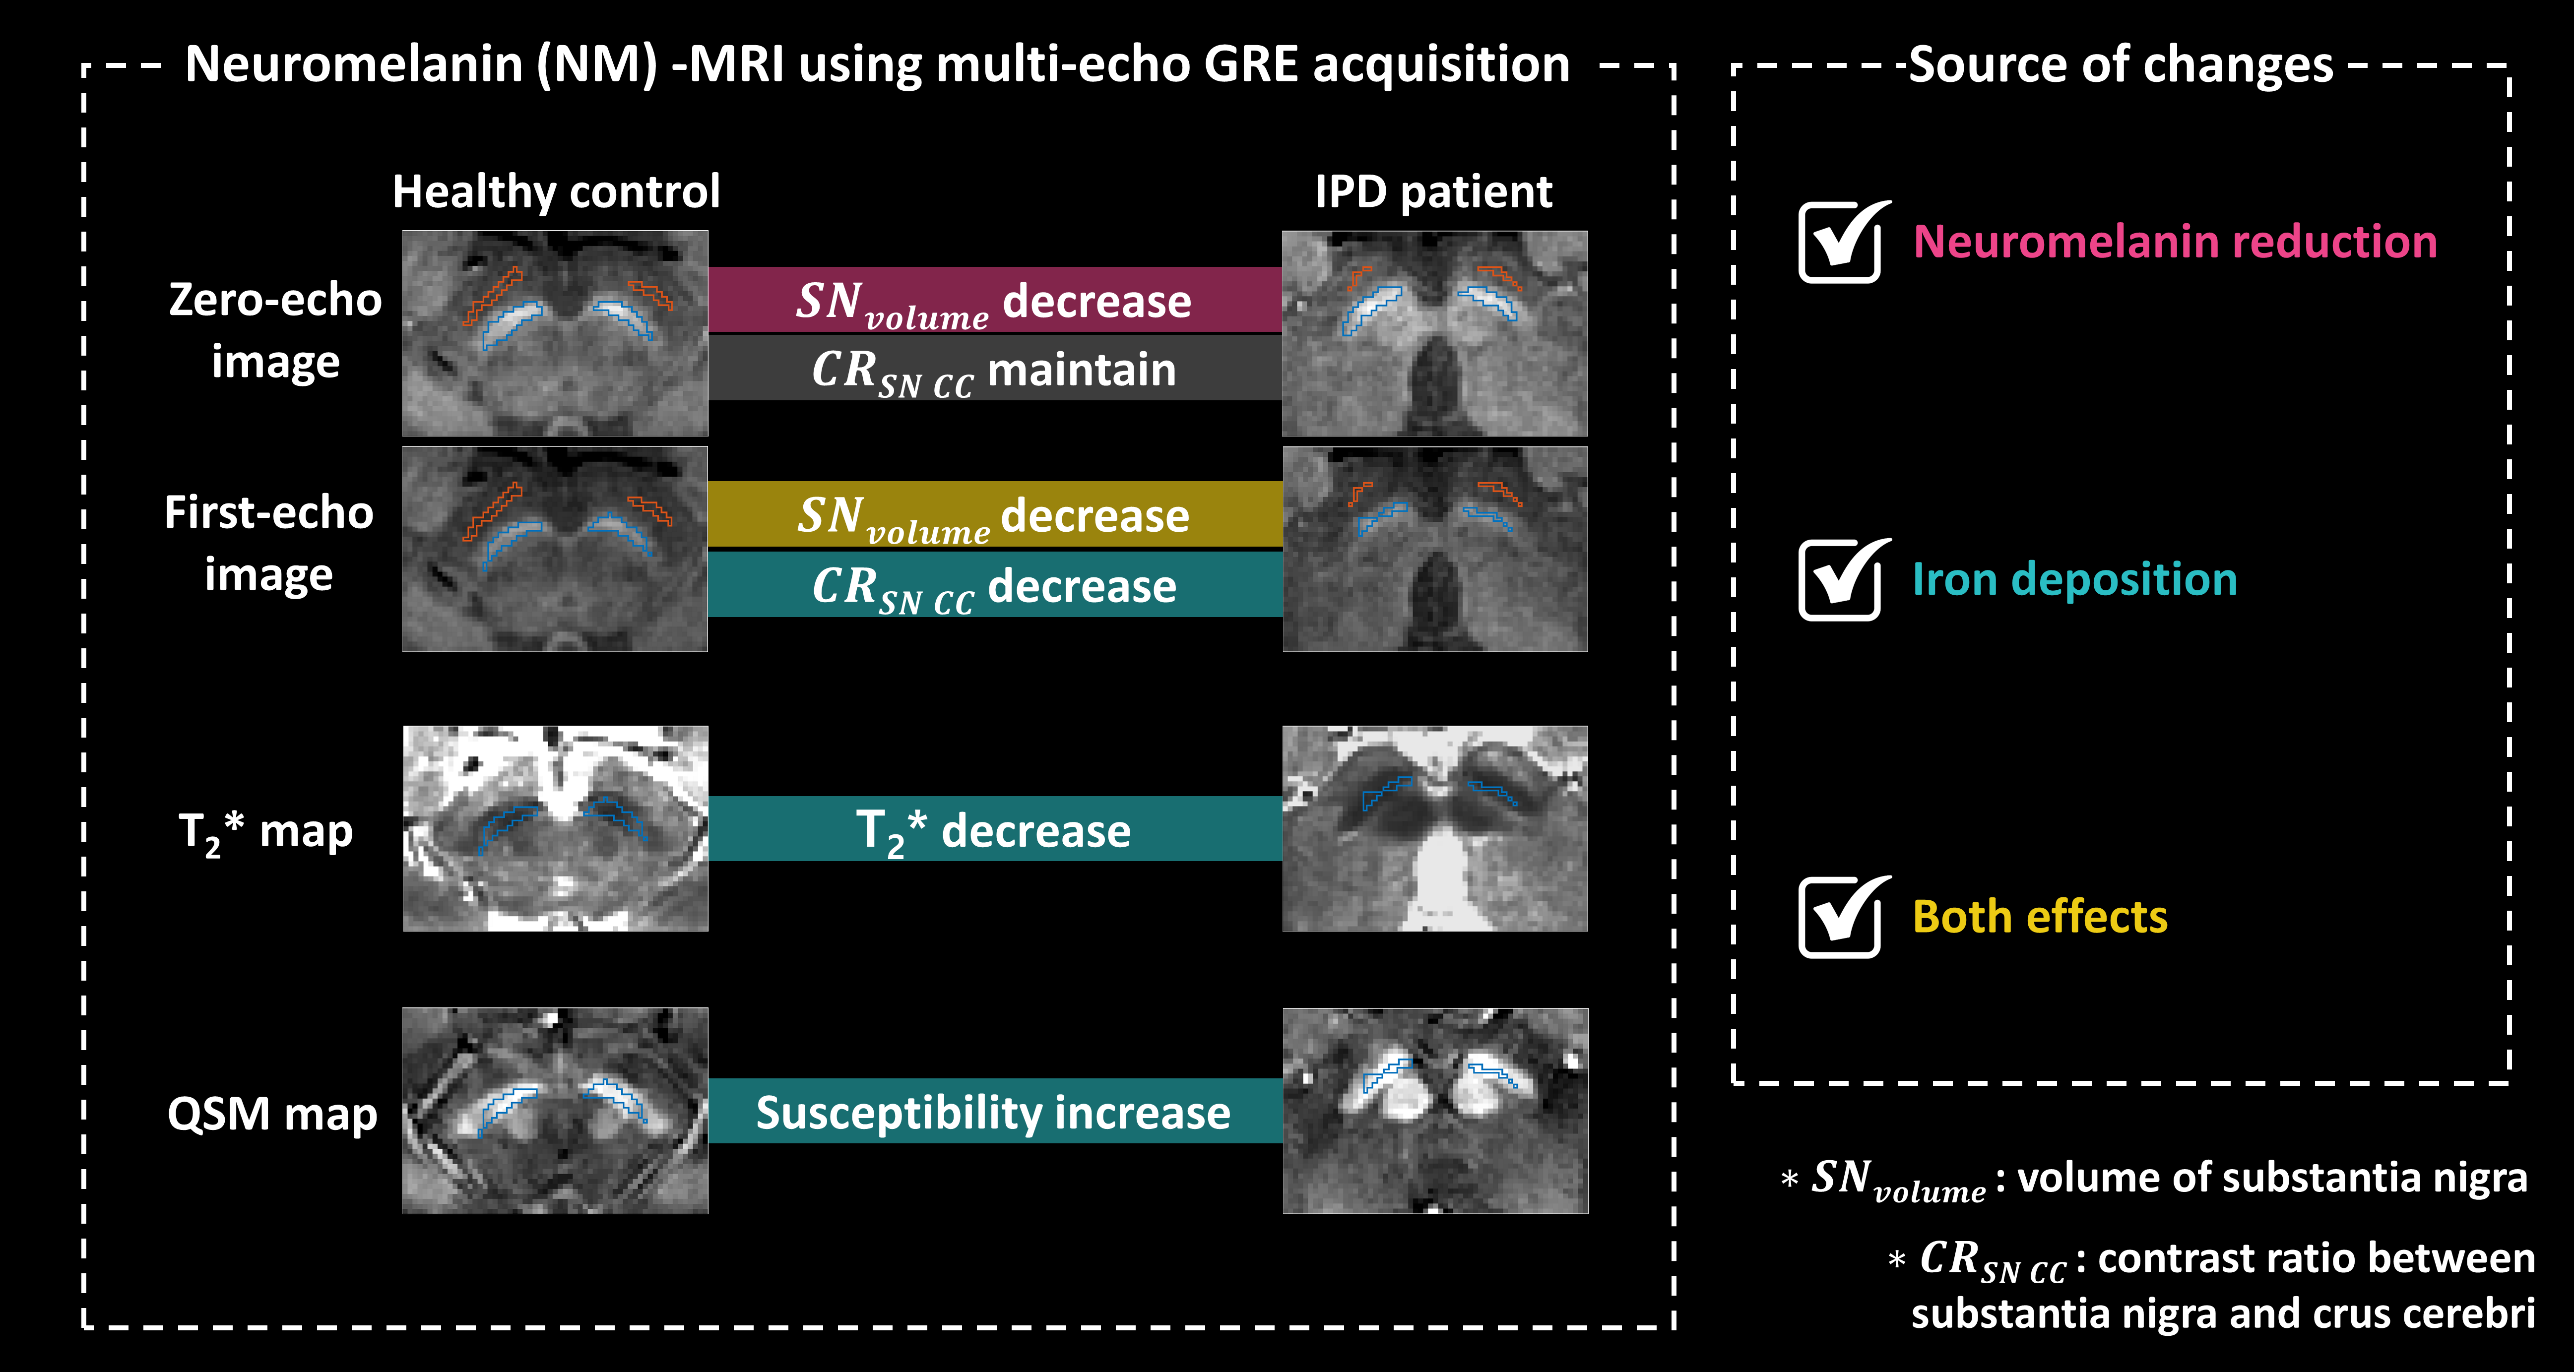
Fig. 1 Overview of the proposed study to analyze the iron deposition effect of intensity decrease on neuromelanin MRI using multi-echo GRE acquisition for the case of idiopathic Parkinson's disease (IPD) patients compared to healthy controls (HC). We compare the volume of the substantia nigra (SN) in zero- and first-echo images to investigate the neuromelanin reduction effect. Contrast ratio (CR) between SN and crus cerebri (CC), and quantitative measurements in SN regions from T2* and QSM are utilized to explore the iron deposition effect.
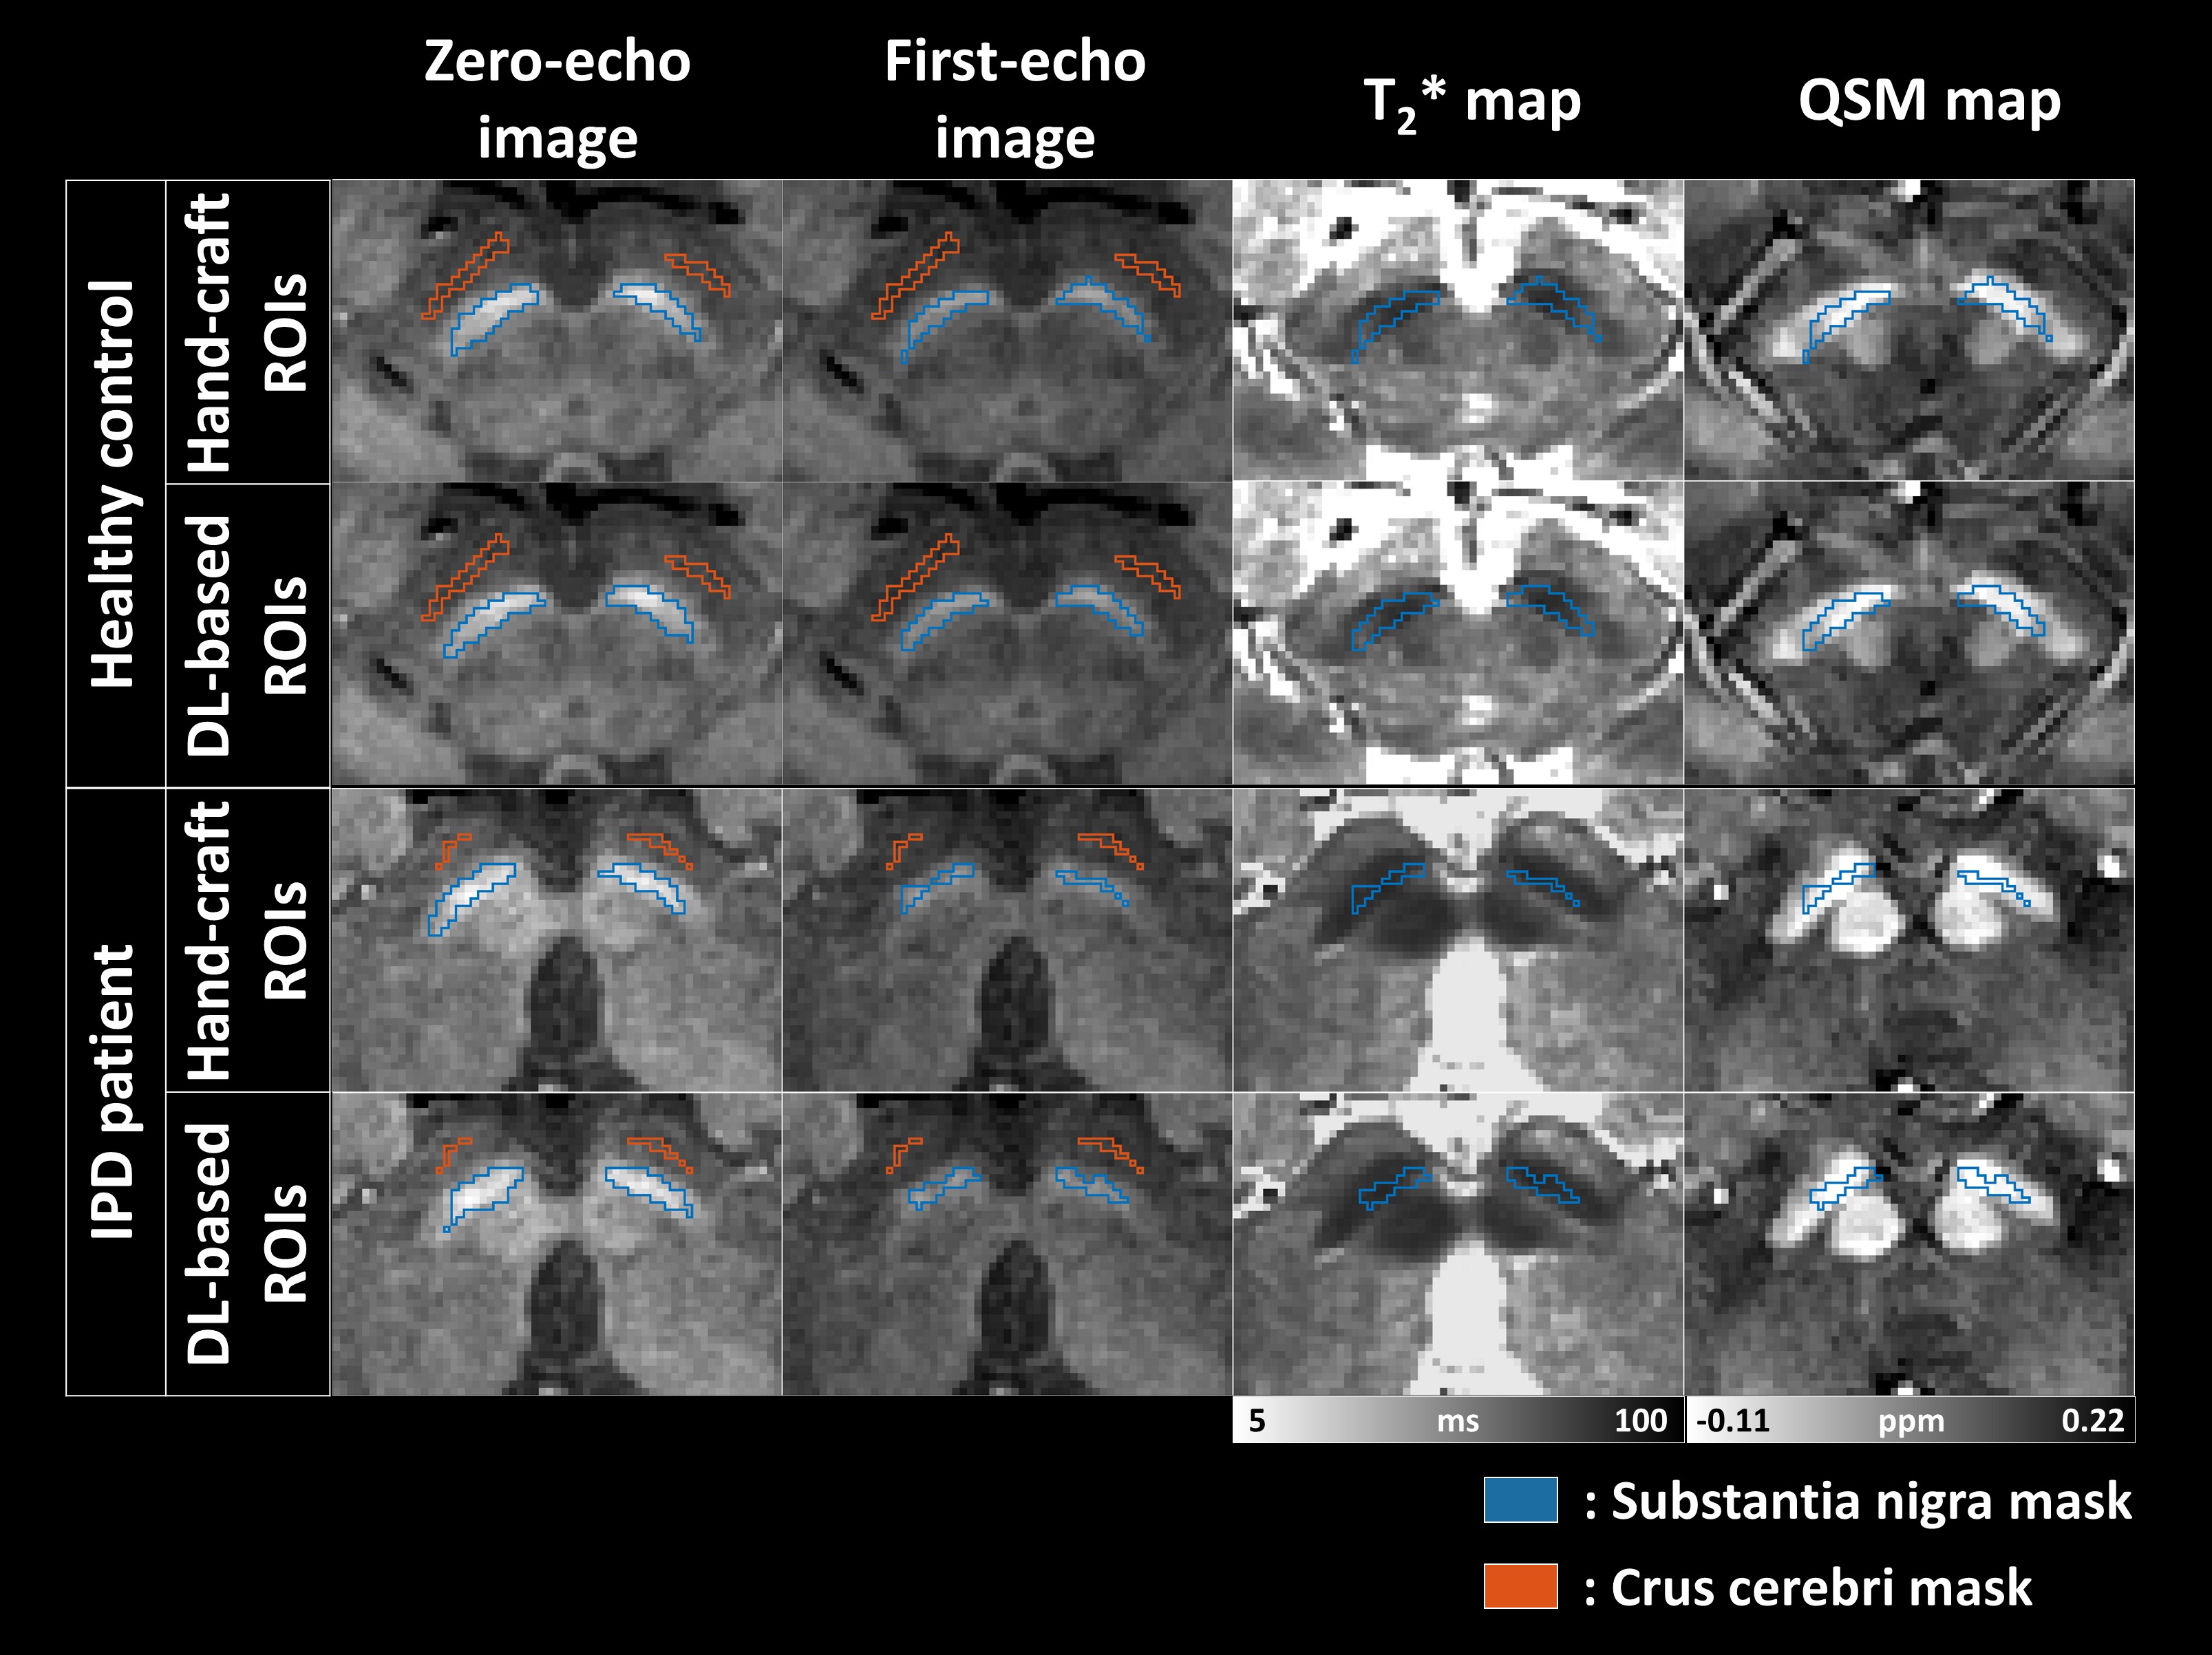
Fig.2 Four images (zero- and first-echo image, T2* map, and QSM map) of healthy control (HC) and idiopathic Parkinson’s disease (IPD) patient are displayed. Substantia nigra (SN) is segmented in zero- and first-echo images to measure the volume of SN. Crus cerebri (CC) is also segmented as reference regions. Both SN and CC are manually masked by hand. To mitigate hand bias of hand-craft regions of interest (ROIs), deep learning (DL) -based network is also utilized to extract ROIs of SN and CC.
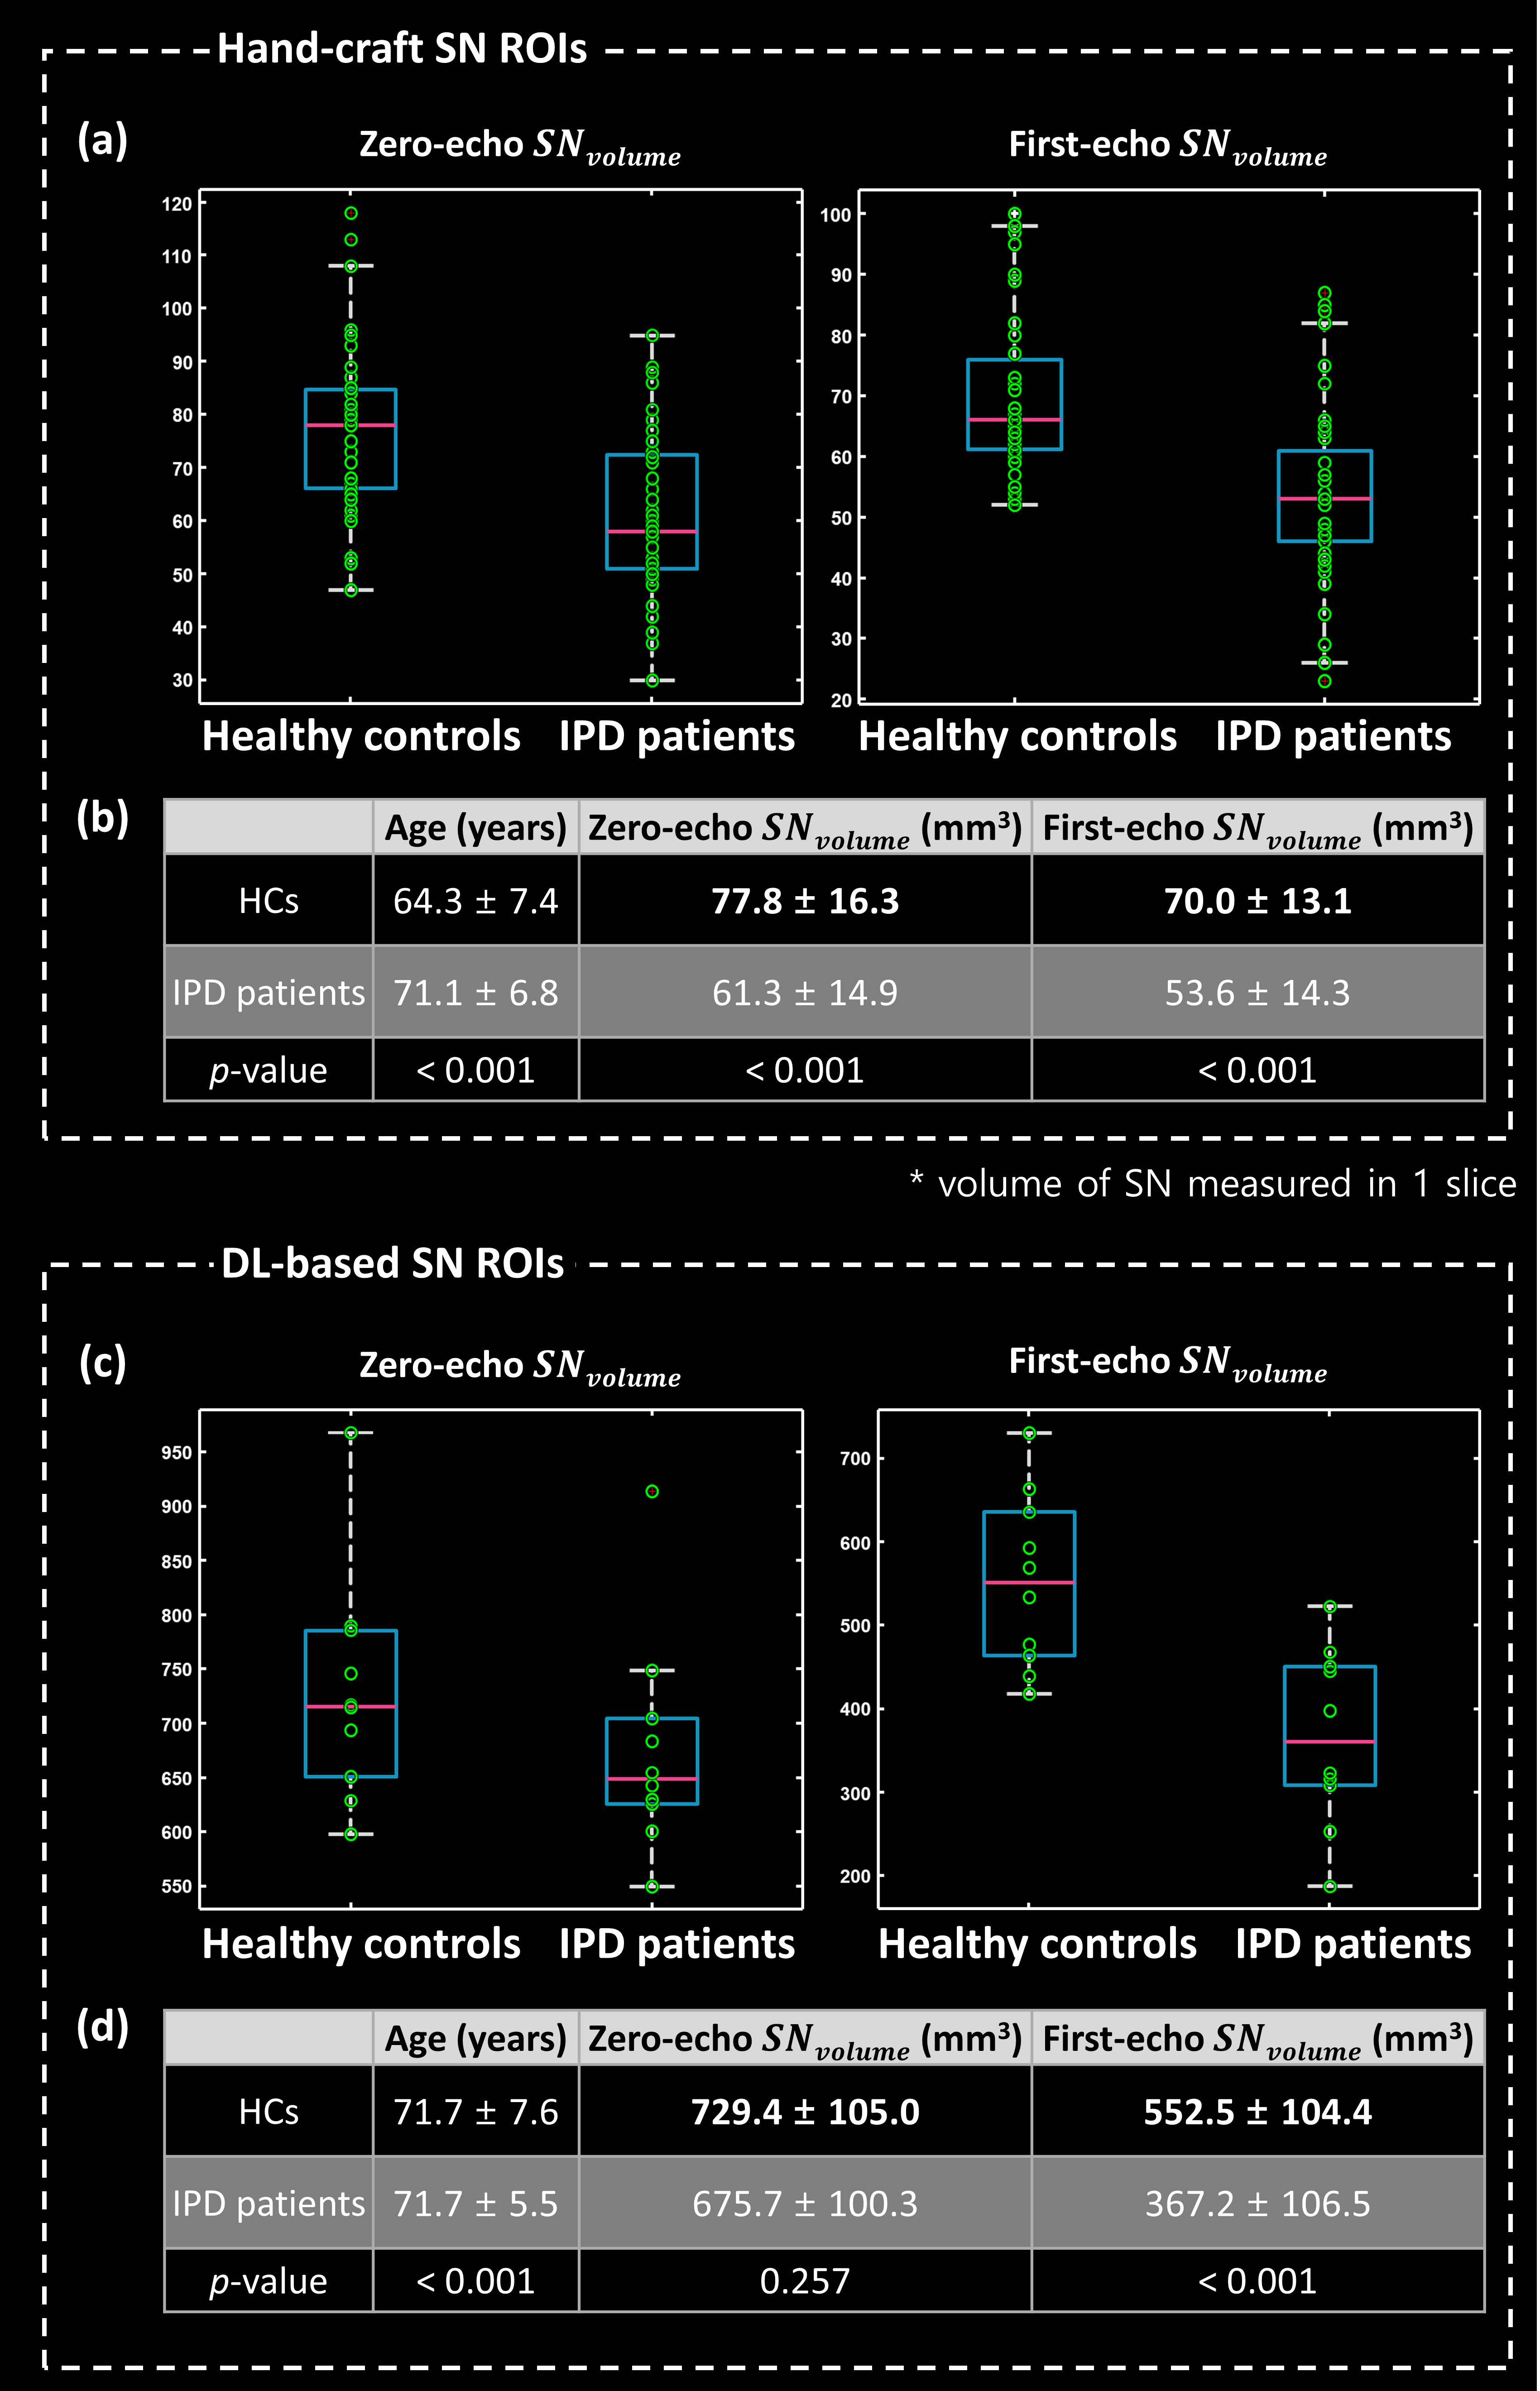
Fig. 3 Volume of SN is compared between HC and IPD patients on zero- and first-echo images. Two kinds of regions of interest (ROIs), which are segmented by hand-craft and deep learning (DL) -based method are utilized. Hand-craft ROIs are masked on every subject and DL-based ROIs are only segmented on the subset of IPD patients who display a decrease in the nigral hyperintensity sign. SN volume is markedly reduced in the IPD patients compared to HCs in all of the cases except for zero-echo images using DL-based SN ROIs.
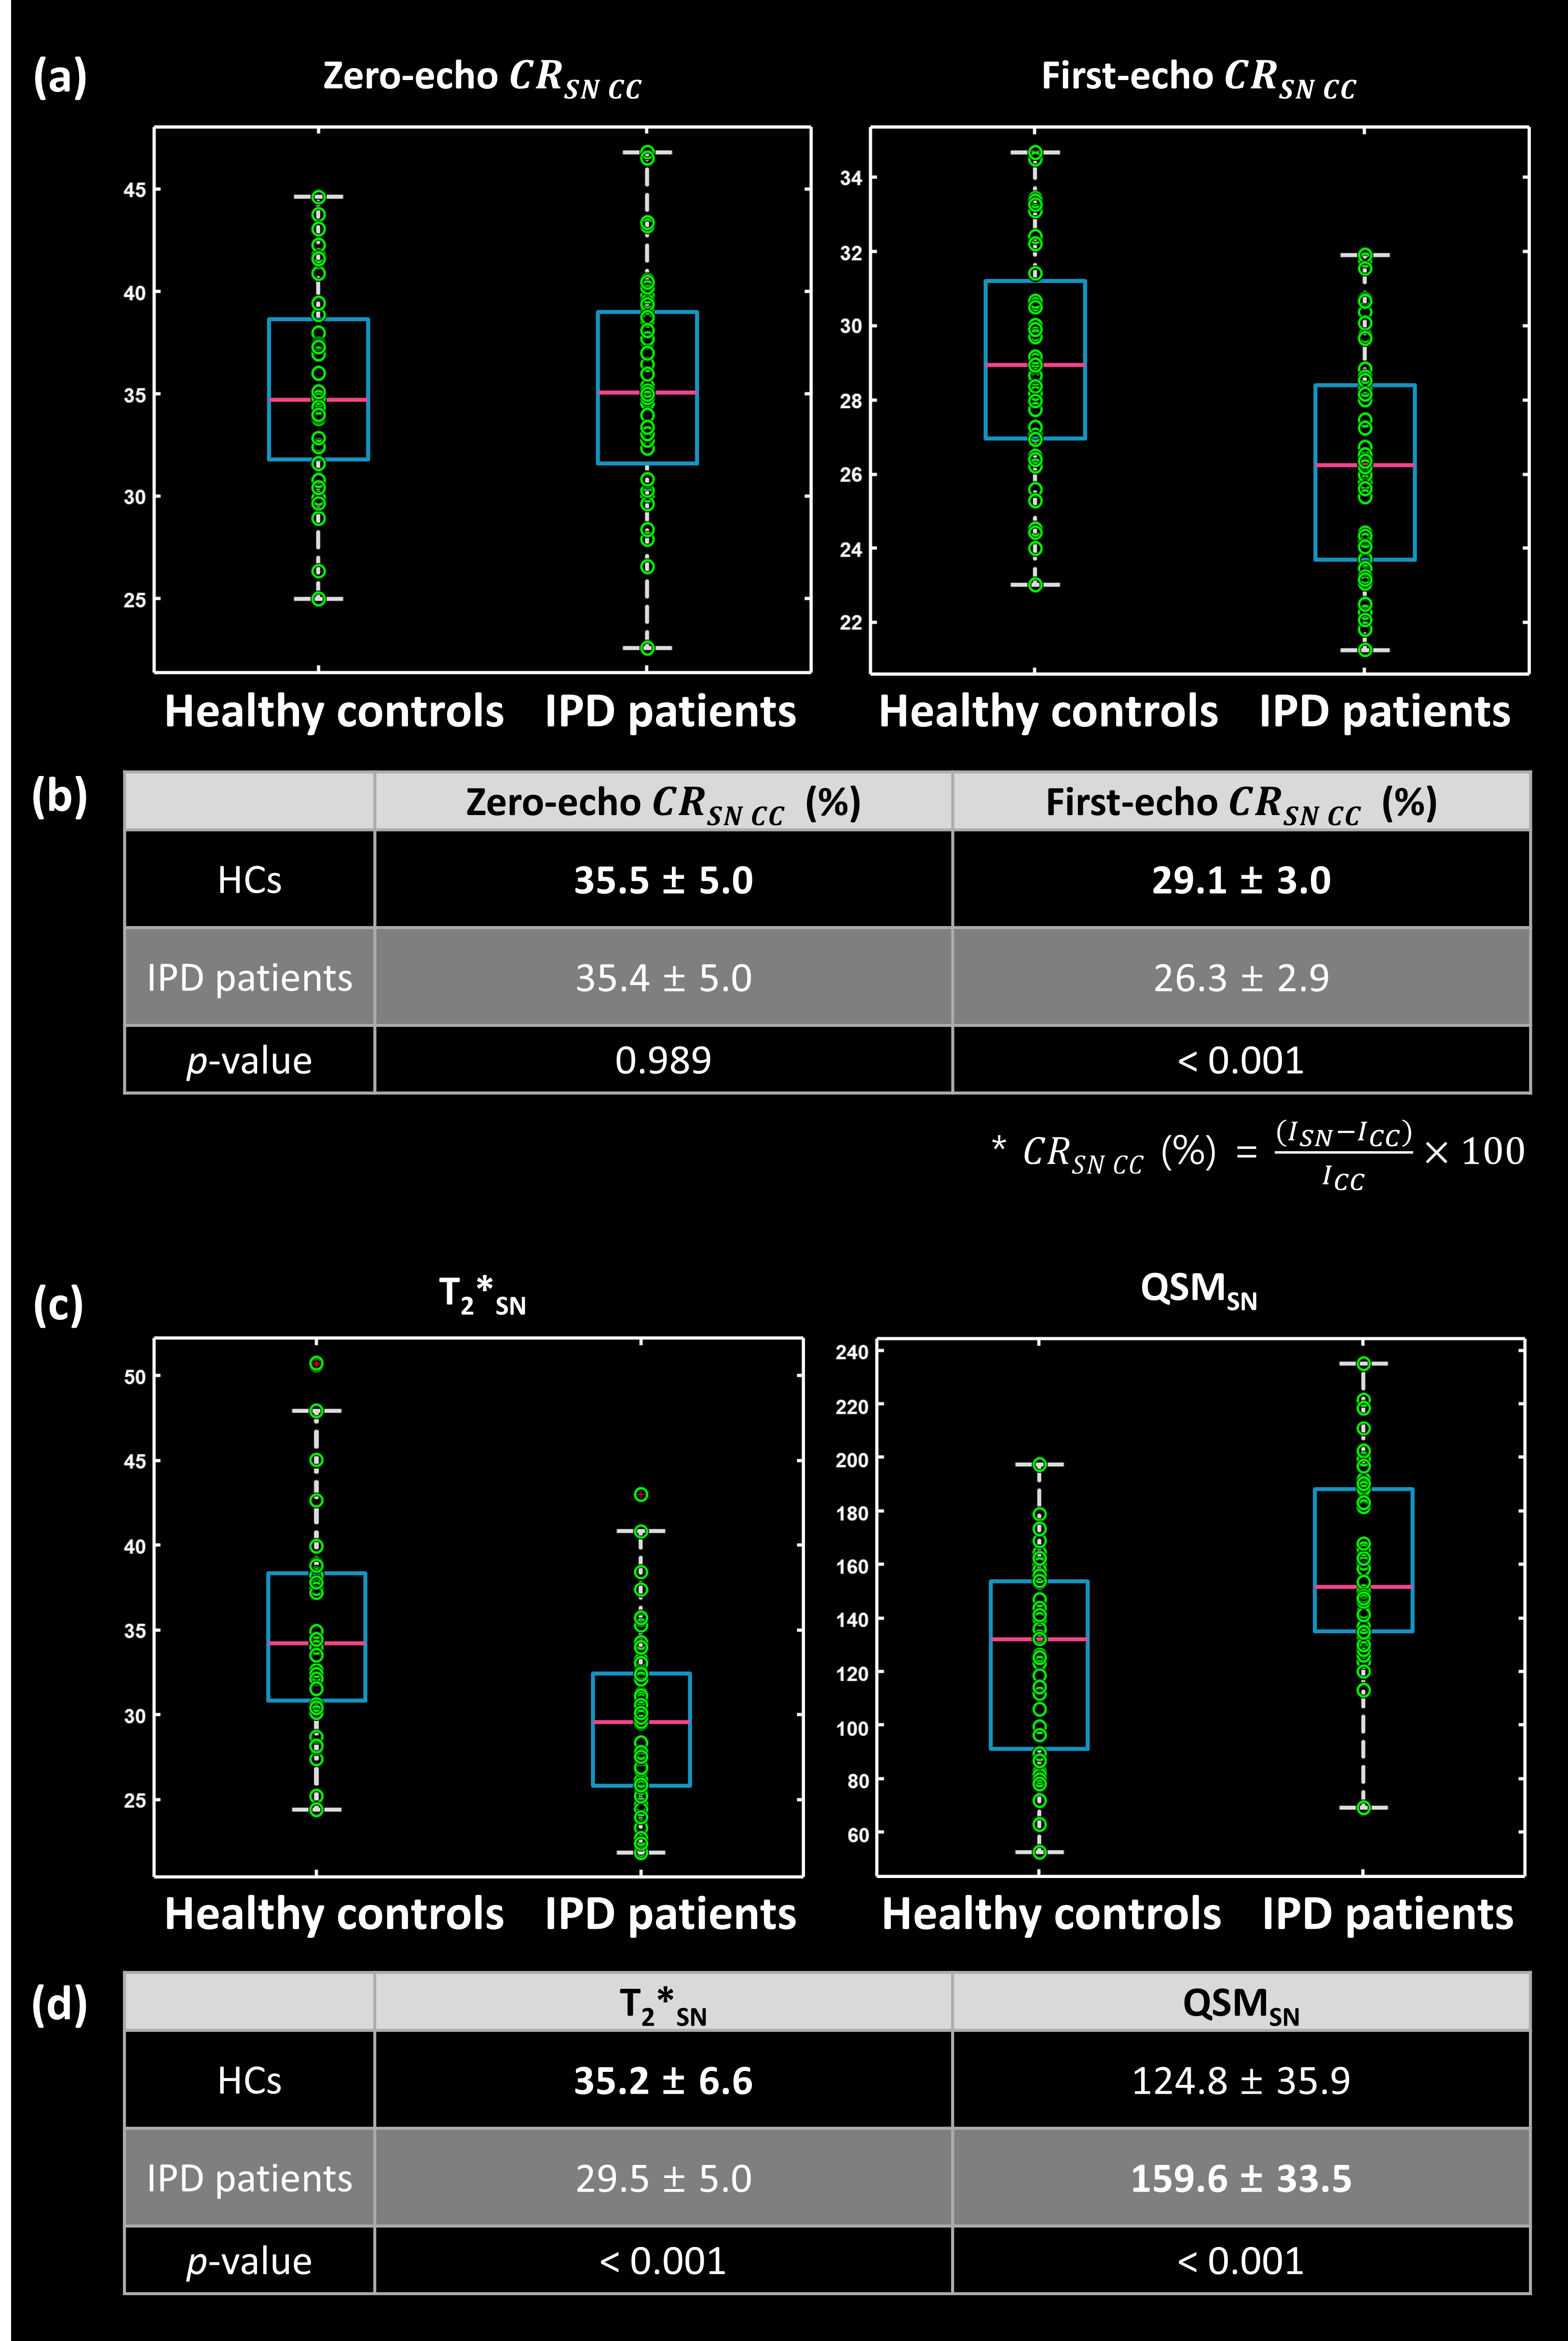
Fig. 4 (a) Contrast ratio between SN and CC (CRSN-CC) are compared in zero- and first-echo images between HC and IPD patients. (b) For first-echo images, CRSN-CC has a significant reduction in IPD patients compared to HCs, while in zero-echo images, the CRSN-CC has no significant differences. (c, d) Quantitative measurements in SN ROIs from T2* map and quantitative susceptibility mapping (QSM) map are also compared to investigate iron deposition effects. A decrease of T2* and an increase of susceptibility in IPD patients versus HCs show iron accumulation in SN regions.
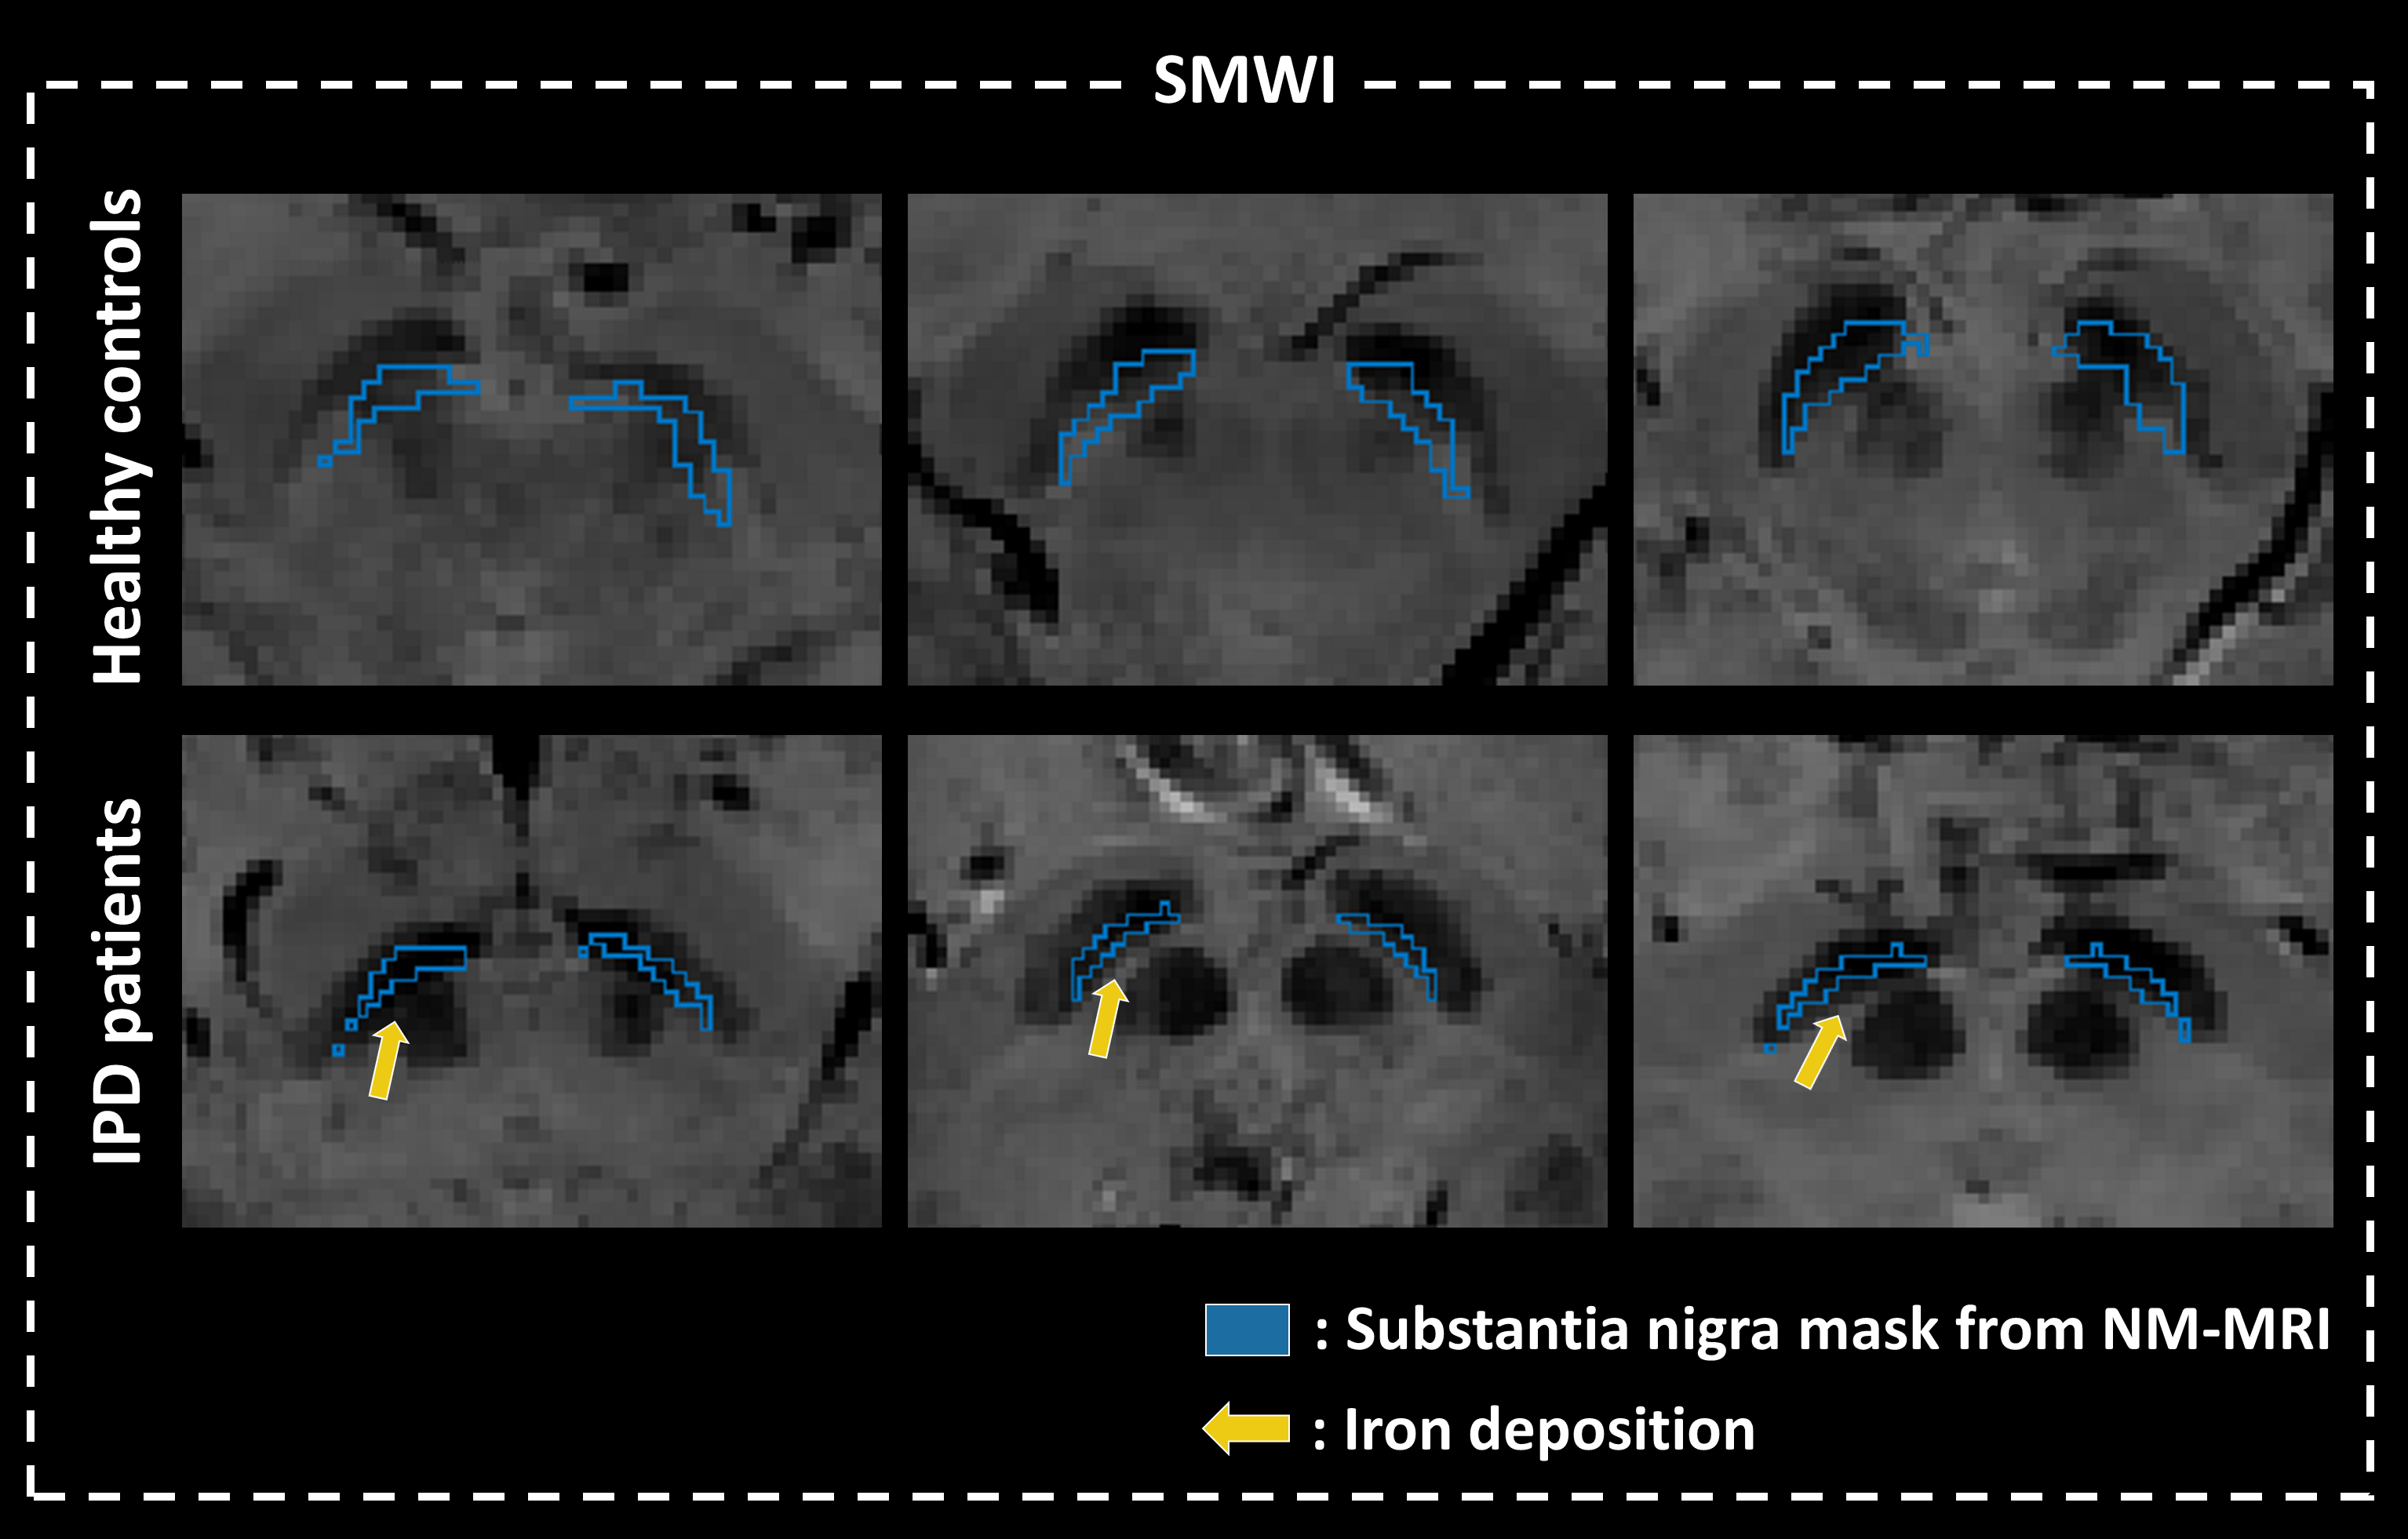
Fig.5 Susceptibility map-weighted imaging (SMWI) images of six different subjects are displayed with overlapping of substantia nigra (SN) masks (blue regions of interest) which are segmented in neuromelanin (NM) MRI. In the case of IPD patients, SN masks from NM-MRI display a larger overlap to the hypo-intense area in SMWI than HCs, indicating iron deposition on the point of yellow arrows.