3204
Reproducibility of Iron and Neuromelanin Changes of Deep Grey Matter in 2 Large Movement Disorder Cohorts1Ruijin Hospital, Shanghai Jiao Tong University, Shanghai, China, 2SpinTech MRI, Bingham Farms, MI, USA 48025, Bingham Farms, MI, United States, 3Philips Healthcare, Shanghai, China, 4Ruijin Hospital, Shanghai Jiao Tong University School of Medicine, Shanghai, China
Synopsis
Keywords: Parkinson's Disease, Neurodegeneration
Diagnosing movement disorders (MDS) is a major challenge clinically. Neuromelanin and iron serve as biomarkers for MDS but few studies have evaluated a large number of cases for multiple disorders. We studied 614 patients consisting of two cohorts with different resolutions. The QSM and NM-MRI data were automatically processed using a unique template program. The results from both cohorts showed reproducible changes of iron and neuromelanin in the deep gray matter. Specifically, a loss of neuromelanin volume, an increase in iron content of the SN for both PD and MSA; increased RN iron and decreased putamen volume in MSA.Introduction
Currently the clinical diagnosis of Parkinson’s disease (PD), especially in the early stages, can still be challenging given that PD clinical symptoms are very heterogeneous and often overlap with other movement disorders (MDS), including multiple system atrophy (MSA) and essential tremor (ET). Therefore, development of valid, non-invasive biomarkers for these diseases is critical. With recent neuroimaging advances, more and more evidence show that deep gray matter (DGM) structures are commonly involved in these MDS patients1. Several MDS studies have shown that iron content in the DGM and/or neuromelanin (NM) content in the substantia nigra (SN) as measured with T2*WI/quantitative susceptibility mapping (QSM) and NM-MRI are potentially promising as disease-state, progression and disease-differentiating biomarkers in PD2. However, the number of cases is often small or usually with only a single modality3 (either iron or NM), or only one single type of disease cohort being investigated. Furthermore, those studies provided mixed results.In this work, 2 large MDS cohorts with both iron and NM data were analyzed. In particular, we extracted NM measures from the SN and iron measures from the SN, red nucleus (RN), putamen (PUT), globus pallidus (GP), thalamus (THA) and dentate nucleus (DN) that are known to be affected in these movement disorders. We then conducted a series of comparison analyses on these data to evaluate the differences between different MDS groups and the healthy control (HC) group.
Methods
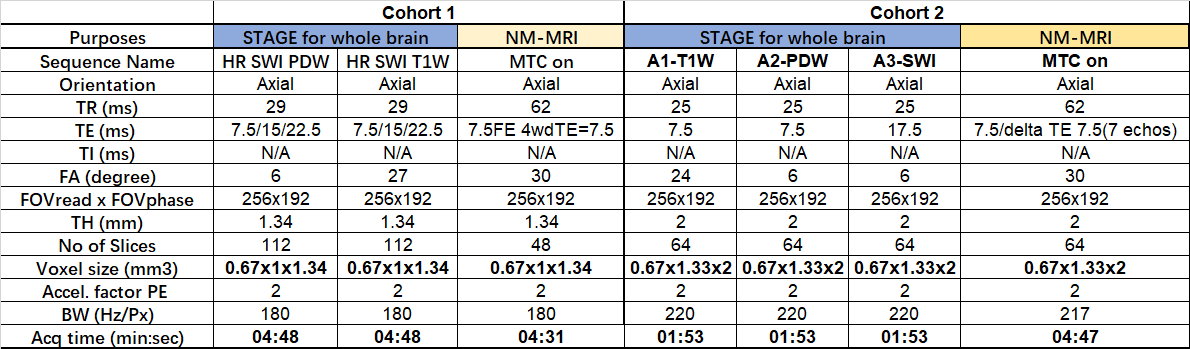
This study was approved by the local ethics committee. Two large cohorts of patients with MDS (PD, MSA, ET) and controls were recruited. All subjects were scanned on a 3T scanner (Ingenia, Philips Healthcare) using a 15-channel head array coil. Cohort 1 consisted of 567 individuals (348 PD patients, 56 ET patients, 21 MSA patients, 142 controls), and Cohort 2 consisted of 369 individuals (115 PD patients, 52 ET patients, 22 MSA patients, 180 controls). The scanning protocol included: STrategically Acquired Gradient Echo (STAGE) and a 3D gradient echo sequence with an activated magnetization transfer contrast (MTC) pulse (3D MTC-GRE). The specific parameters for each protocol are given in Table 1. The first Cohort represented the relatively high-resolution data and the second cohort represented the relatively low-resolution data.The first echo of the MTC-GRE magnitude image (TE = 7.5 ms) was used to delineate NM. The STAGE data were used for QSM reconstruction4. A template-based approach was used to determine the boundaries for the DGM using the QSM data except for the PUT and CN where the T1W images were used4. A dynamic programming approach (DPA) was used to fine tune the boundaries in the original space4. Both susceptibility and volume were extracted from the final boundaries overlaid onto the QSM data while the NM volume was calculated from all signals in the NM territory greater that 10% above the background.
Statistical analyses were performed using SPSS (version 24.0; IBM Corp). Alpha was set to 0.05 for all tests, and Bonferroni correction were used for the multiple image measures group comparison analysis. The age and image measures are shown as mean ± SD and compared using a one-way ANOVA test.
Results
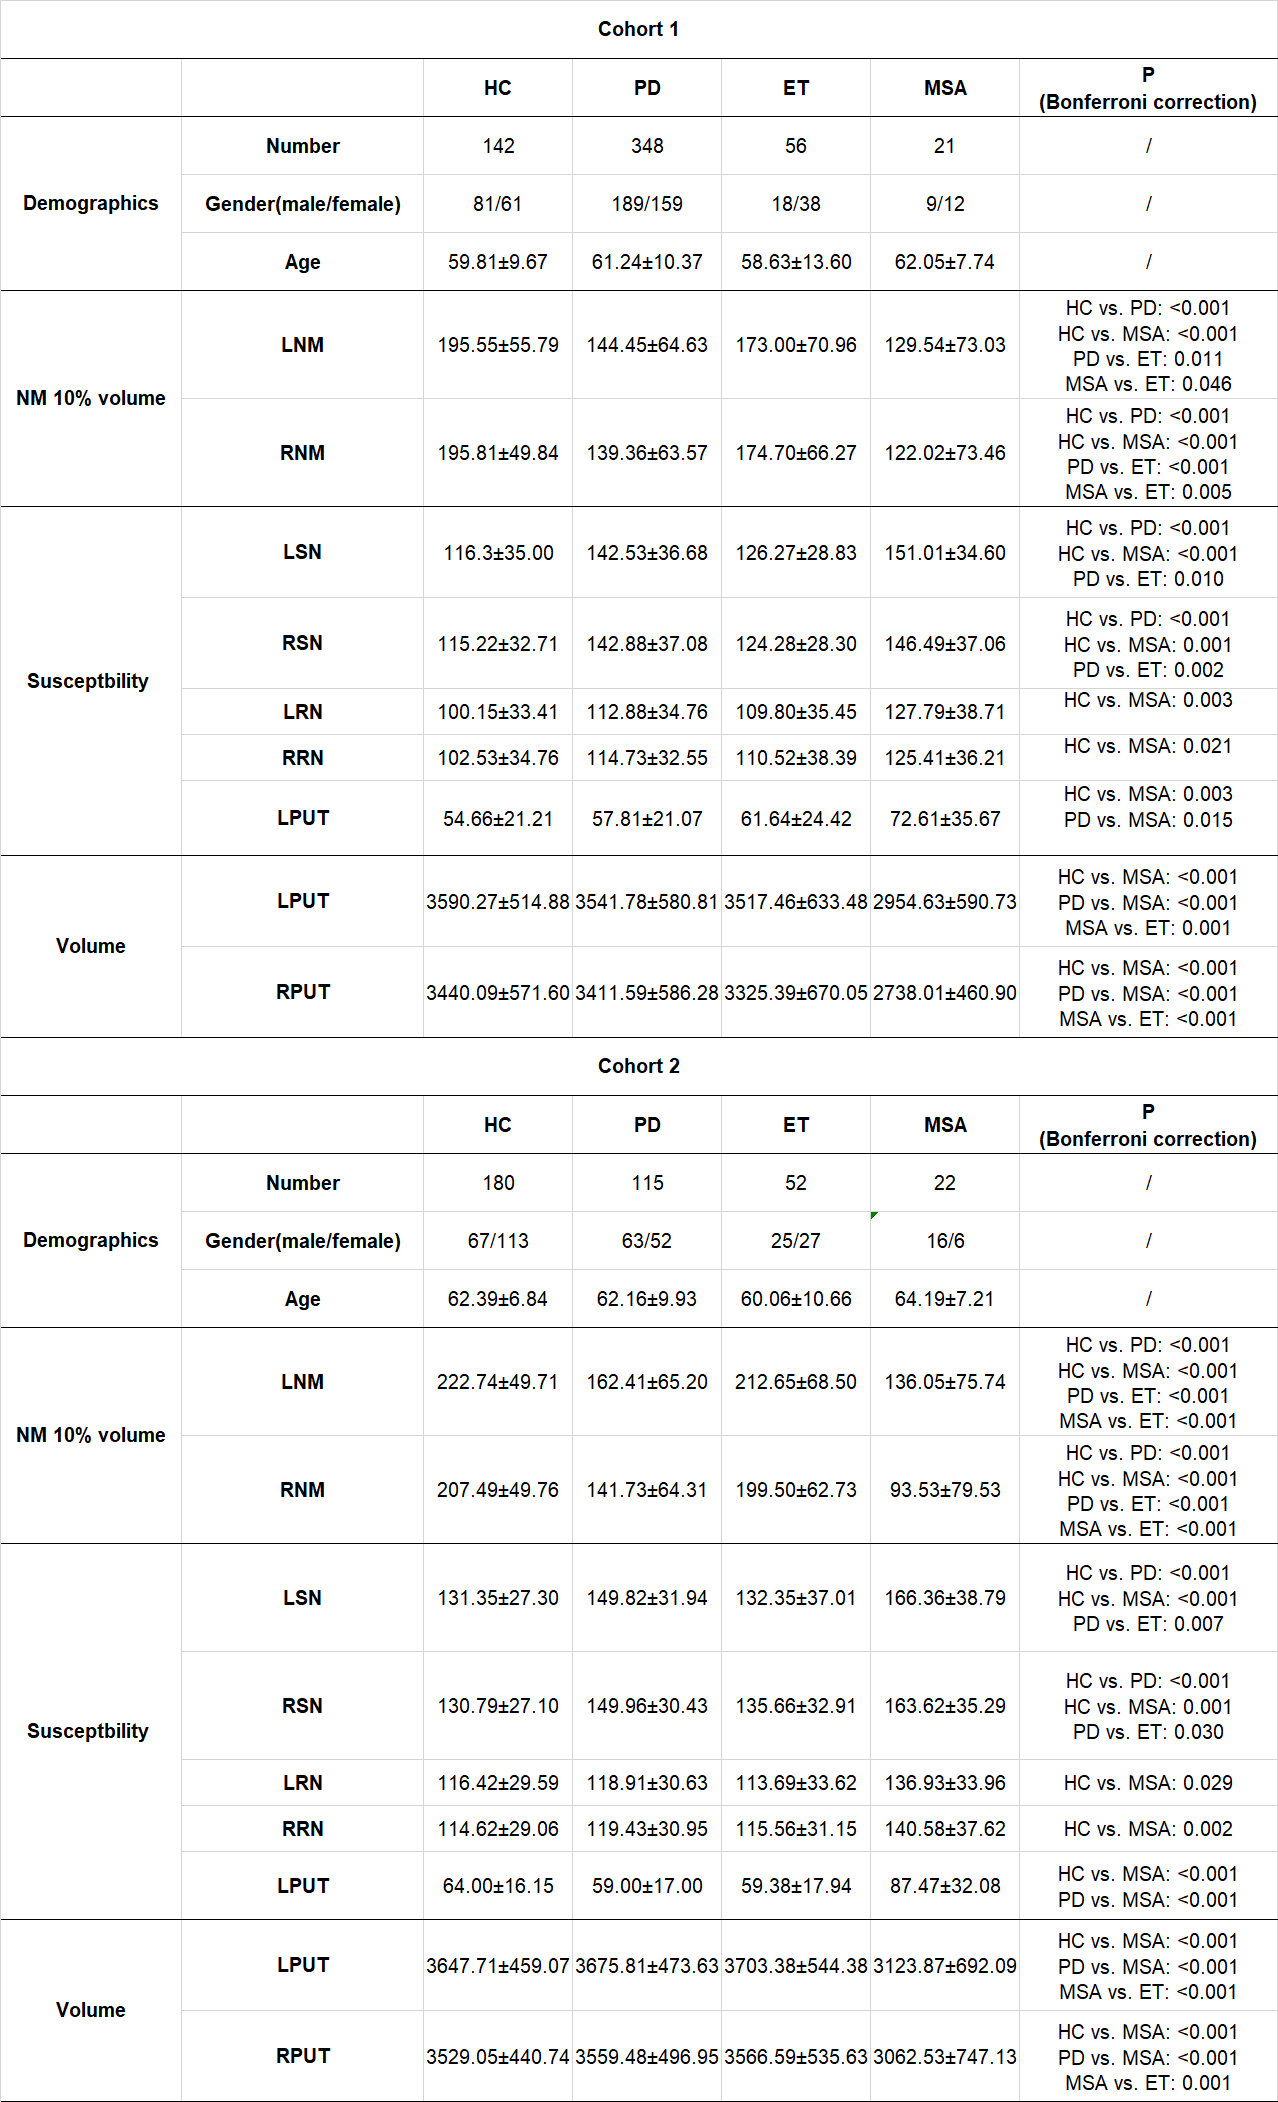
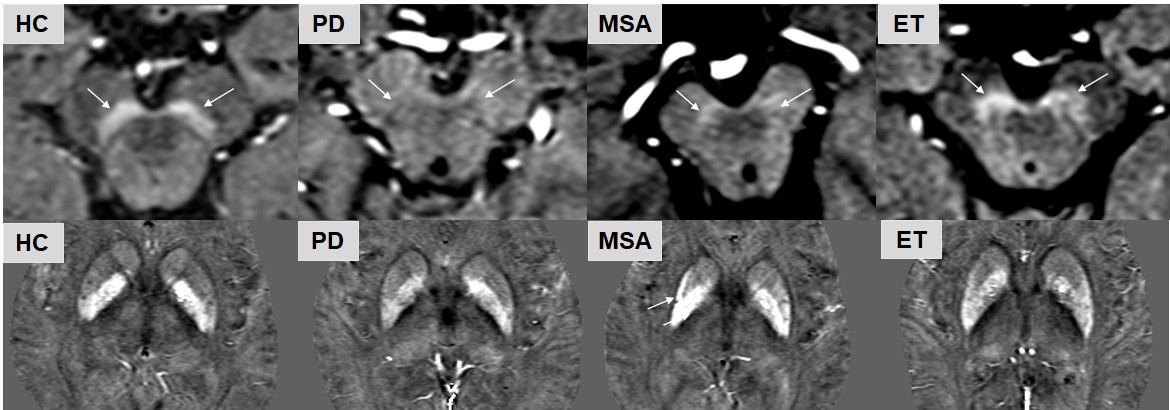
There were no significant differences in age for the MDS or HC groups in either Cohort 1 and Cohort 2, but the gender for the ET group in Cohort 1 and for the MSA group in Cohort 2 were significantly different than the other groups. There were multiple differences between the groups with respect to both iron and NM in the SN, RN and putamen. These are summarized in Table 2. Specifically, the key findings were as follows. The thresholded NM signals in the bilateral SN decreased in both the PD and MSA groups when compared with the HC or ET groups (Figure 1). The bilateral SN iron deposition increased in the PD and MSA groups compared to the HCs. The SN iron difference between the PD and ET groups was significant but not between the MSA and ET groups. Interestingly, the bilateral RN susceptibility were increased for the MSA group as compared with the control group, but not for the PD or ET group. Another important finding was the bilateral PUT atrophy and increased iron in the left PUT for the MSA group compared with all the other groups (Figure 1). These findings were equally valid in both cohorts.Discussion and Conclusion
The iron-NM MRI approach is useful in characterizing MDS because it noninvasively quantifies iron and NM in multiple deep gray matter structures, simultaneously. To our knowledge, this is one of the largest population studies evaluating the use of iron and NM measures in studying movement disorders, the results of which were validated using two independent cohorts. This easily used, readily available and automatic approach could potentially be transformed from those specialized research centers and incorporated into clinical practice. In the future, ROC analysis distinguishing patients from controls and differentiating different MDS patients will be conducted to display the differential diagnosis performance of each image measure. Also, the correlation between neuroimaging biomarkers and clinical scales will be investigated.Acknowledgements
This study was supported in part by grants from National Key R&D Program of China (2022YFC2009905/2022YFC2009900) and by the National Natural Science Foundation of China (grant number: 81971576).References
1. He N, Ghassaban K, Huang P, et al. Imaging iron and neuromelanin simultaneously using a single 3D gradient echo magnetization transfer sequence: Combining neuromelanin, iron and the nigrosome-1 sign as complementary imaging biomarkers in early stage Parkinson's disease. Neuroimage 2021;230:117810.
2. Mitchell T, Lehericy S, Chiu SY, Strafella AP, Stoessl AJ, Vaillancourt DE. Emerging Neuroimaging Biomarkers Across Disease Stage in Parkinson Disease: A Review. JAMA neurology 2021;78:1262-1272.
3. Matsuura K, Ii Y, Maeda M, et al. Neuromelanin-sensitive magnetic resonance imaging in disease differentiation for parkinsonism or neurodegenerative disease affecting the basal ganglia. Parkinsonism Relat Disord 2021;87:75-81. 4. Jin Z, Wang Y, Jokar M, et al. Automatic detection of neuromelanin and iron in the midbrain nuclei using a magnetic resonance imaging-based brain template. Hum Brain Mapp 2022.
Figures