3203
Functional and Microstructural Comparative Study on Monogenic vs Idiopathic Parkinson's Disease1Umram, Bilkent University, Ankara, Turkey, 2Faculty of Medicine, Department of Nuclear Medicine, Hacettepe University, Ankara, Turkey, 3Faculty of Medicine, Department of Neurology, Hacettepe University, Ankara, Turkey, 4Faculty of Medicine, Department of Radiology, Hacettepe University, Ankara, Turkey, 5University of California, Davis, CA, United States
Synopsis
Keywords: Parkinson's Disease, fMRI (resting state)
Clinical presentation of monogenic PD differs from idiopathic PD, which might relate to different structural and functional alterations. Previously, we examined a small group of genetic PD patients with connectivity changes in the basal ganglia, compared with healthy control (HC)s. In this study we further examined monogenic PD patients and compared idiopathic PD group and HCs that functional and microstructural changes would be different in these groups of patients. There was no significant basal ganglia network (BGN) alteration between PD groups, but ACC activation is remarkable in both groups. Significantly decreased fractional anisotropy in mPD patients compared to iPD patients.Introduction
Recently several monogenic forms of Parkinson’s disease (mPD) have been identified which are mostly devoid of alpha-synuclein pathology, implying that they are a pathological entity separate from idiopathic PD (iPD)1. We hypothesized that functional connectivity within the basal ganglia network assessed by resting-state fmri and white matter microstructural changes assessed by Diffusion Tensor Imaging (DTI)-Tract-Based Spatial Statistics (TBSS) analysis would be different in monogenic PD than idiopathic PD patients.Methods
The Institutional Ethical Committee approved the study and all participants gave written informed consent and the. 16 iPD, 18 mPD patients and 9 healthy controls (HCs) took part in this study.Imaging data were acquired on a 3.0 T (Architect, GE) whole-body MRI system. Subjects were instructed to rest with their eyes closed, not to think of anything in particular, and not to fall asleep. fMRI data were collected by EPI sequence with the following settings: TR = 1000 ms, TE = 25 ms, FA = 60°, FOV = 192×192 mm2, slices = 36, in-plane matrix = 128×128, thickness = 4 mm, no slice gap, voxel size =1.8×1.8×4.0 mm3. Anatomical images were collected using 3D T1 MP-RAGE sequence (TR = 8.7 ms, TE = 3.25 ms, FA= 8°, slice thickness = 1.2 mm, 36 slices, 264, FOV = 256×256 mm2, matrix size = 512×542 and voxel size = 1.2×1.2×1.2 mm3 on each subject. DTI: TR/TE: 4308/110.7 ms, 36 independent directions, with 3 mm slice thickness, max b=1000 mm2/s, 1 mm voxel size.
Fifteen iPD (age: 50.58±9.8 years (mean±SD); MMSE: Mini Mental State Examination: 29.10±1.28; BDI: Beck Depression Inventory: 13.20±9.3 ) and eighteen mPD patients (age: 43.61±9.51 years (mean±SD), p=0.063; Mini Mental State Examination (MMSE): 26.66±3.39, p=o.o4; BDI: Beck Depression Inventory: 13.61±8.81, p=0.77) were included into the rs-fMRI analysis. One patient from iPD group was excluded from fMRI analysis because of motion artifacts. RS-fMRI data preprocessing and analyses were obtained with CONN toolbox2 implemented in Matlab20203. Preprocessing steps included motion correction using SPM124. SPM12 and xjview toolbox5 was used for MNI coordinates and anatomical labeling, and Wfupickatlas6 toolbox was used for ROI definition and basal ganglia network was formed by combining the caudate nucleus, pallidum, putamen, substantia nigra, and subthalamic nuclei. Seed based connectivity (SBC) was applied to analyze the data to characterize the connectivity patterns with a predefined seed for BGN networks. We used tract-based spatial statistics (TBSS)7 in FMRIB Software Library (FSL 6.0)8 for voxelwise whole brain DTI. To create the mean FA skeleton representing all major WM tracts common to the sample all FA images were averaged. After preprocessing voxel-wise statistical analyses of differences between groups image sets were performed on the whole-brain mean FA skeleton to identify significantly affected white matter tracts using a general linear model (GLM), set up in the FSL Randomize Tool. The contrasts were analyzed according to permutation-based non-parametric inference with 500 random permutations using threshold-free cluster enhancement (TFCE) to correct for multiple testing.
Results
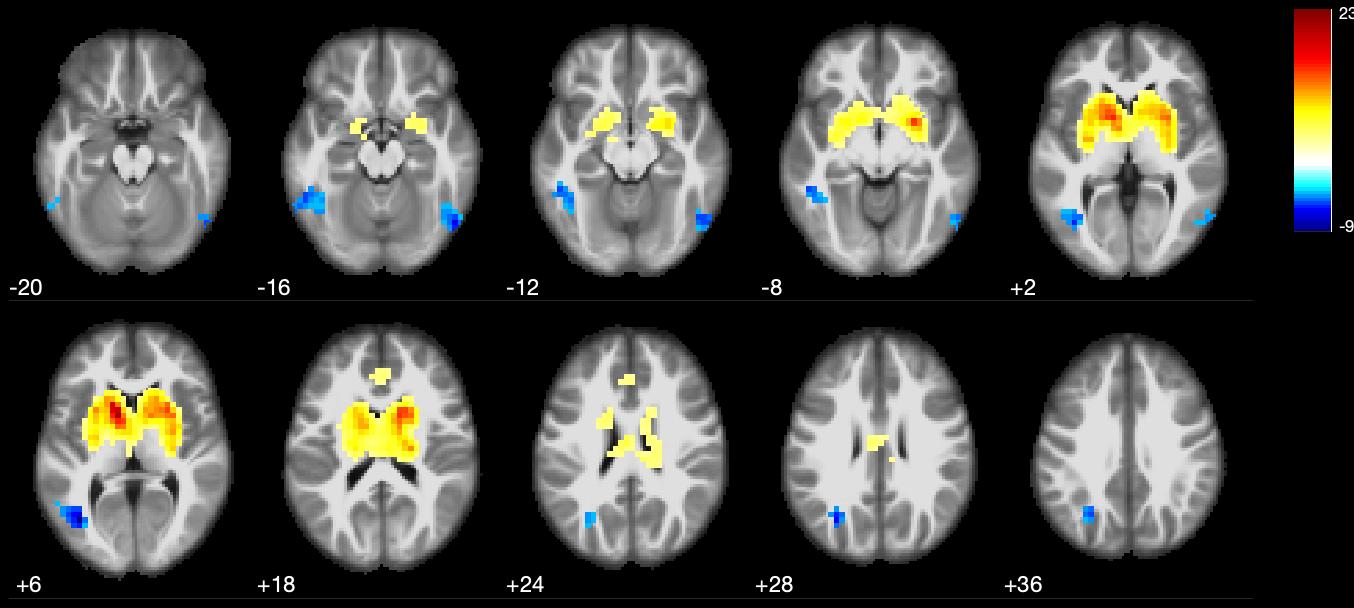
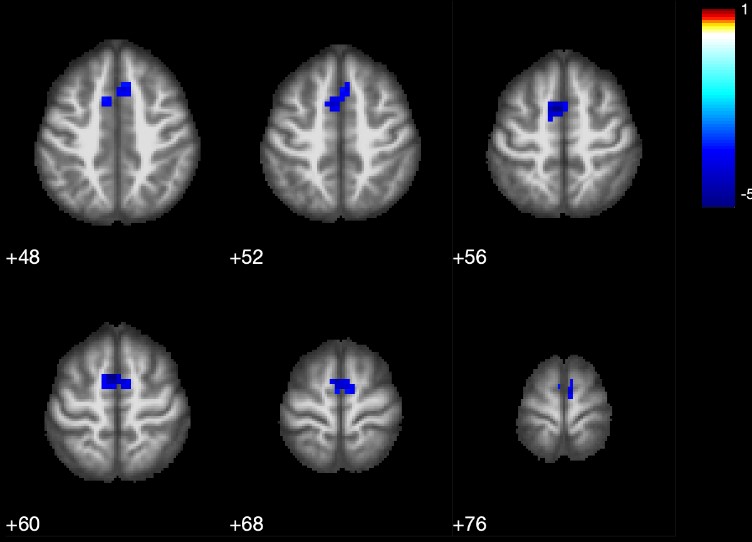
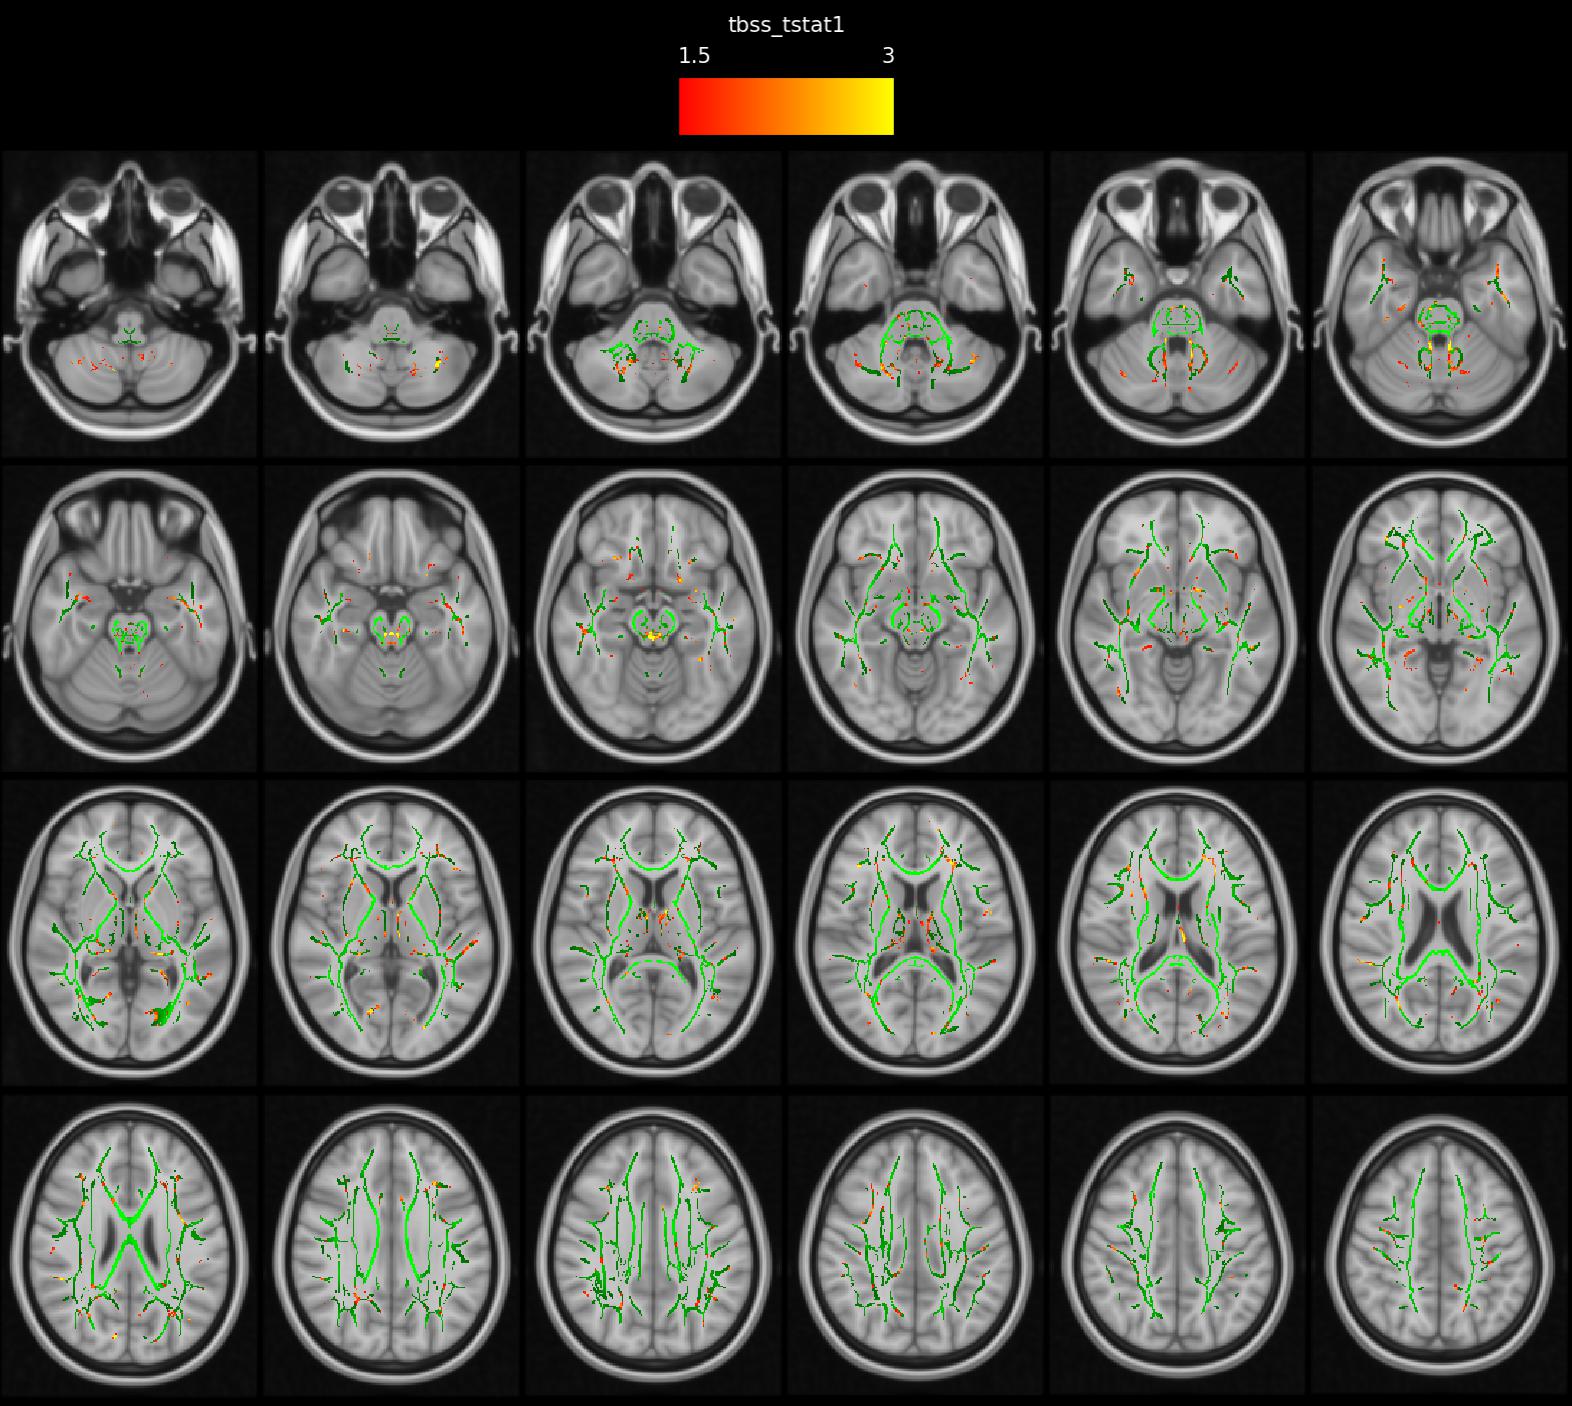
Patients and HCs were similar in terms of gender and age (p>0.05). Statistical analysis for group differences (independent sample t test) was performed using SPSS v. 26.0 for Mac.Basal ganglia network (BGN) maps showed caudate nucleus, pallidum, putamen and thalamus activity in both iPD and mPD patients and HCs (Fig.1-2-3). The mPD group tended to increase strength of activity (red, t=17.3) compared to iPD (t=11.8) (Fig.3) and also ACC contributed to BGN in both iPD and mPD patients (Fig.2-3). There was no significant functional connectivity alteration between Parkinson groups (p>0.001). However, when each patient group was compared to HCs, reduced spatial activity in supplementary motor areas in mPD patients (p<0.001 Fig.4) without a significant difference in the iPD group with putamen used as an ROI. Widespread significantly reduced FA was observed in the white matter including the white matter of medial temporal lobes, bilateral cingulum, fornices, internal and external capsules, superior cerebellar peduncles and decussation, bilateral superior longitudinal gyrus, thalami was detected in mPD compared to iPD (TFCE corrected, p<0.05).(Fig. 5) FA decrease in cerebellum, superior cerebellar peduncles, decussation and thalamus in mPD group was also remarkable.
Discussion
Higher activation strength in the basal ganglia structures and widespread reduced white matter FA in mPD than iPD group likely reflect discrete etiopathogenetic alterations in these two Parkinsonism groups. Cerebellar white matter changes especially in superior cerebellar peduncles and thalami are especially noteworthy in mPD group similar to atypical Parkinsonian disorder. Reciprocal connections between the basal ganglia and cerebellum may also partly explain our findings9,10. In our further ongoing study, the relation between our findings and F-18 DOPA uptake in the basal ganglia structures is also under evaluation.Conclusion
Different connectivity patterns and strength occur in monogenic forms of Parkinson Disease than more common idiopathic form of the disease. Our findings support increasing pathophysiological and clinical evidence of underlying differences in these groups. Further studies focusing on the cerebellum and deep gray matter nuclei connectivity are needed to elucidate the clinical correlations of these findings.Limitations
To evaluate BG connectivity differences in PD groups, basal ganglia forming parts were evaluated together, an average alteration was calculated, and no difference was observed in the functional connection between groups, but these parts may be evaluated separately.Acknowledgements
No acknowledgement found.References
1. Guedes LC , Mestre T, Outeiro TF, et al. Are genetic and idiopathic forms of Parkinson’s disease the same disease? J. Neurochem. 2020;152:515-52.
2. Conn: A functional connectivity toolbox for correlated and anticorrelated brain networks. Brain connectivity. 2(3), 125-141)
3. Mathworks Inc., Natick MA, USA
4. https://www.fil.ion.ucl.ac.uk/spm/software/spm12/
5. https://www.alivelearn.net/xjview
6. https://www.nitrc.org/projects/wfu_pickatlas/
7. Smith SMM, Jenkinson H, Johansen-Berg D, et al. Tract-based spatial statistics: Voxelwise analysis of multi-subject diffusion data. NeuroImage. 2006; 31:1487-1505.
8. Smith SM, Jenkinson M, Woolrich MW et al. Advances in functional and structural MR image analysis and implementation as FSL. NeuroImage, 23(S1):208-219, 2004.
9. Bostan JA and Strick PL. The Cerebellum and Basal Ganglia are Interconnected. Neuropsychol Rev. 2010;20(3): 261–270.
10. Wu T and Hallett M. The cerebellum in Parkinson’s disease. Brain. 2013; 136(3):696–709.
Figures
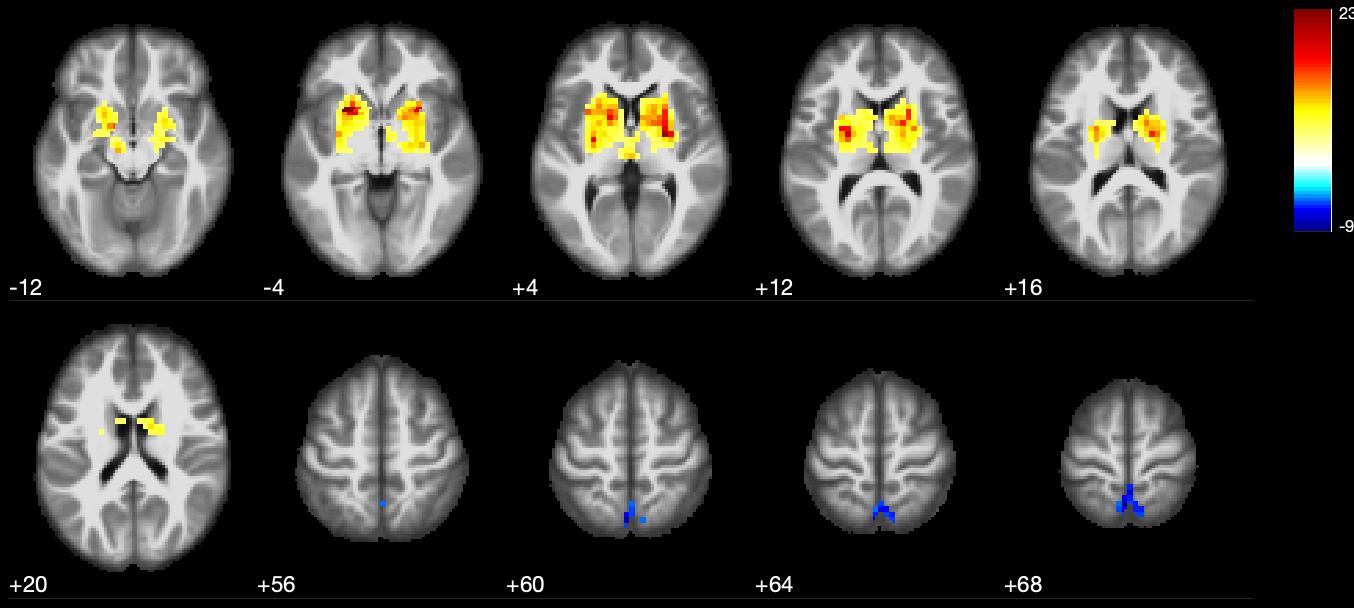
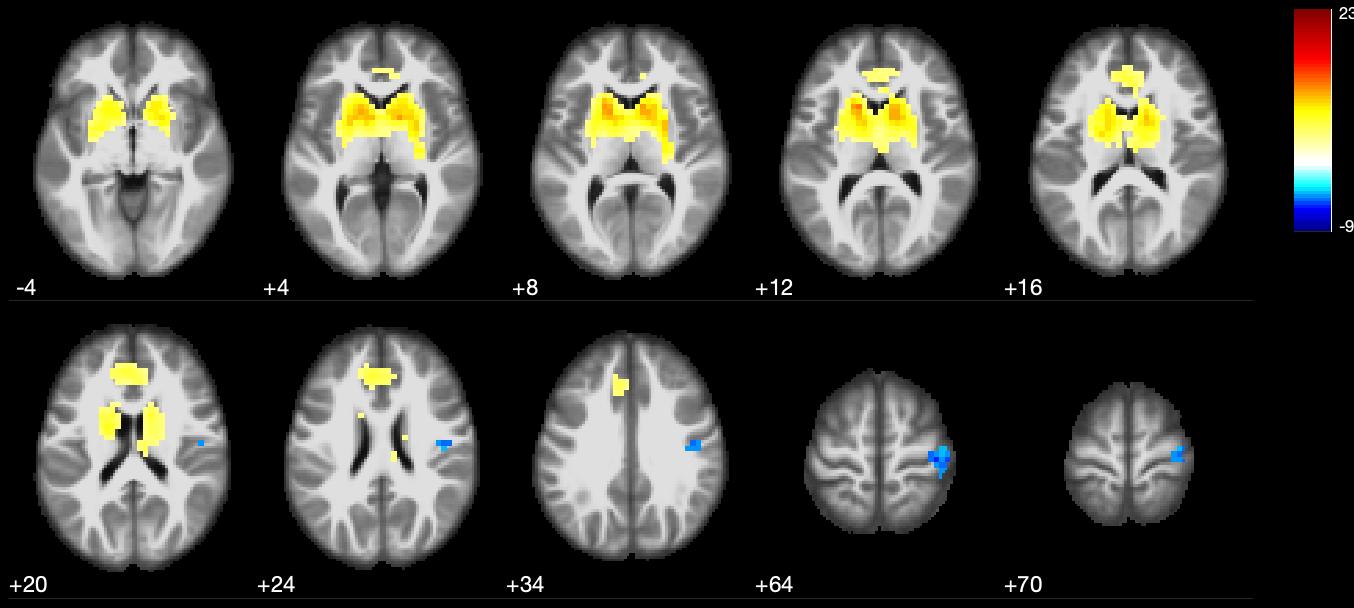
Figure1: Basal ganglia connectivity changes in healthy controls (one sample t test, the minimum cluster size was set at 211 voxels with cluster level of p<0.05). The caudate nucleus, pallidum, and putamen took part in this network and deactivated voxels in posterior cingulate cortex (PCC) (images in neurologic convention).