3195
Reductions in nigral volume of de novo and moderate Parkinson’s disease patients1Center for Advanced Neuroimaging, University of California Riverside, Riverside, CA, United States, 22Department of Neurosciences, University of California San Diego, San Diego, CA, United States, 3Department of Neurology, Emory University, Atlanta, GA, United States, 4Department of Bioengineering, University of California Riverside, Riverside, CA, United States
Synopsis
Keywords: Parkinson's Disease, Parkinson's Disease, substantia nigra
Neuronal loss in substantia nigra pars compacta is a hallmark of Parkinson's disease. In this abstract, we examine nigral volume in a group without Parkinson's disease (non-carriers, non-manifest LRRK2 and GBA mutations), de novo Parkinson's disease, and moderate Parkinson's disease. Reductions in nigral volume are seen in the Parkinson's disease groups relative to the group without Parkinson's disease. A further reduction is seen in nigral volume of the moderate Parkinson's disease group relative to the de novo group, suggesting that nigral degeneration continues as Parkinson's disease progresses.Introduction
Parkinson’s disease (PD) is a heterogeneous neurodegenerative disorder with a variety of motor and non-motor symptoms that can be clinically challenging to diagnose and manage. There are currently no effective interventions to stop PD neurodegeneration. Postmortem studies have yielded some insights into PD biology, and by the time of symptom onset and clinical diagnosis, there is an estimated 30-60% loss of pigmented dopamine neurons in the substantia nigra compacta (SNc).1-3 However, the role of neuromelanin (NM) in PD pathogenesis has been challenging to study due to a lack of tools to investigate neuromelanin biology in living patients.Melanized neurons in SNc can be visualized in vivo using either incidental magnetization transfer effects from an interleaved multi-slice turbo spin echo acquisition or explicit magnetization transfer effects generated by magnetization transfer preparation pulses.4-6Application of magnetization transfer effects to investigate PD-related changes in catecholamine nuclei have revealed reductions in nigral volume7-9 or nigral contrast.5,10 Here we used NM-MRI data acquired with a magnetization transfer (MT) prepared gradient echo (GRE) sequence to examine nigral volume in nonmanifest and manifest LRRK2 and GBA mutation carriers in addition to de novo and moderate PD from the Parkinson’s Progression Markers Initiative (PPMI).
Methods
Data were downloaded from the Parkinson’s Progression Markers Initiative (PPMI) database (www.ppmi-info.org/data). For up-to-date information on the study, visit www.ppmi-info.org. Full inclusion and exclusion criteria for enrollment in PPMI can be found at www.ppmi-info.org. Institutional IRB approved the study for each site and subjects gave written informed consent.Criteria for inclusion of subjects from the PPMI database were as follows: 1) participants must be scanned with a magnetization transfer (MT) prepared GRE sequence on a Siemens scanner. A total of 199 subjects (81 subjects without PD (nonmanifest LRRK2, nonmanifest GBA, controls), 92 de novo PD patients, and 26 PD patients at the 48-month time point) met these criteria. Imaging data were downloaded in July 2022.
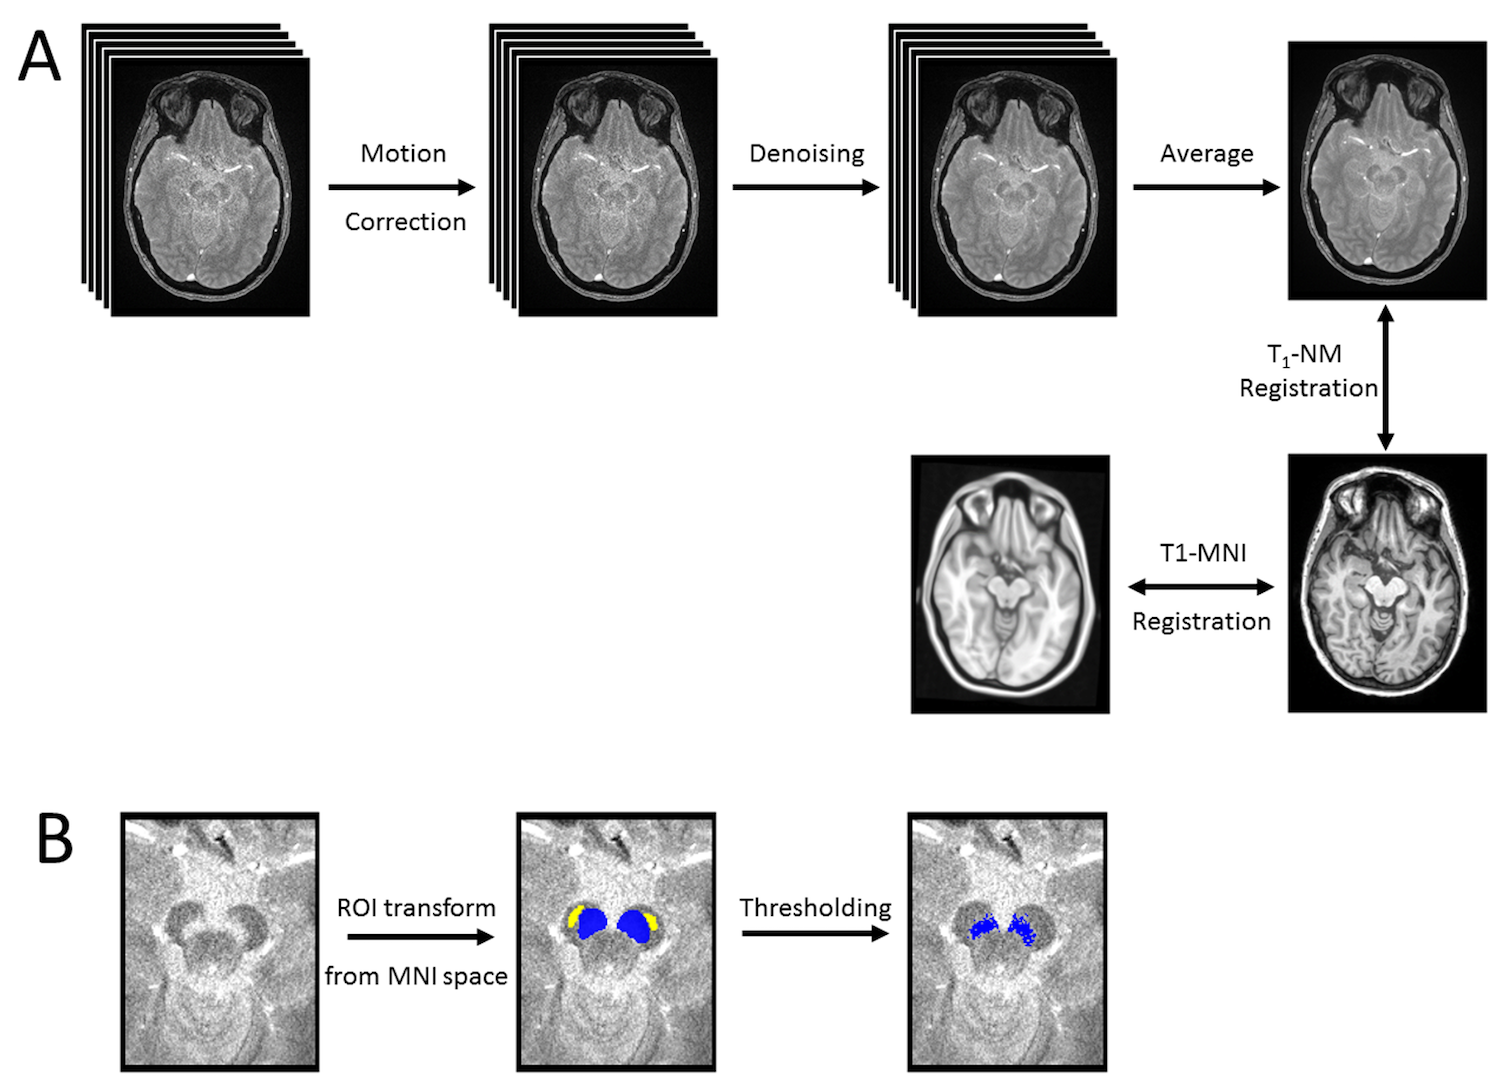
SNpc was segmented using a thresholding method. A reference region was drawn in the cerebral peduncle in MNI common space and then transformed to individual NM-MRI images and used to threshold. Voxels with intensity >mref+3sref were considered to be part SNpc. Thresholding was restricted to the anatomic location of SNpc using previously reported probabilistic standard space mask. Schematics detailing the processing pipeline is shown in Figure 1.
Results
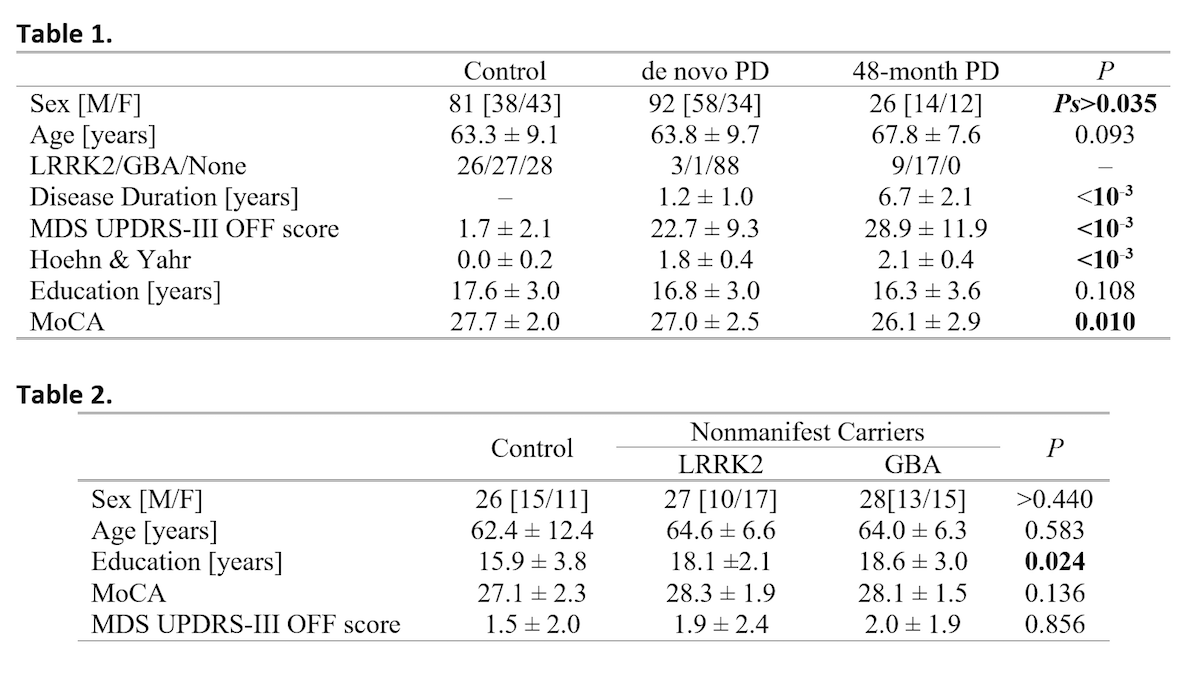
A significant difference in sex was observed between de novo PD and control groups (P=0.035) but no difference was seen between de novo PD and 48-month PD groups (P=0.491) or between 48-month PD and control groups (P=0.459). Sex was controlled for in subsequent demographic analyses. No difference in age (F=2.400;P=0.093) or education (F=2.251;P=0.108) was seen between de novo PD, 48-month PD, and control groups. Demographic information for the PD and control groups is summarized in Table 1.No differences in sex (Ps>0.440), age (F=0.522;P=0.583), MoCA (F=2.060;P=0.136), or MDS UPDRS-III (F=0.155;P=0.856) score were observed between LRRK2 nonmanifest carriers, GBA nonmanifest carriers, and the control group without mutations. Demographic information for this analysis is summarized in Table 2.
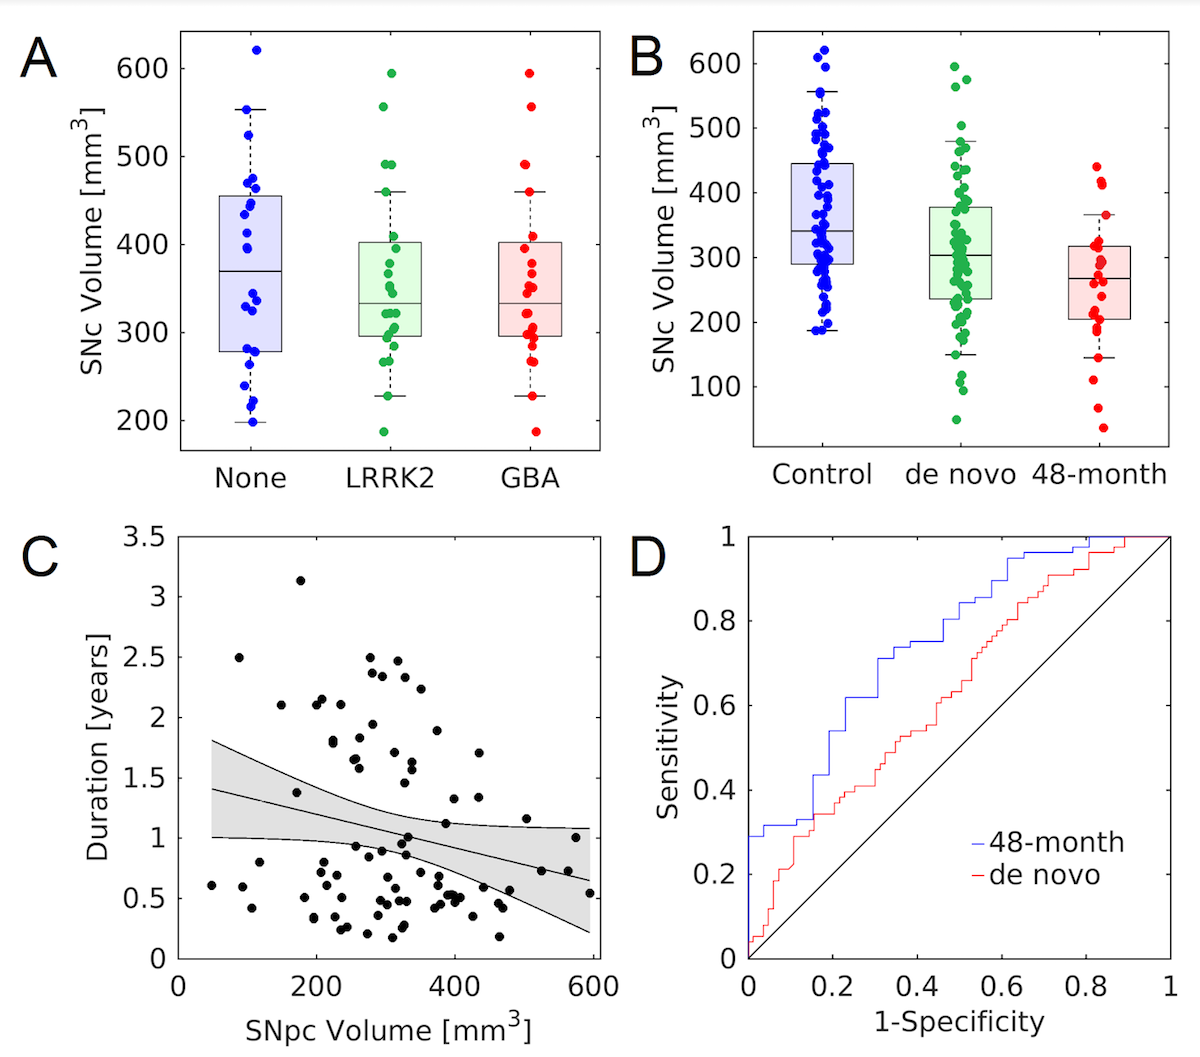
The effect of LRRK2, GBA, and no genetic mutation on nigral volume in nonmanifest carriers and controls was tested with an ANCOVA analysis with the number of measurements in the NM protocol as a covariate. ANCOVA analysis revealed no difference in nigral volume between nonmanifest carriers of LRRK2 and GBA mutations and controls (F=0.102;P=0.902). The number of measurements in the NM protocol was not a significant covariate (F=0.077;P=0.782) in the model. A comparison of SNc volume in the LRRK2 nonmanifest carriers, GBA nonmanifest carriers, and controls is shown in Figure 2. Nonmanifest carriers of LRRK2 and GBA mutations will be included in the control group in subsequent analyses since genetic mutation does not significantly influence nigral volume in nonmanifest subjects.
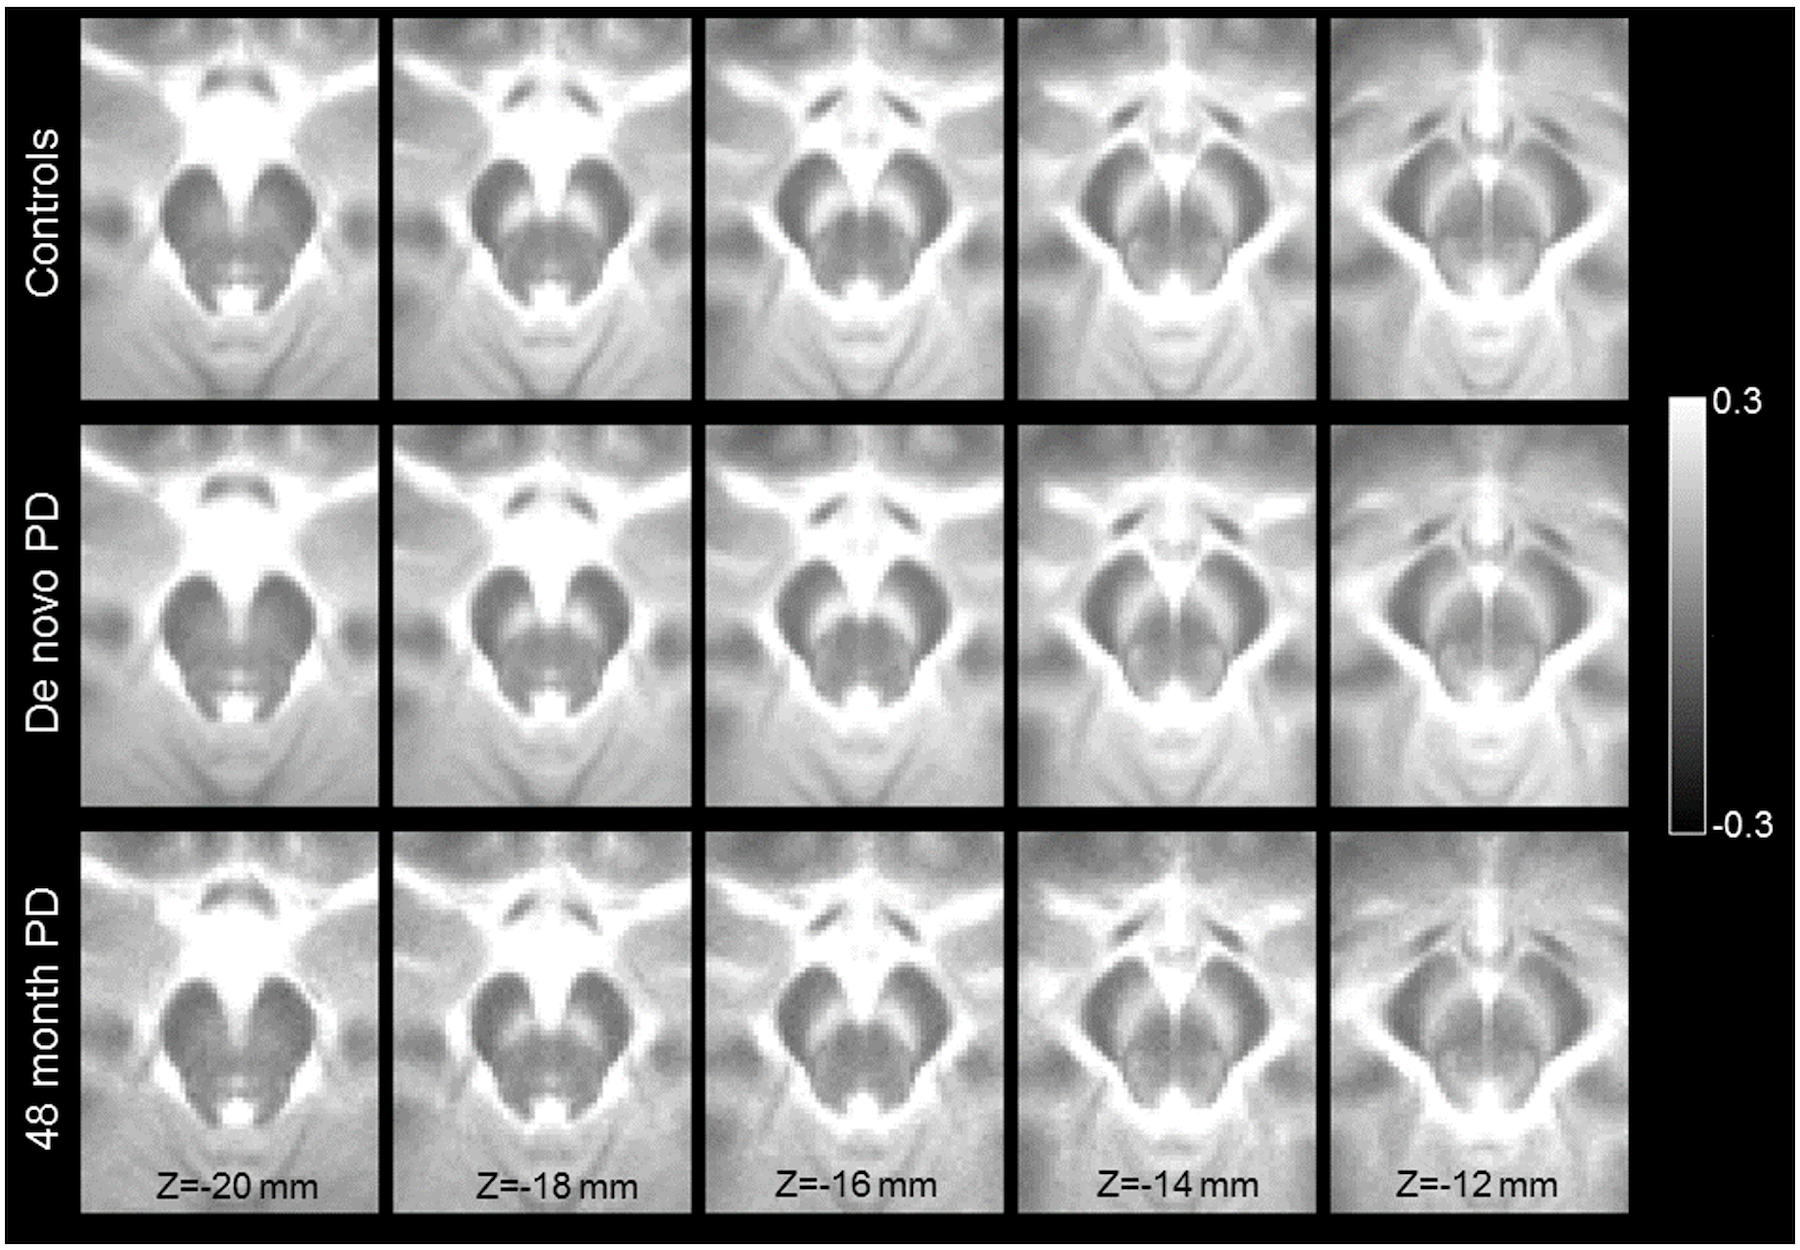
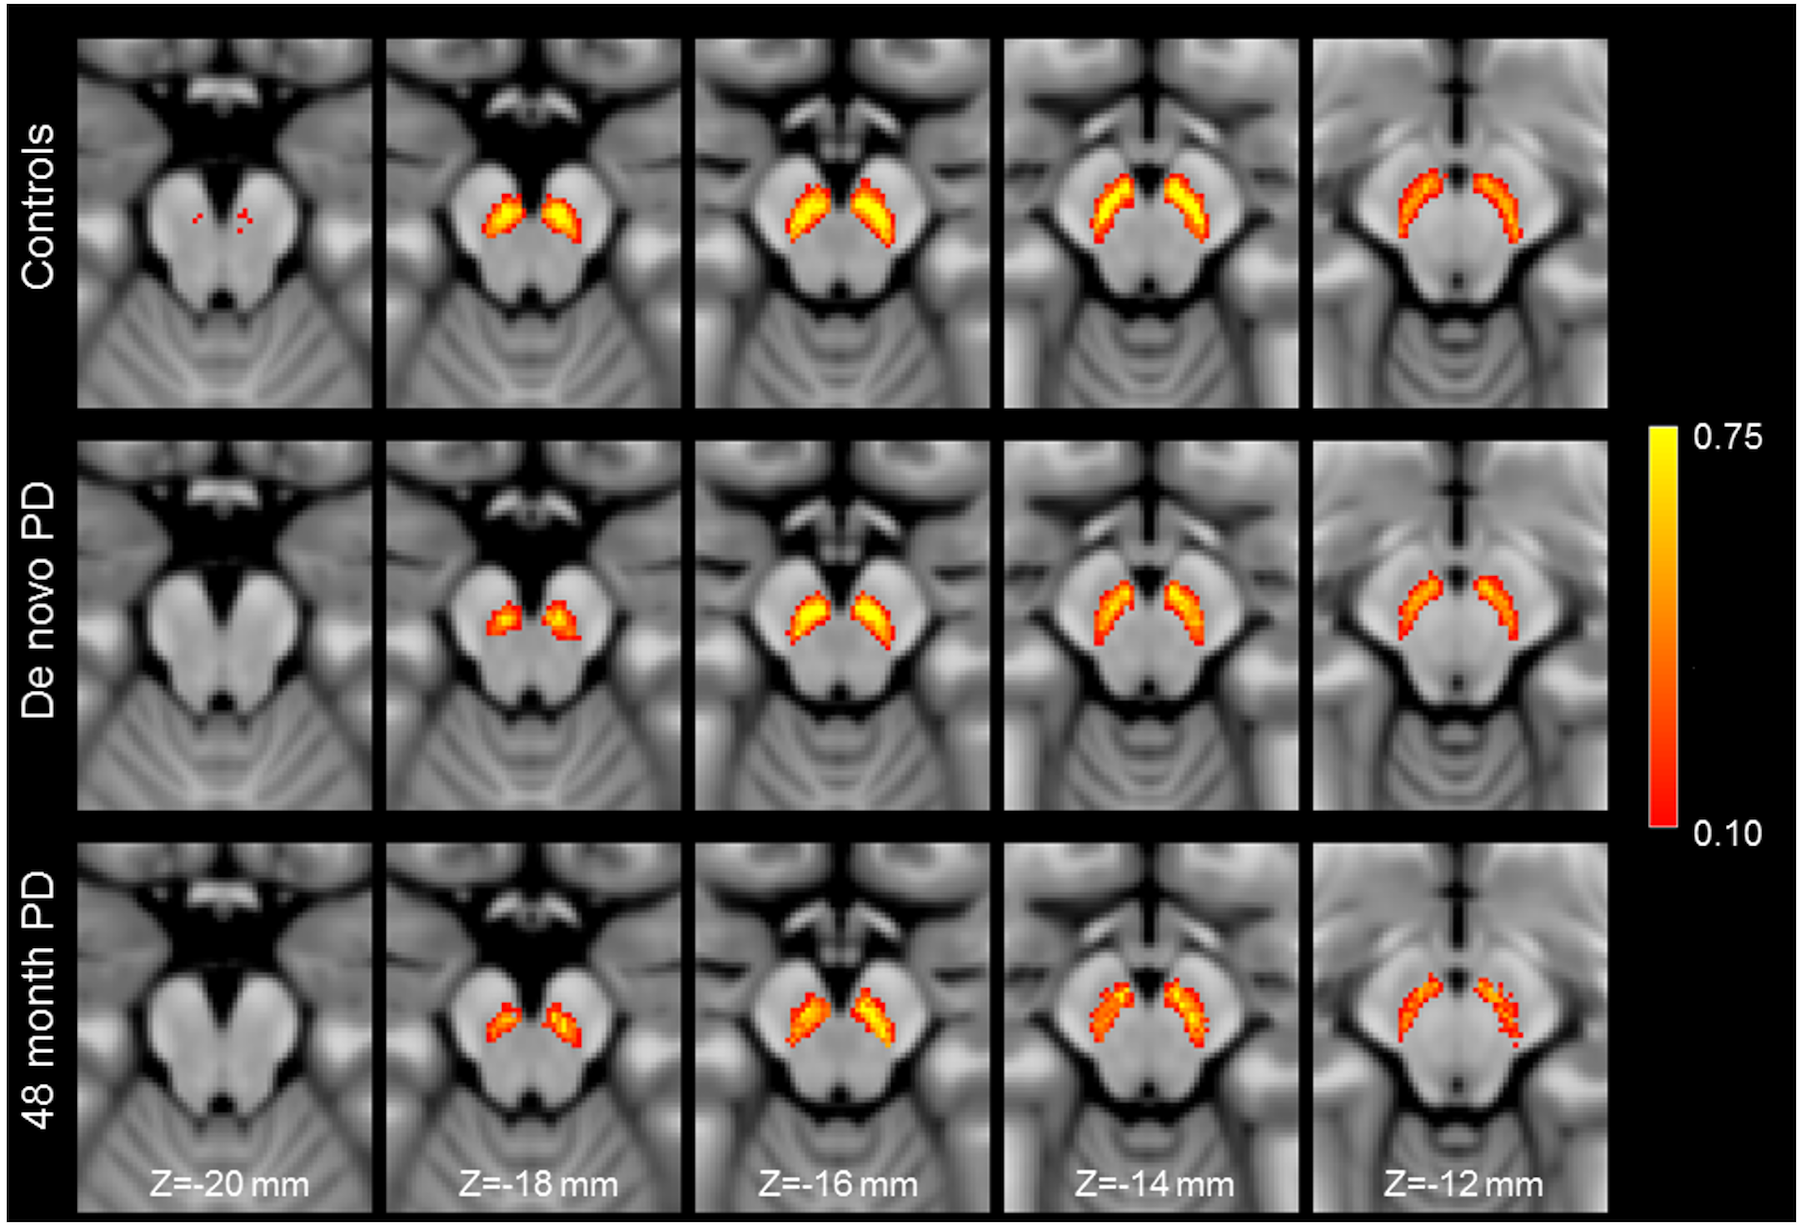
Figure 3 shows a comparison of mean MTC images in the control group (noncarriers, nonmanifest genetic carriers), de novo PD group, and 48-month PD group. The effect of group (de novo PD, 48-month PD, control) on SNc volume was assessed using an ANCOVA with number of measurements in the NM protocol and gender as covariates. A significant main effect of group (F=9.283;P<10-3) revealed reduced SNc volume in the 48-month PD group (261 mm3 ± 104 mm3) as compared to the de novo PD (306 mm3 ± 109 mm3;P=0.026) and control (366 mm3 ± 109 mm3; P<10-3) groups. Reduced SNc volume was seen in the de novo PD group relative to the control group (P<10-3). Gender was a significant covariate in the model (F=14.875;P<10-3) but NM protocol was not a significant covariate (F=0.334;P=0.564). A comparison of SNc population atlases is shown in Figure 4.
Discussion
SNc volume was not found to differ between nonmanifest subjects with LRRK2 and GBA genetic mutations and controls. As compared to controls, reductions in volume were observed in both PD groups (Figures 3 and 4), with a further reduction seen in nigral volume of the 48-month PD group relative to the de novo PD group. Interestingly, when the PD groups were combined, a negative association was found between disease duration with nigral volume, suggesting loss continues as PD progresses from the de novo stage into moderate stage of PD.Acknowledgements
PPMI – a public-private partnership – is funded by the Michael J. Fox Foundation for Parkinson’s Research and funding partners, including [list the full names of all of the PPMI funding partners found at www.ppmi-info.org/about-ppmi/who-we-are/study-sponsors].
This work was supported by NIH-NINDS 1K23NS105944 and NIH-NINDS 1U19AG071754 from the National Institutes of Health/National Institute of Neurological Diseases and Stroke, Michael J. Fox Foundation grants (MJFF-010556 and MJFF-010854), and the American Parkinson’s Disease Foundation Center for Advanced Research at Emory University.
References
[1] Braak, et al. Staging of brain pathology related to sporadic Parkinson's disease. Neurobiol Aging, 24:197-211
[2] Fearnley & Lees. Ageing and Parkinson’s disease: substantia nigra regional selectivity. Brain 114:2283-2301
[3] Cheng, et al. Clinical progression in Parkinson’s disease and neurobiology of axons. Annals Neurol. 67:715-725
[4] Sasaki, et al. Neuromelanin magnetic resonance imaging of locus ceruleus and substantia nigra in Parkinson's disease. Neuroreport. 17:1215-8
[5] Schwarz, et al. T1-Weighted MRI shows stage-dependent substantia nigra signal loss in Parkinson's disease. Movement Disorders. 26:1633–38
[6] Chen, et al. Simultaneous imaging of locus coeruleus and substantia nigra with a quantitative neuromelanin MRI approach. Magn Reson Imaging. 32:1301-6
[7] Ogisu, et al. 3D neuromelanin-sensitive magnetic resonance imaging with semi-automated volume measurement of the substantia nigra pars compacta for diagnosis of Parkinson’s disease, Neuroradiology 55:719–724
[8] Langley, et al. Nigral volumetric and microstructural measures in individuals with scans without evidence of dopaminergic deficit. Front. Neurosci. 16:1048945
[9] Schwarz, et al. In vivo assessment of brainstem depigmentation in Parkinson disease: potential as a severity marker for multicenter studies, Radiology :160662
[10] Reimao, et al. Substantia nigra neuromelanin magnetic resonance imaging in de novo Parkinson’s disease patients, Eur. J. Neurol. 22: 540–546
Figures