3194
A Correlation Study Between Brain Sub-Region Volumes and the Severity of Parkinson’s Disease1China-Japan Union Hospital of Jilin University, Jilin, China, 2MR Collaboration, Central Research Institute, United Imaging Healthcare, Shanghai, China
Synopsis
Keywords: Parkinson's Disease, Segmentation
By applying a deep-learning based brain segmentation algorithm on T1-weighted images, the brain was segmented into 106 sub-regions and regional volumes were determined automatically. We analyzed the relationship of brain regional volumes and the severity of Parkinson’s Disease (PD) and compared regional volumes in a cohort of patients with mild and moderate PD. Our data demonstrated that regional volumes of certain brain structures had the potential ability in the characterization of PD.Introduction
Parkinson’s Disease (PD) is a neurodegenerative disorder characterized by the degeneration of dopaminergic neurons in the striatum and deposits of alpha-synuclein1,2. Volume changes of regional brain structures such as caudate nucleus, thalamus, gray matter, and white matter, have been documented in PD brains3,4. However, a thorough evaluation including brain sub-regions of the whole brain and their relationships with PD stages has been sparsely investigated. The purpose of this study was to evaluate the correlation between the severity of PD and brain sub-regional volumes, as well as regional volume changes with the progression of PD.Methods
Thirty-three patients with PD (22 female, 61.4±10.4 years) were included in this study and underwent MR examinations with a 3 T system (uMR 780, United Imaging Healthcare, Shanghai, China) using the 3D high-resolution T1-weighted imaging sequence. Imaging parameters of the study protocol were as follows: TR 35.5 ms, slice thickness 2 mm, spacing between slices 2 mm, FOV 190×224 mm2, matrix size 435×512. A deep learning-based approach was implemented on T1-weighted images for the segmentation of the brain. A total of 106 brain sub-regions were generated and volumes of these sub-regions were determined quantitatively in an automatic manner.All patients participated the Unified Parkinson’s Disease Rating Scale (UPDRS) testing, and the total UPDRS score was used to measure the disease severity and progression. According to the total UPDRS score, patients were divided into two sub-groups consisting of patients with mild PD (total UPDRS 1) and moderate PD (total UPDRS 2), respectively.
Statistical analyses were carried out using IBM SPSS Statistics 26 software. Spearman correlation analysis was performed to access the correlation between the brain sub-regional volume and the total UPDRS score. The Student’s t test was performed to compare the difference of brain sub-regional volumes between sub-groups of patients with mild and moderate PD. All results were considered statistically significant setting p<0.05.
Results
Among the 106 brain sub-regions, moderate negative correlations were found between UPDRS score and volumes of insula, isthmus of cingulate gyrus, caudate nucleus, thalamus, the right superior frontal gyrus, the right operculum, the right hippocampal gyrus, the right nucleus accumbent, the right superior parietal lobule and the right temporal pole (-0.70<r<-0.40, p<0.05). Weak negative correlations were discovered between the total UPDRS score and volumes of inferior parietal lobule, white matter, the left middle frontal gyrus, the left cingulate gyrus, the left precuneus, the right globus pallidus, the right ventral diencephalon and the right temporal gyrus (r>-0.40, p<0.05). The total UPDRS score was positively correlated with the left inferior horn of lateral ventricle (r=0.363, p<0.05).Volumes of insula, caudate nucleus, thalamus, white matter, the right superior frontal gyrus, the right operculum, the right putamen, the right globus pallidum, the right ventral part of diencephalon, the right superior temporal gyrus, the right temporal pole, and the left posterior part of middle frontal gyrus were found significantly higher in the group of mild PD than that in group of moderate PD (Table 1). For the left inferior horn of lateral ventricle, regional volumes were higher in the moderate group than that in the mild group (Table 1).Discussion
We found that regional brain volumes varied as PD progressed. Volume loss may indicate the loss of neurons and increased volumes may be associated with the occurrence of abnormal protein deposits in the brain5. Our study showed the ability of brain sub-regional volumes in depicting the severity of PD.Conclusion
To conclude, our findings demonstrated that the severity of PD had significant correlations with volumes of several brain sub-regions that volume changes in these regions may serve as potential biomarkers for the characterization of Parkinson’s Disease.Acknowledgements
No acknowledgementsReferences
1. Hornykiewicz O. Dopamine (3-hydroxytyramine) and brain function. Pharmacol Rev. 1966 Jun;18(2):925-64.
2. Lysia S. Forno, MD, Neuropathology of Parkinson's Disease, Journal of Neuropathology & Experimental Neurology, Volume 55, Issue 3, March 1996, Pages 259–272.
3. Lee SH, Kim SS, Tae WS, Lee SY, Choi JW, Koh SB, Kwon DY. Regional volume analysis of the Parkinson disease brain in early disease stage: gray matter, white matter, striatum, and thalamus. AJNR Am J Neuroradiol. 2011 Apr;32(4):682-7.
4. Langkammer C, Pirpamer L, Seiler S, Deistung A, Schweser F, Franthal S, Homayoon N, Katschnig-Winter P, Koegl-Wallner M, Pendl T, Stoegerer EM, Wenzel K, Fazekas F, Ropele S, Reichenbach JR, Schmidt R, Schwingenschuh P. Quantitative Susceptibility Mapping in Parkinson's Disease. PLoS One. 2016 Sep 6;11(9):e0162460.
5. Peter Pieperhoff, Martin Südmeyer, Lars Dinkelbach, Christian J. Hartmann, Stefano Ferrea, Alexia S. Moldovan, Martina Minnerop, Sandra Diaz-Pier, Alfons Schnitzler, Katrin Amunts, Regional changes of brain structure during progression of idiopathic Parkinson's disease – A longitudinal study using deformation based morphometry, Cortex, Volume 151, 2022, Pages 188-210.
Figures
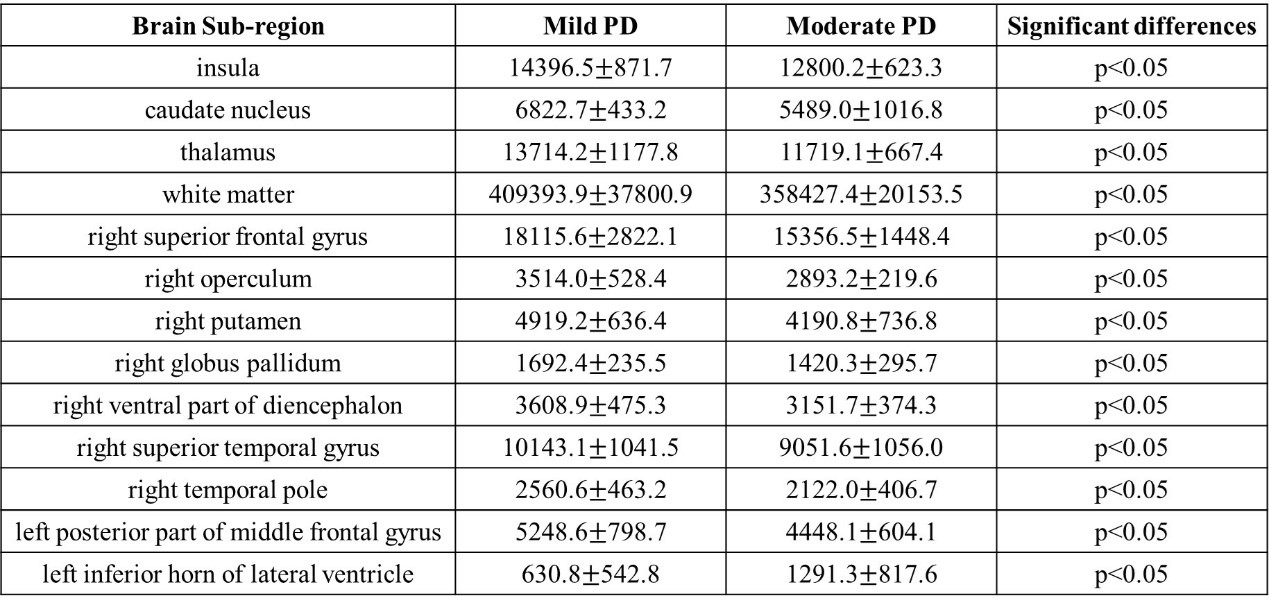
Table 1 Summary of group differences in brain sub-regional volumes between patients with mild and moderate PD. All the data was display by mean±standard deviation (units: mm2).
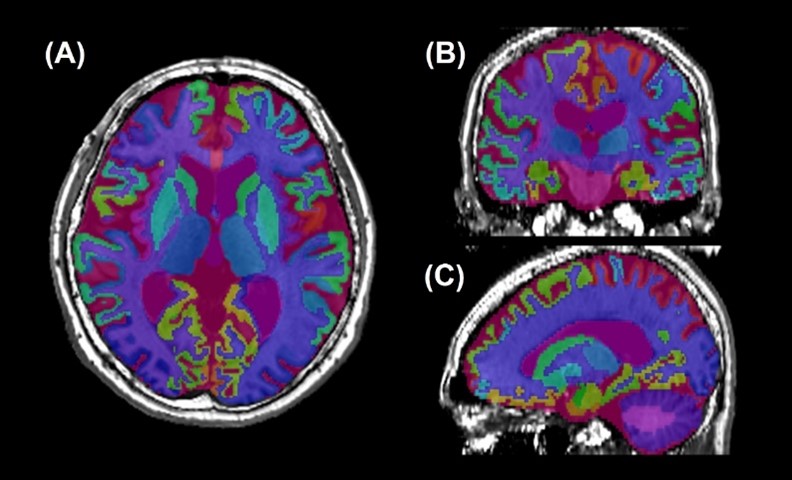
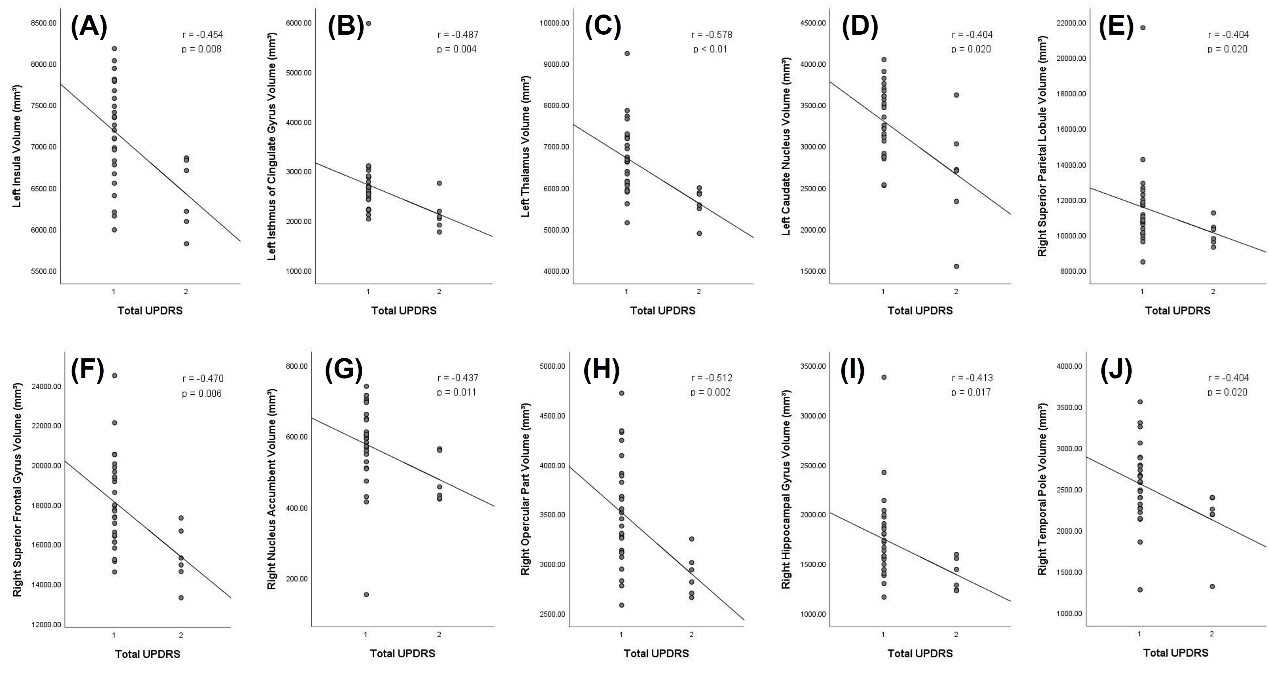
Figure 3 Scatterplot and linear regression line show the total UPDRS score was significantly correlated with the brain sub-regional volumes of with the left insula (A), the left isthmus of cingulate gyrus (B), the left thalamus (C), the left caudate nucleus (D), the right superior parietal lobule (E), the right superior frontal gyrus (F), the right nucleus accumbent (G), the right operculum (H), the right hippocampal gyrus (I), and the right temporal pole (J), respectively. UPDRS: Unified Parkinson’s Disease Rating Scale.
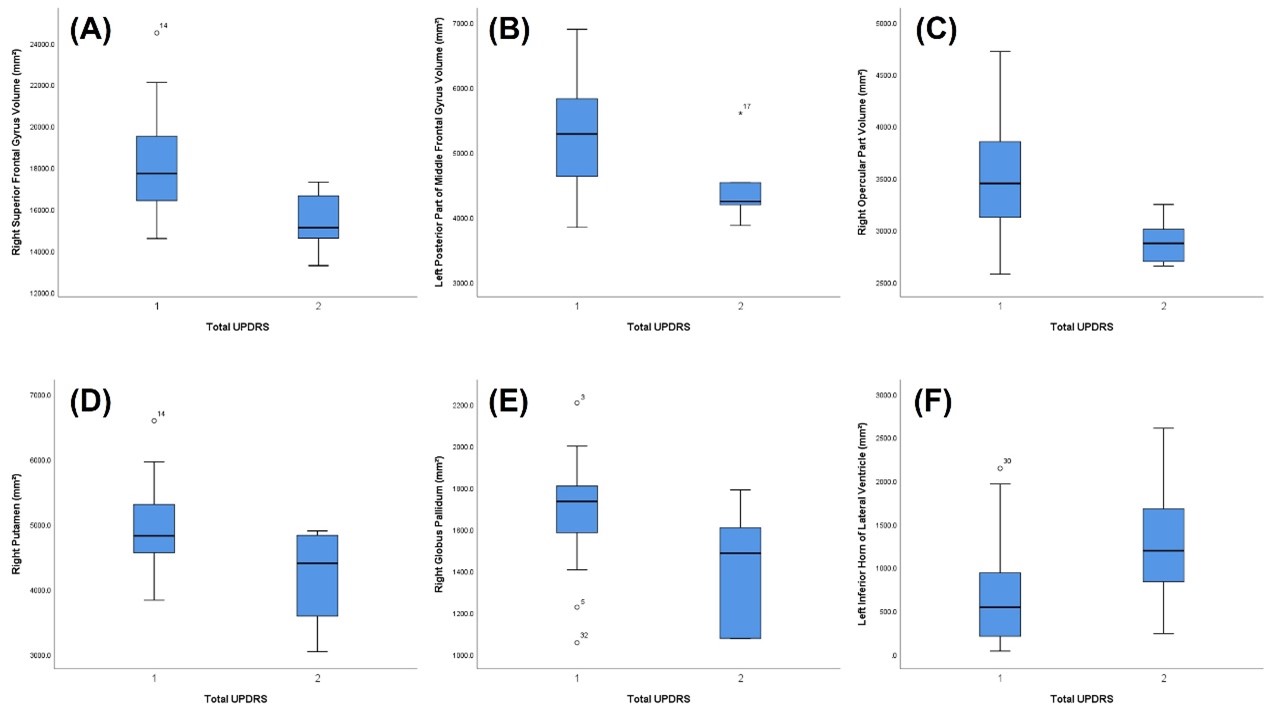
Figure 4 Boxplots of volumes of the right superior frontal gyrus (A), the left posterior part of middle frontal gyrus (B), the right operculum (C), the right putamen (D), the right globus pallidum (E), and the left inferior horn of lateral ventricle (F) in two sub-groups. Edges of the box show the first and the third quartiles with the middle line representing the median. Endbars demonstrate the minimum and the maximum score of the data. Mild outliers were noted by dots and extreme outliers were noted by asterisks.