3192
Application of the CT ABC/2 Method for Measuring Intracranial Bleed Volume on mcTFI QSM MRI.1Radiology, Beth Israel Deaconess Medical Center, Harvard Medical School, Boston, MA, United States, 2Atrius Health, Boston, MA, United States, 3Neurology, Beth Israel Deaconess Medical Center, Harvard Medical School, Boston, MA, United States, 4Department of Neurological Surgery, Cooper University Health Care, Cooper Medical School of Rowan University, Camden, NJ, United States, 5Neurosurgery, Beth Israel Deaconess Medical Center, Harvard Medical School, Boston, MA, United States, 6GE Healthcare, New York, NY, United States, 7Department of Radiology, Weill Cornell Medicine, New York, NY, United States
Synopsis
Keywords: Neurofluids, Brain, Intracranial Hemorrhage, ABC/2, Bleed Volume Estimation
Intracranial hemorrhage (ICH) volume estimation is important for patient management. ABC/2 is a validated method of volume estimation using CT (2). Differing appearance of blood across MRI imaging techniques and blood age limits the ability of MRI to evaluate ICH volume. The QSM technique mcTFI has features well suited to bleed measurement. In this study we show that the widely used ABC/2 CT technique for ICH volume measurement applied to mcTFI QSM MRI yields ICH volumes strongly correlated with those obtained using CT.INTRODUCTION:
Intracranial Hemorrhage (ICH) volume is an important predictor of patient outcome[1] making its measurement critical to patient management. The ABC/2 method is a well-established and widely used method for consistently measuring ICH volume using noncontrast head CT (NCT)[2]. For some patients, however, ICH may be present while evaluating for other etiologies, such as tumors or neurologic disorders, which are frequently done using MRI. Additionally, for research applications, obtaining CT imaging in addition to MRI may not be feasible. For such circumstances a validated MRI ICH volume measurement method comparable to ABC/2 would be of great use. Challenges to measuring ICH volume using standard MRI techniques include variable appearance of blood depending on age[3], and across MRI sequences (e.g. T1 vs T2 vs GRE[4]), and differences in size dependent on imaging technique (e.g. field strength, TE). Multiecho complex total field inversion (mcTFI) is a form of quantitative susceptibility mapping(QSM)[5], which has been shown to have good correlation with bleed age as depicted on CT [6], and, like other QSM methods, depicts a mapping of susceptibility, rather than technique related blooming artifact[7]. In this work we evaluate the accuracy of the ABC/2 method in measuring ICH volume using mcTFI QSM MRI relative to head CT.METHODS:
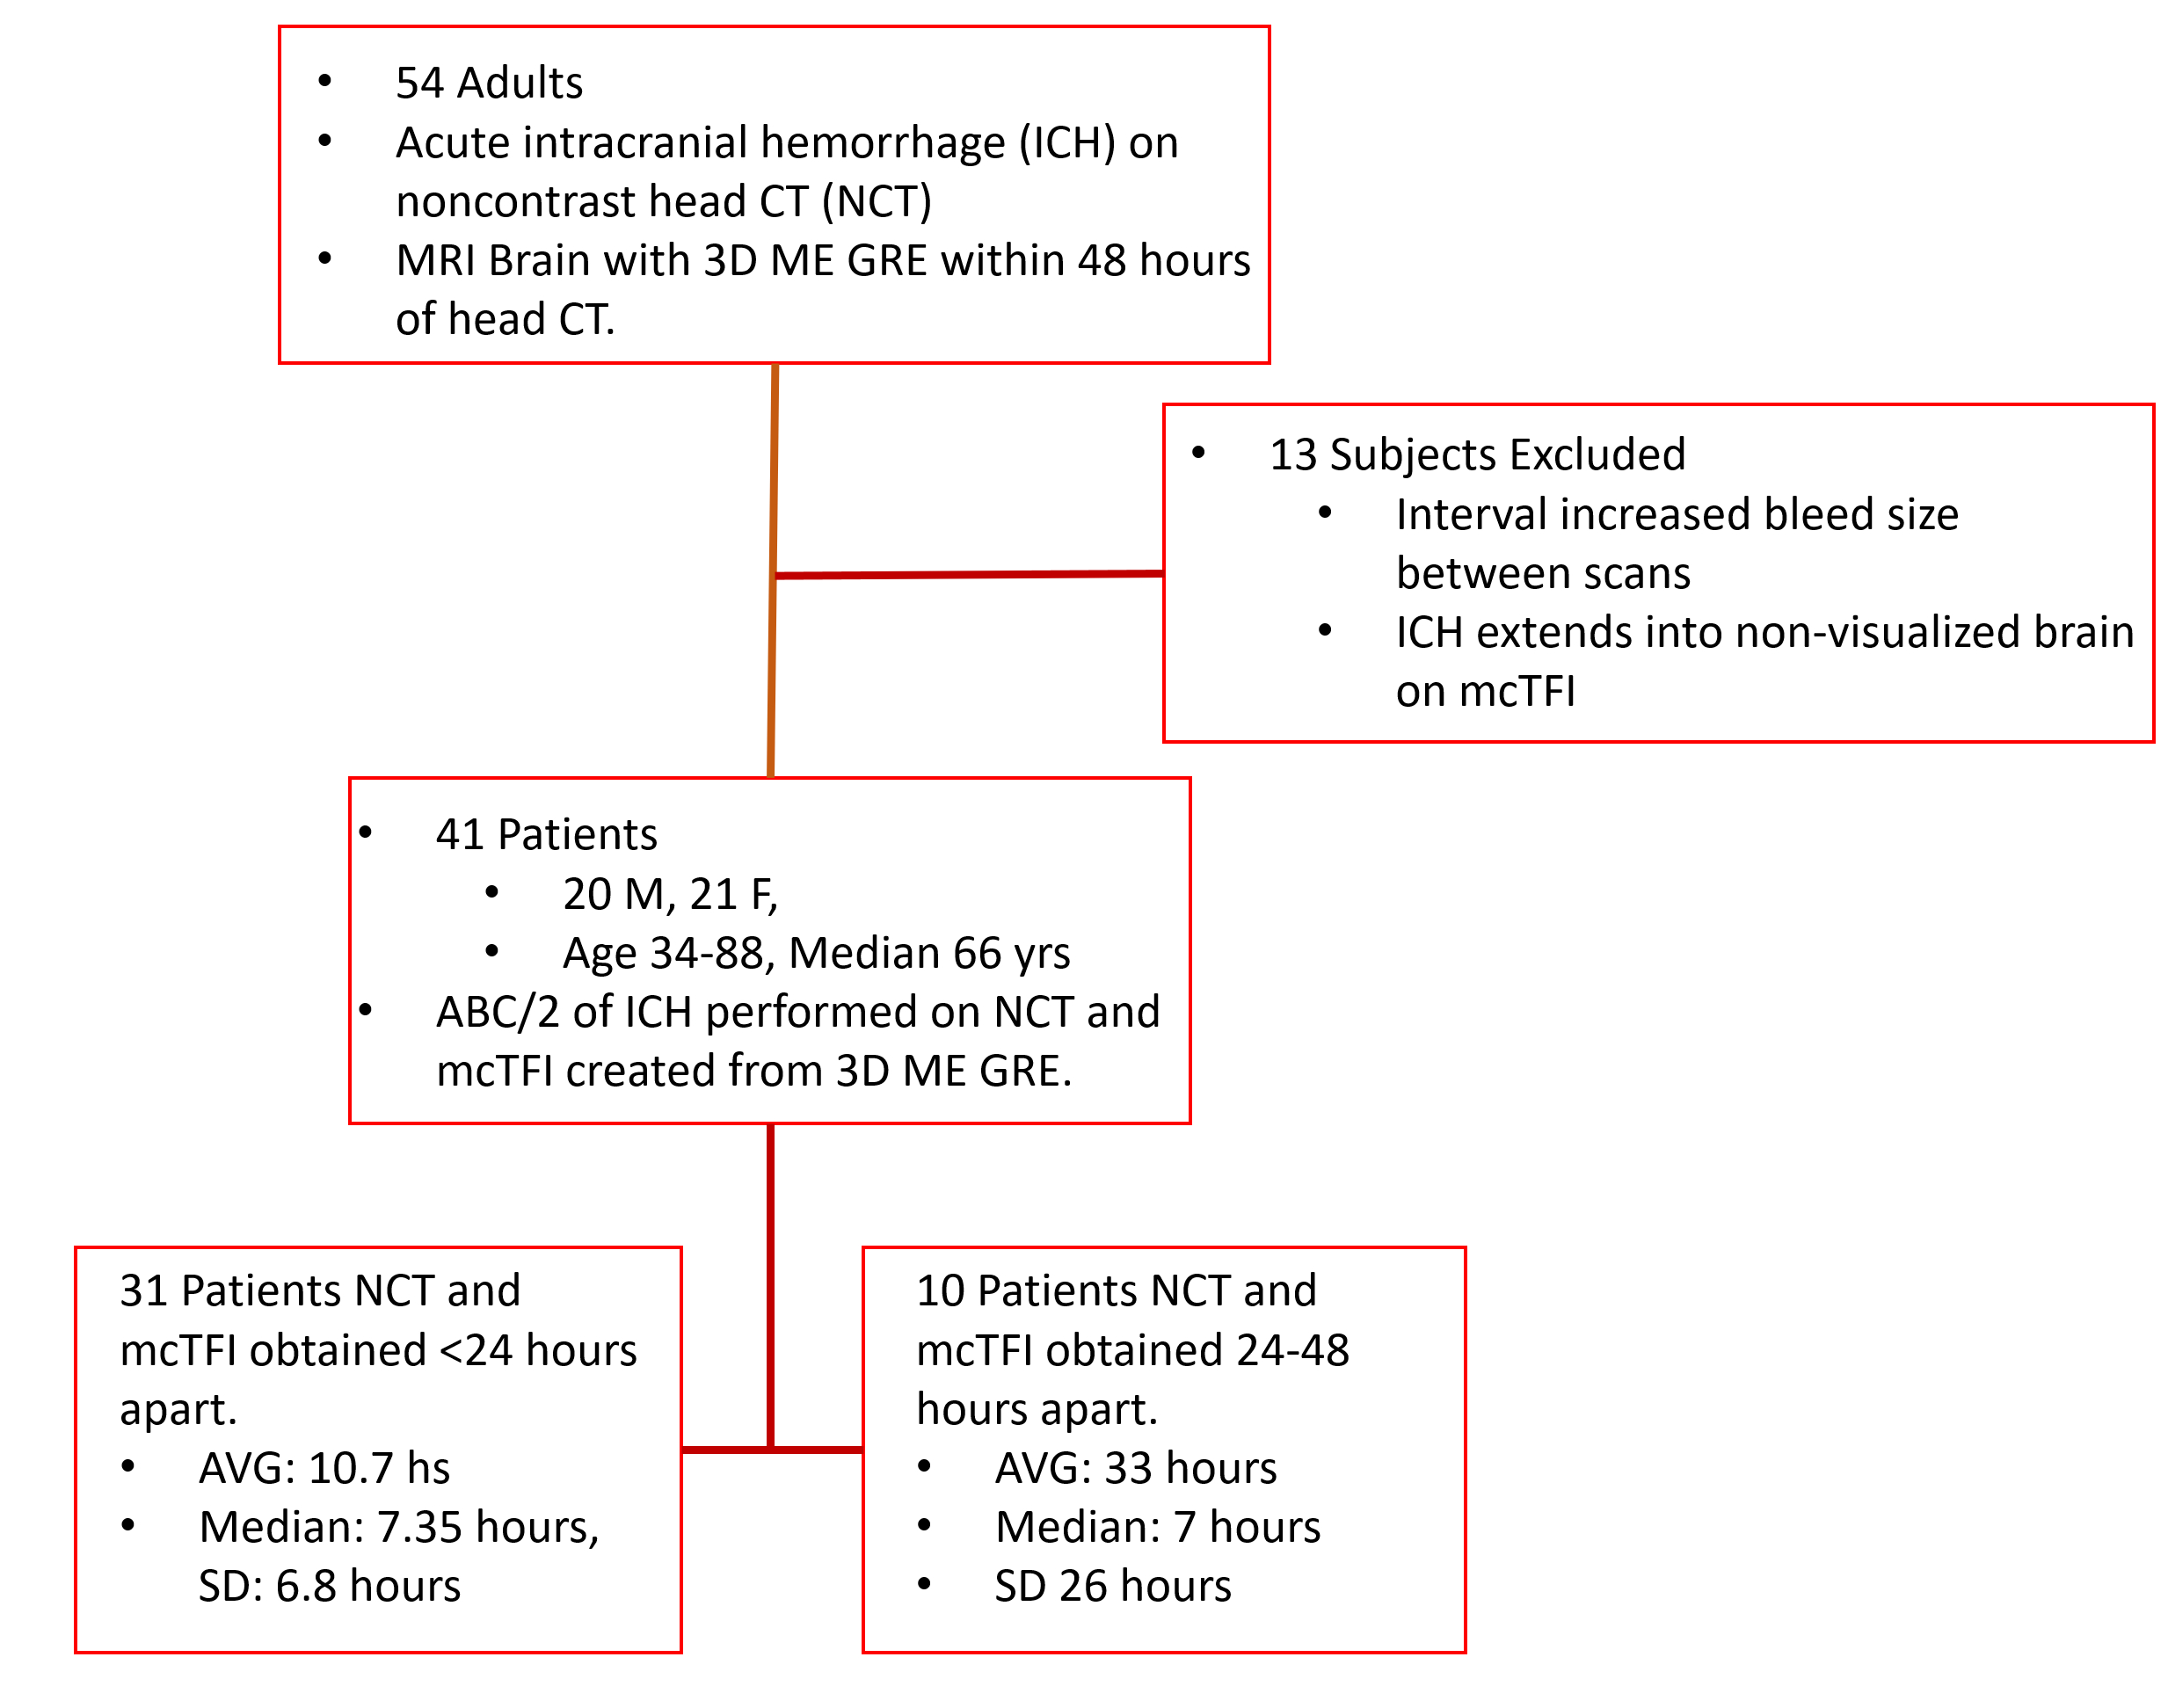
Under an IRB approved retrospective protocol, a convenience sample of 54 adult patients with acute to subacute ICH noted on NCT who underwent an MRI that included multiecho GRE (MEGRE) within 48 hours of CT were retrospectively reviewed. 13 cases were excluded due to portions of the ICH not included in the visualized brain on mcTFI images or due to evidence of hemorrhage progression between the CT and MRI scans. See Figure 1 for enrollment details. Noncontrast head CT scans were performed on GE Healthcare Revolution systems (Revolution, GE Healthcare, Waukesha, WI, USA) using protocols for whole brain coverage and 256 slice CT scanners (kV, 140; mA, [90–220]; slice thickness, 5 mm; slide number, [29–49]; slice median and mode, 33; FOV, 250 mm; reconstruction matrix, 512 512). The total acquisition time was approximately 1 minute. All MRI data was obtained on a single MR system (Discovery MR750; GE Healthcare) at 3.0 T using a 32-channel head coil. The MR protocol for this study included a three-dimensional T1-weighted magnetization-prepared rapid gradient echo (MPRAGE) axial scan (echo time, 7 msec; repetition time 3 msec; inversion time, 450 msec; bandwidth, 31.25 kHz; FOV, 240 mm; slice number, 300; voxel size, 0.9 0.9 0.5 mm3; flip angle, 12; acquisition matrix, 240 240; reconstruction matrix, 256 256; parallel imaging, 3; total scan time, 2 minutes 49 sec) and a multiecho axial GRE sequence (first echo time, 3.648 msec; echo spacing, 3.984 msec; 11 echoes; repetition time, 47.424 msec; bandwidth, 62.5 kHz; voxel size, 0.5 0.5 1 mm3; flip angle, 12; acquisition matrix, 256 256; reconstruction matrix, 512 512; total scan time, 4 minutes 30 seconds). MEGRE data was processed using the mcTFI method[5]. A neuroradiologist with certificate of added qualification in neuroradiology and10 years of experience, along with a nonphysician research assistant trained in application of ABC/2 technique, performed ABC/2 measurements on all mcTFI and CT images to generate a consensus read. Bland-Altman, linear regression and paired t-test analyses were performed.RESULTS:
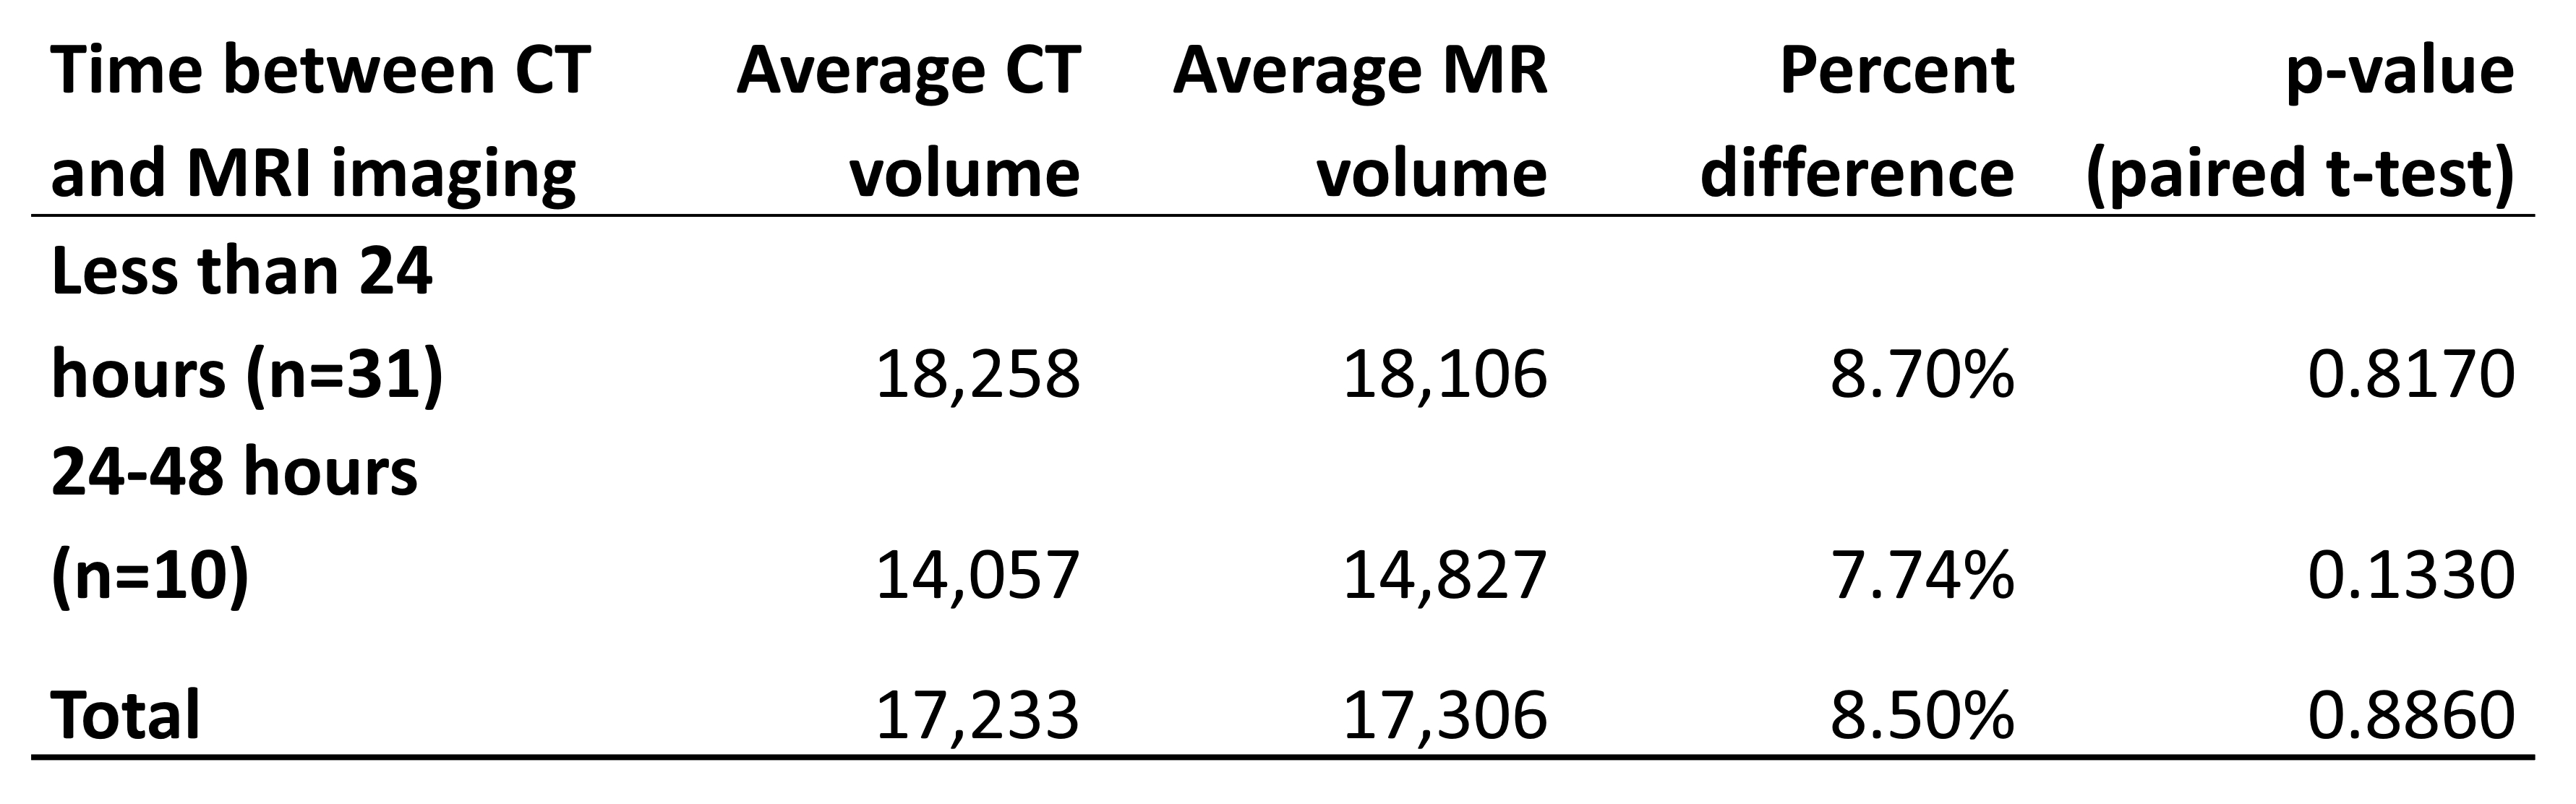
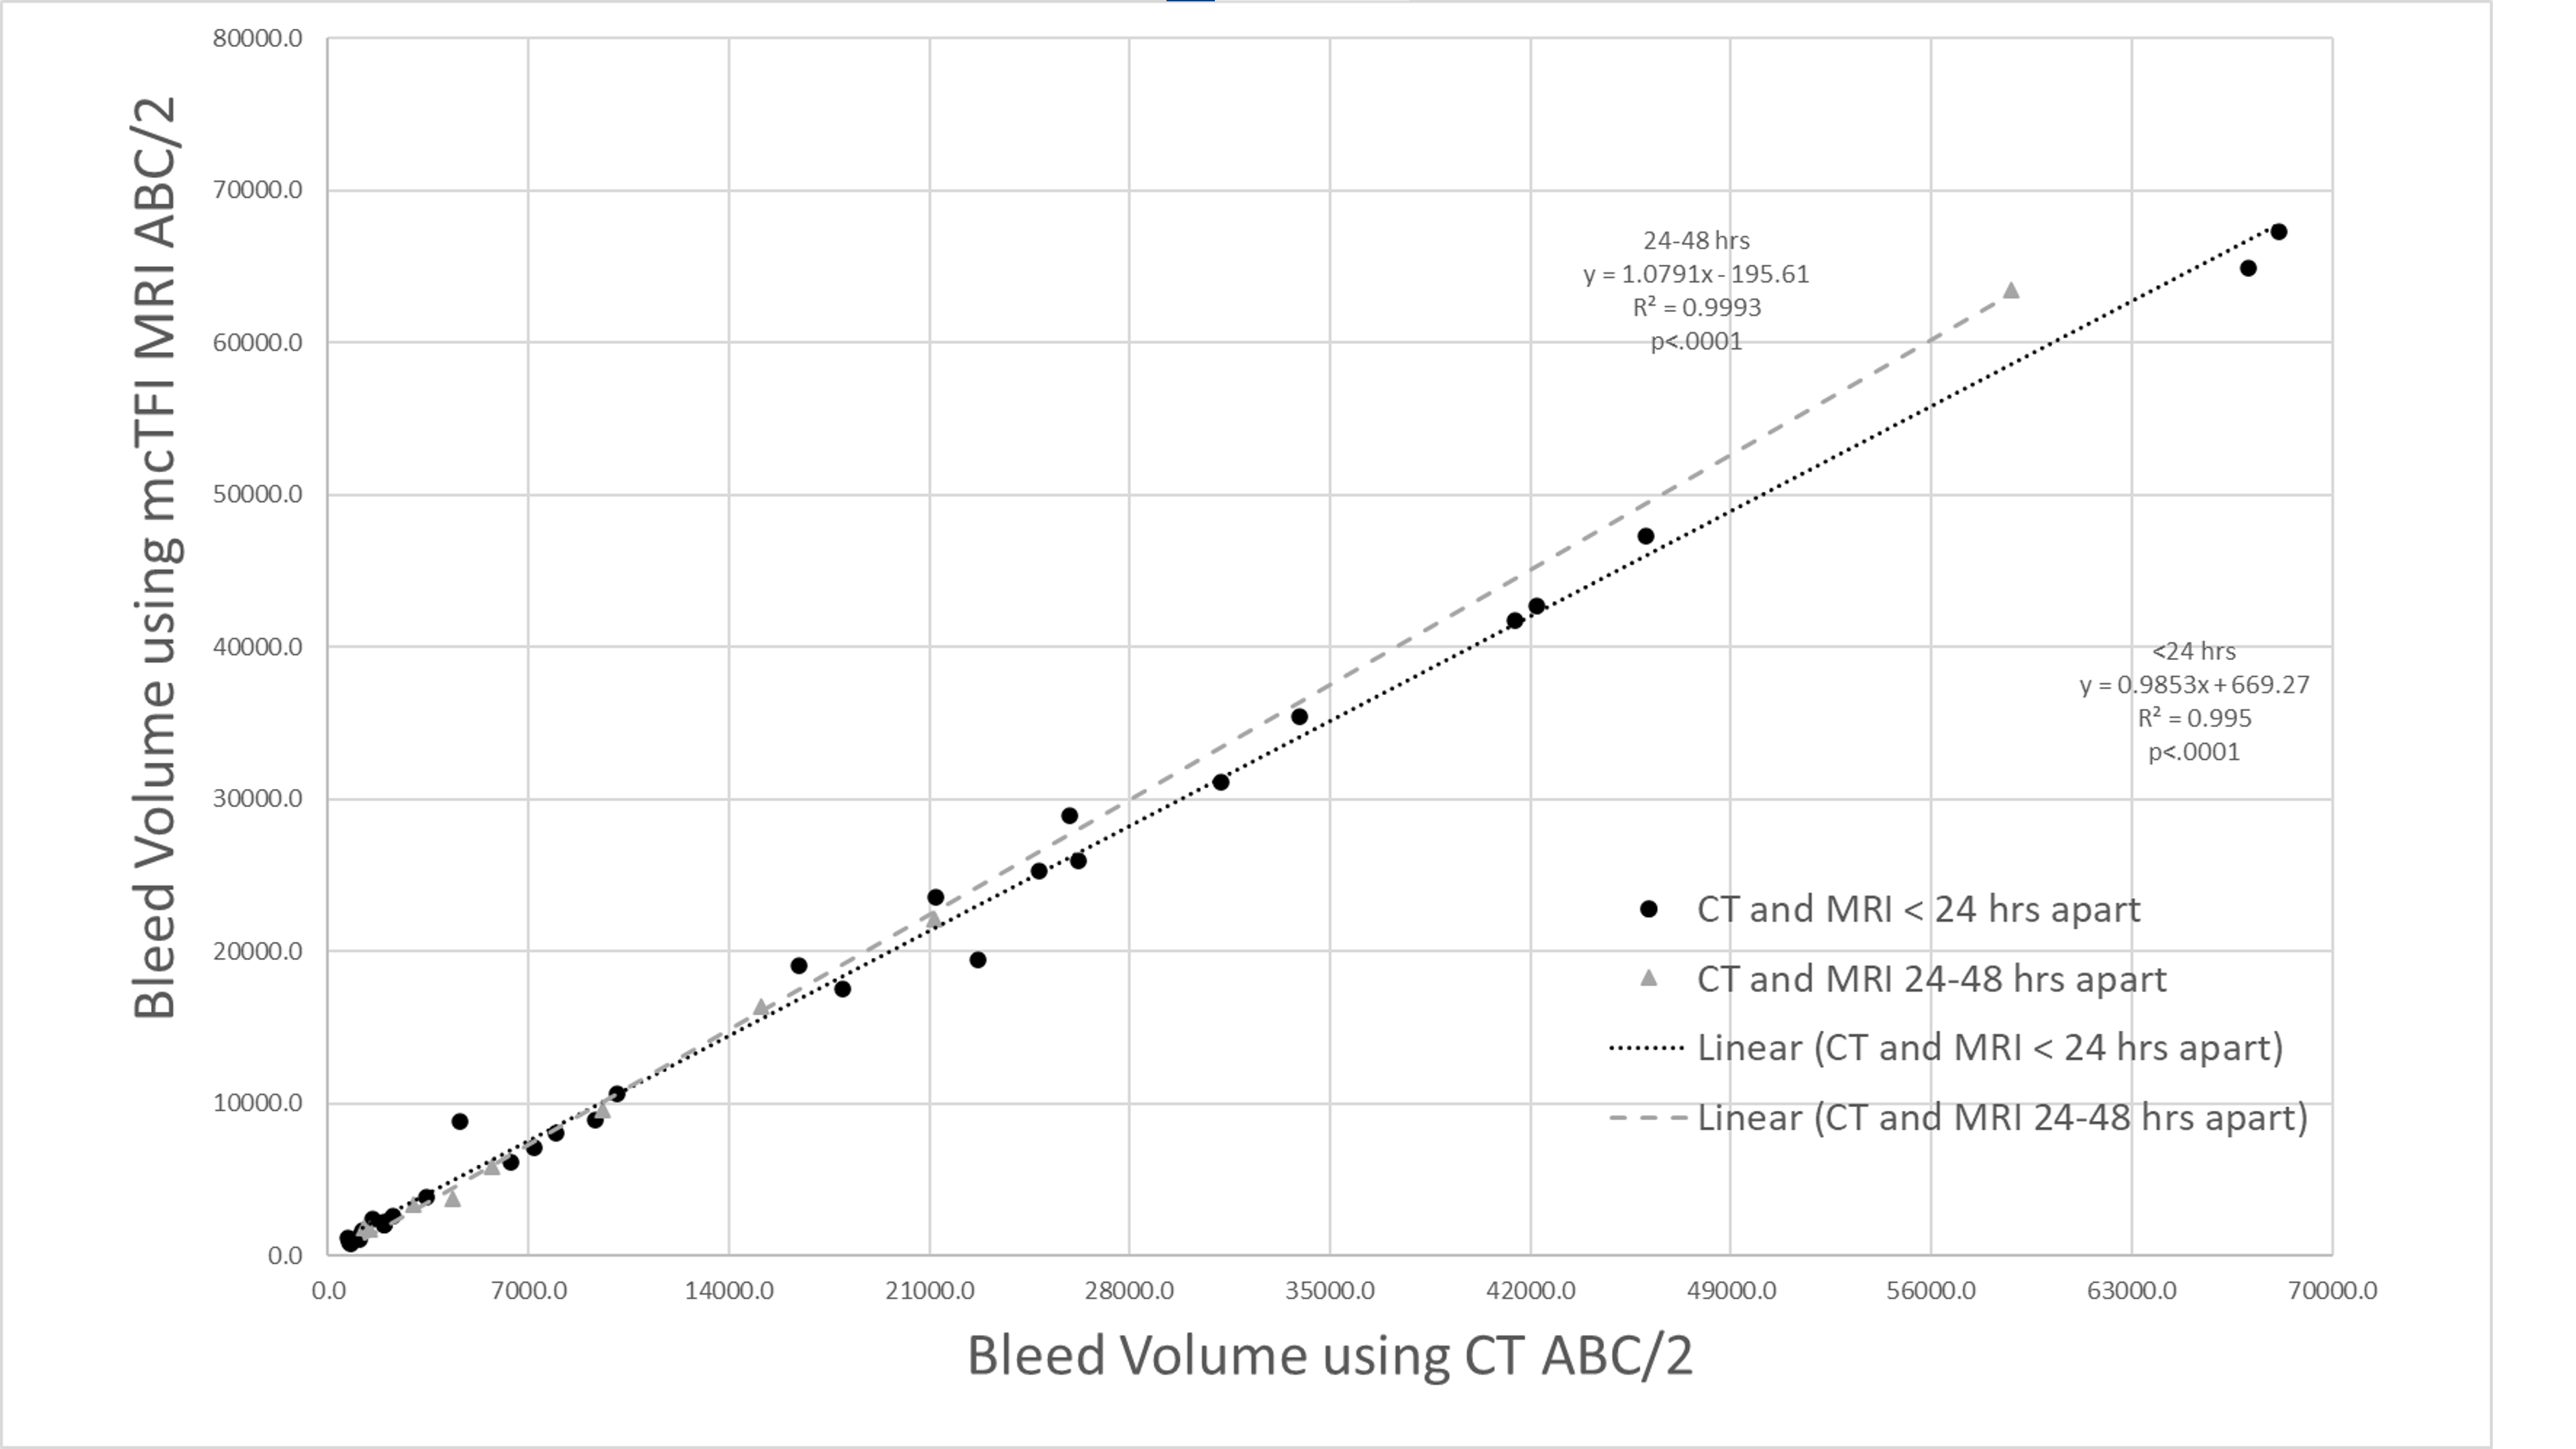
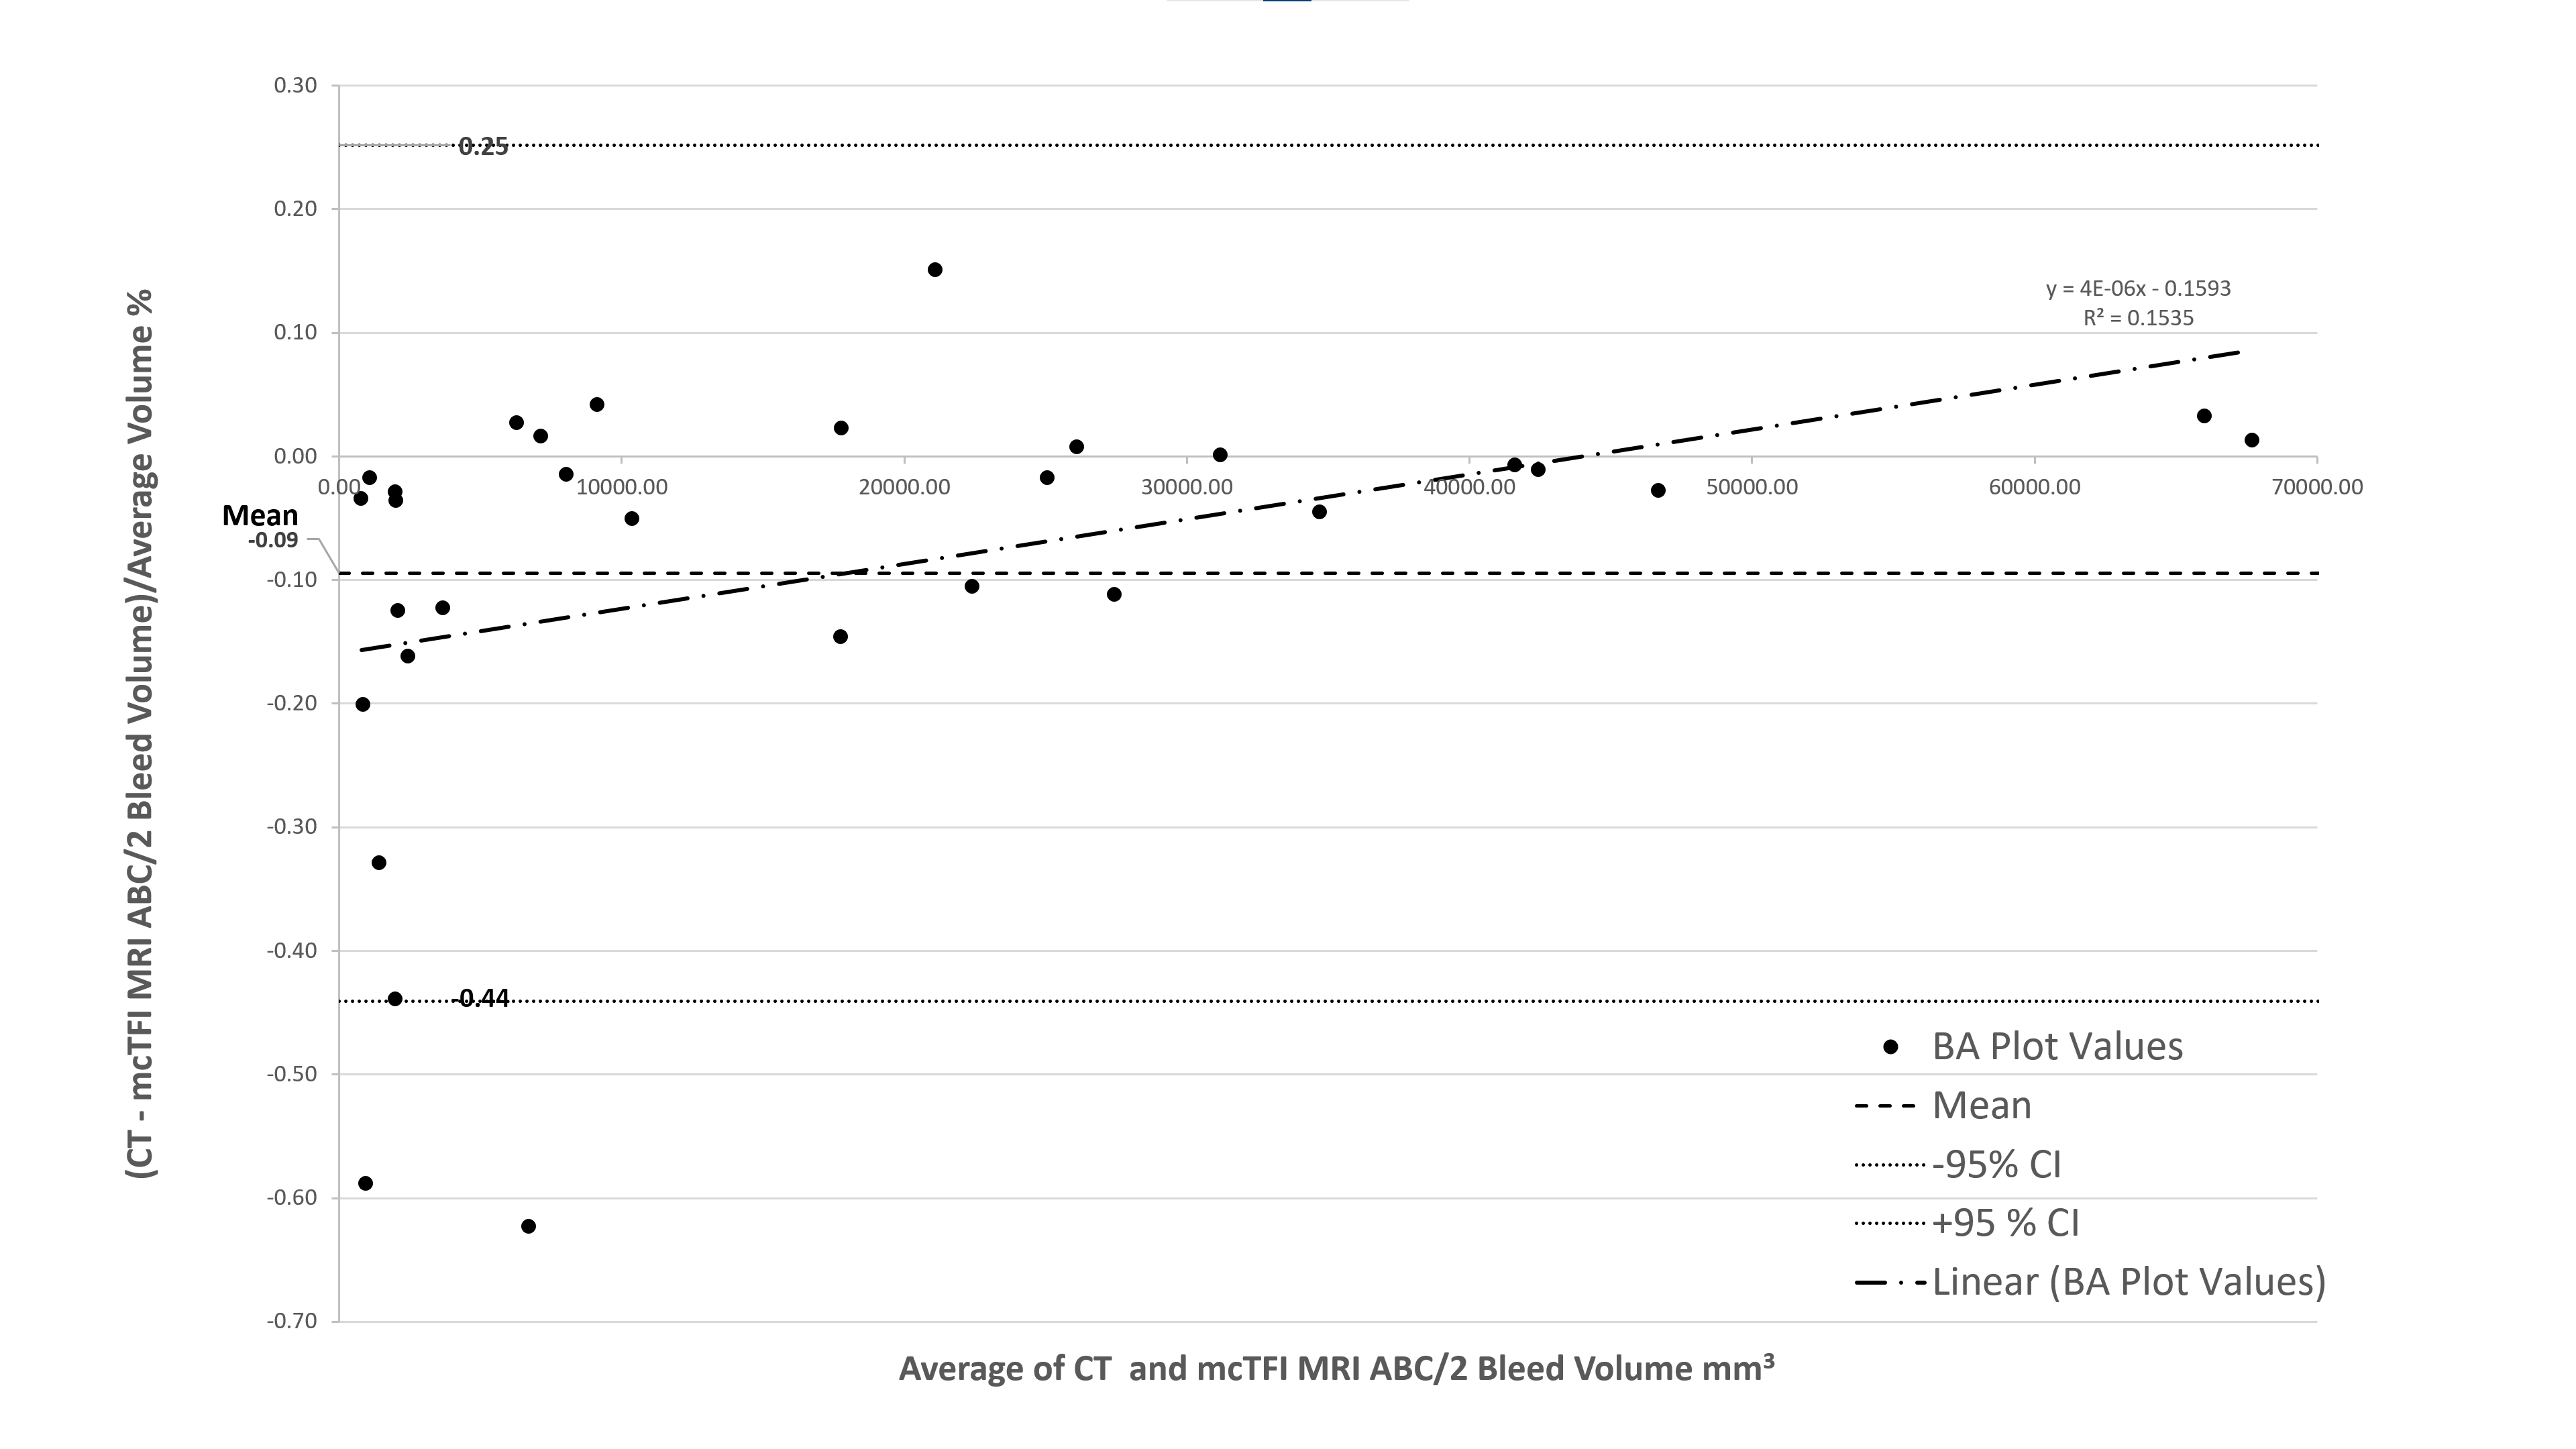
No significant difference was noted in between CT and mcTFI ABC/2 volume measurements for all subjects (see Figure 3). Linear regression demonstrated a strong correlation between CT and mcTFI ABC/2 measurements (see figure 4). See figure 5 for Bland-Altman analysis results.DISCUSSION AND CONCLUSIONS:
Our study found strong correlation between CT and MRI ABC/2 volume using mcTFI QSM, with no significant difference in volumes (Figure 4). We found a small bias of -0.09 percent of volume measured toward ABC/2 volume measured by MRI, with the difference decreasing towards 0 for larger volumes (Figure 5). These results suggest that mcTFI may be able to guide patient care in the absence of CT imaging. With mcTFI’s better ability to distinguish blood from calcification relative to SWI[8], and correlate with bleed age[6], this technique can not only assist in ICH volume monitoring, but patient management, when the presence of age indeterminate blood incidentally noted on MRI may interfere with patient anticoagulation or anti-amyloid therapy. As the evaluation of mcTFI’s ability to depict ABC/2 measurements depends on the imaging of stable hemorrhage between CT and MRI acquisition, some variation in hemorrhage volume between methods may be due to subtle changes in hemorrhage size between scan sessions. The volume of ICH calculated using ABC/2 in MRI reconstructed using mcTFI QSM and CT were highly correlated when the exams were less than 24 hours apart, with no significant difference for instances where the CT and MRI were greater than 24 hours apart. A limitation of the mcTFI technique is known non-visualized brain that can occur, especially at bone - brain interfaces. mcTFI QSM is a promising MRI technique for obtaining ABC/2 for measurement of bleed volume for clinical and research applications.Acknowledgements
No acknowledgement found.References
[1] Kothari RU, Brott T, Broderick JP, Barsan WG, Sauerbeck LR, Zuccarello M, et al. The ABCs of measuring intracerebral hemorrhage volumes. Stroke 1996;27(8):1304-5.
[2] Kleinman JT, Hillis AE, Jordan LC. ABC/2: estimating intracerebral haemorrhage volume and total brain volume, and predicting outcome in children. Dev Med Child Neurol 2011;53(3):281-4.
[3] Wang D, Strugnell W, Cowin G, Doddrell DM, Slaughter R. Geometric distortion in clinical MRI systems Part I: evaluation using a 3D phantom. Magn Reson Imaging 2004;22(9):1211-21.
[4] Wen Y, Spincemaille P, Nguyen T, Cho J, Kovanlikaya I, Anderson J, et al. Multiecho complex total field inversion method (mcTFI) for improved signal modeling in quantitative susceptibility mapping. Magn Reson Med 2021.
[5] Champagne AA, Wen Y, Selim M, Filippidis A, Thomas AJ, Spincemaille P, et al. Quantitative Susceptibility Mapping for Staging Acute Cerebral Hemorrhages: Comparing the Conventional and Multiecho Complex Total Field Inversion magnetic resonance imaging MR Methods. J Magn Reson Imaging 2021;54(6):1843-54.
[6] Nandigam RN, Viswanathan A, Delgado P, Skehan ME, Smith EE, Rosand J, et al. MR imaging detection of cerebral microbleeds: effect of susceptibility-weighted imaging, section thickness, and field strength. AJNR Am J Neuroradiol 2009;30(2):338-43.
Figures