3191
Assessing CSF secretion by measuring net velocity of CSF in the human subarachnoid space using displacement encoding with stimulated echoes at 7T.1Department of Radiology, University Medical Center Utrecht, Utrecht, Netherlands
Synopsis
Keywords: Neurofluids, Velocity & Flow
Continuous secretion and absorption of cerebrospinal fluid (CSF) cause a net velocity that is important for cerebral clearance. However, measuring this net velocity is hampered by the cardiac and respiratory cycle which induce additional CSF motions. We show, with both simulations and in vivo measurements, that net velocity of CSF in the subarachnoid space can be measured using displacement encoding with stimulated echoes (DENSE), when contributions from heartbeat and respiration are accounted for during the analysis. Measured net velocity was 4.41±1.57 µm/s (6 subjects). Further research is needed to properly account for possible phase wraps in the measurements.Introduction
The brain clears waste products via cerebrospinal fluid (CSF). The continuous secretion of CSF induces a net velocity which, in the subarachnoid space, can be estimated to be approximately 5 μm/s based on a simplistic model in which the intracranial volume is a sphere of 1.5 L, CSF volume is 150 mL (contained in a 3 mm thick outer shell) and CSF production is 0.35 mL/min. The measurements of such very slow velocities are hampered by the presence of relatively large cardiac and respiration related motions,1-3 which do not contribute to a net displacement over time. Measuring CSF net velocity is crucial to quantify and study clearance. The goal of this study is to test feasibility of measuring CSF net velocity due to the continuous secretion of CSF with MRI, whilst simultaneously accounting for cardiac and respiration induced motion.Methods
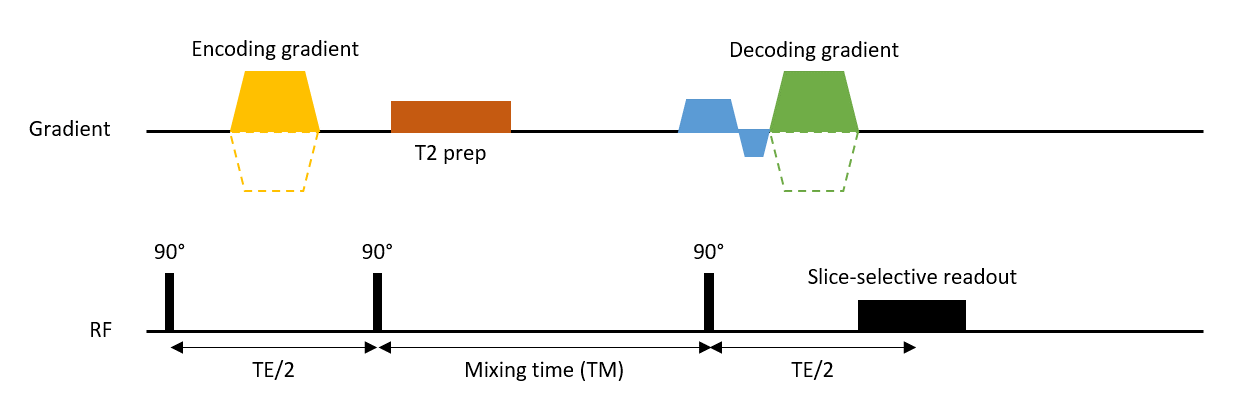
Acquisition: A multi-slice Displacement Encoding with Stimulated Echoes (DENSE) sequence1,4 was used in combination with T2 preparation pulses (TE T2prep = 250 ms) to selectively image CSF. A range of mixing times (TM) between 500-1400 ms (step size: 100 ms) was used to ensure different contributions of CSF net displacement to the total measured displacement in order to distinguish net displacement from periodic motion (Figure 1).Data was acquired in eight healthy volunteers at 7T MRI (Philips Healthcare) with a 32ch head coil (Nova Medical), after obtaining informed consent, according to the research protocol approved by our local Ethics Review Board. Imaging parameters were as follows: 60 slices divided over 2 packages with each a TR of 6 seconds, a sagittal FOV of 250x250 mm2, multiband factor of 3, 3 mm isotropic single shot EPI readouts, SENSE 2.5 and a DENC of 125 µm in the feet-head (FH) direction. Each slice was measured 60 times with slice permutations to ensure every slice was acquired with different TM. Total scan duration was 12 minutes. No cardiac triggering or respiratory gating was used. This way all measurements had arbitrary temporal positions throughout both the cardiac and respiratory cycle. Physiological data was recorded using pulse oximeter (PPU) or vectorcardiogram (VCG) and a respiration belt.
Analysis: Data was corrected for a static gradient and rigid motion (in-plane translation and rotation) prior to voxel wise fitting using in-house developed scripts in Matlab. The measured phase, $$$\varphi $$$, is modelled as a linear combination of the static phase offset ($$$\varphi_0$$$), cardiac ($$$\varphi_c$$$) and respiratory ($$$\varphi_r$$$) motion and the net velocity ($$$\dot \varphi$$$):
$$\varphi = \varphi_0 + \sum_{i=1}^n x_{c,i}\varphi_{c,i} + \sum_{j=1}^m x_{r,j}\varphi_{r,j} + \dot \varphi_{net} TM$$
Where $$$n$$$ and $$$m$$$ are the number of cardiac and respiratory bins, respectively. A total of 10 bins was used for each. Coefficients $$$x_c$$$ and $$$x_r$$$ represent the relative weightings of the cardiac and respiratory bins based on the temporal position of the measurement with respect to the physiological data. No assumptions on the waveform of the cardiac/respiration contributions were made. The different components were estimated using a voxel-wise least squares optimization. Displacements were derived from the phase using the encoding sensitivity (DENC):
$$d = \frac{DENC}{\pi} \varphi, \space \space \space v = \frac{DENC}{\pi}\dot \varphi$$
Our method was validated by Monte-Carlo simulations of the sequence, using pre-defined cardiac and respiratory cycles with durations of 1000±100 ms and 4000±1200 ms and amplitudes of 50 µm and 150 µm, respectively. The net velocity was 5 μm/s, DENC of 125 µm and 250 µm, and SNR of 15.
Results
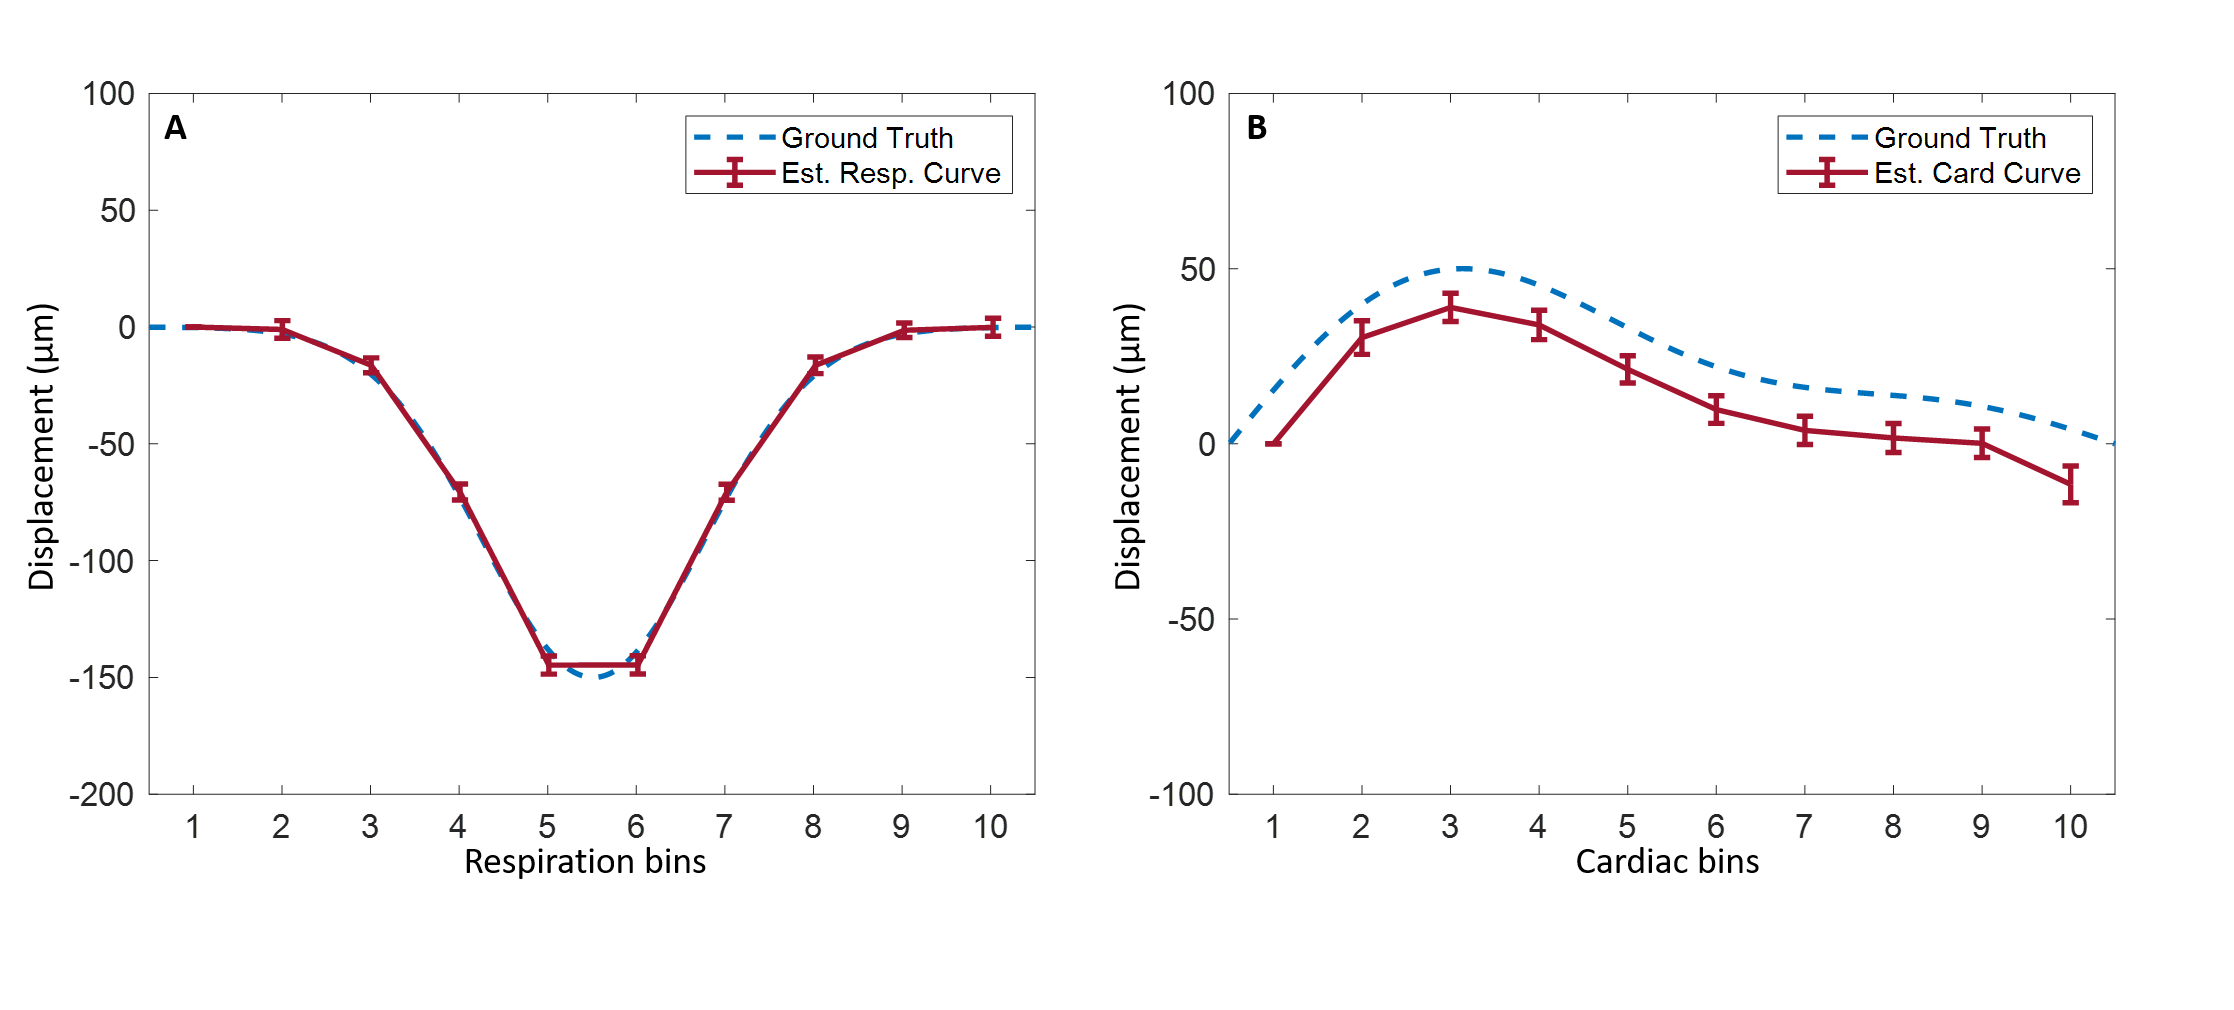
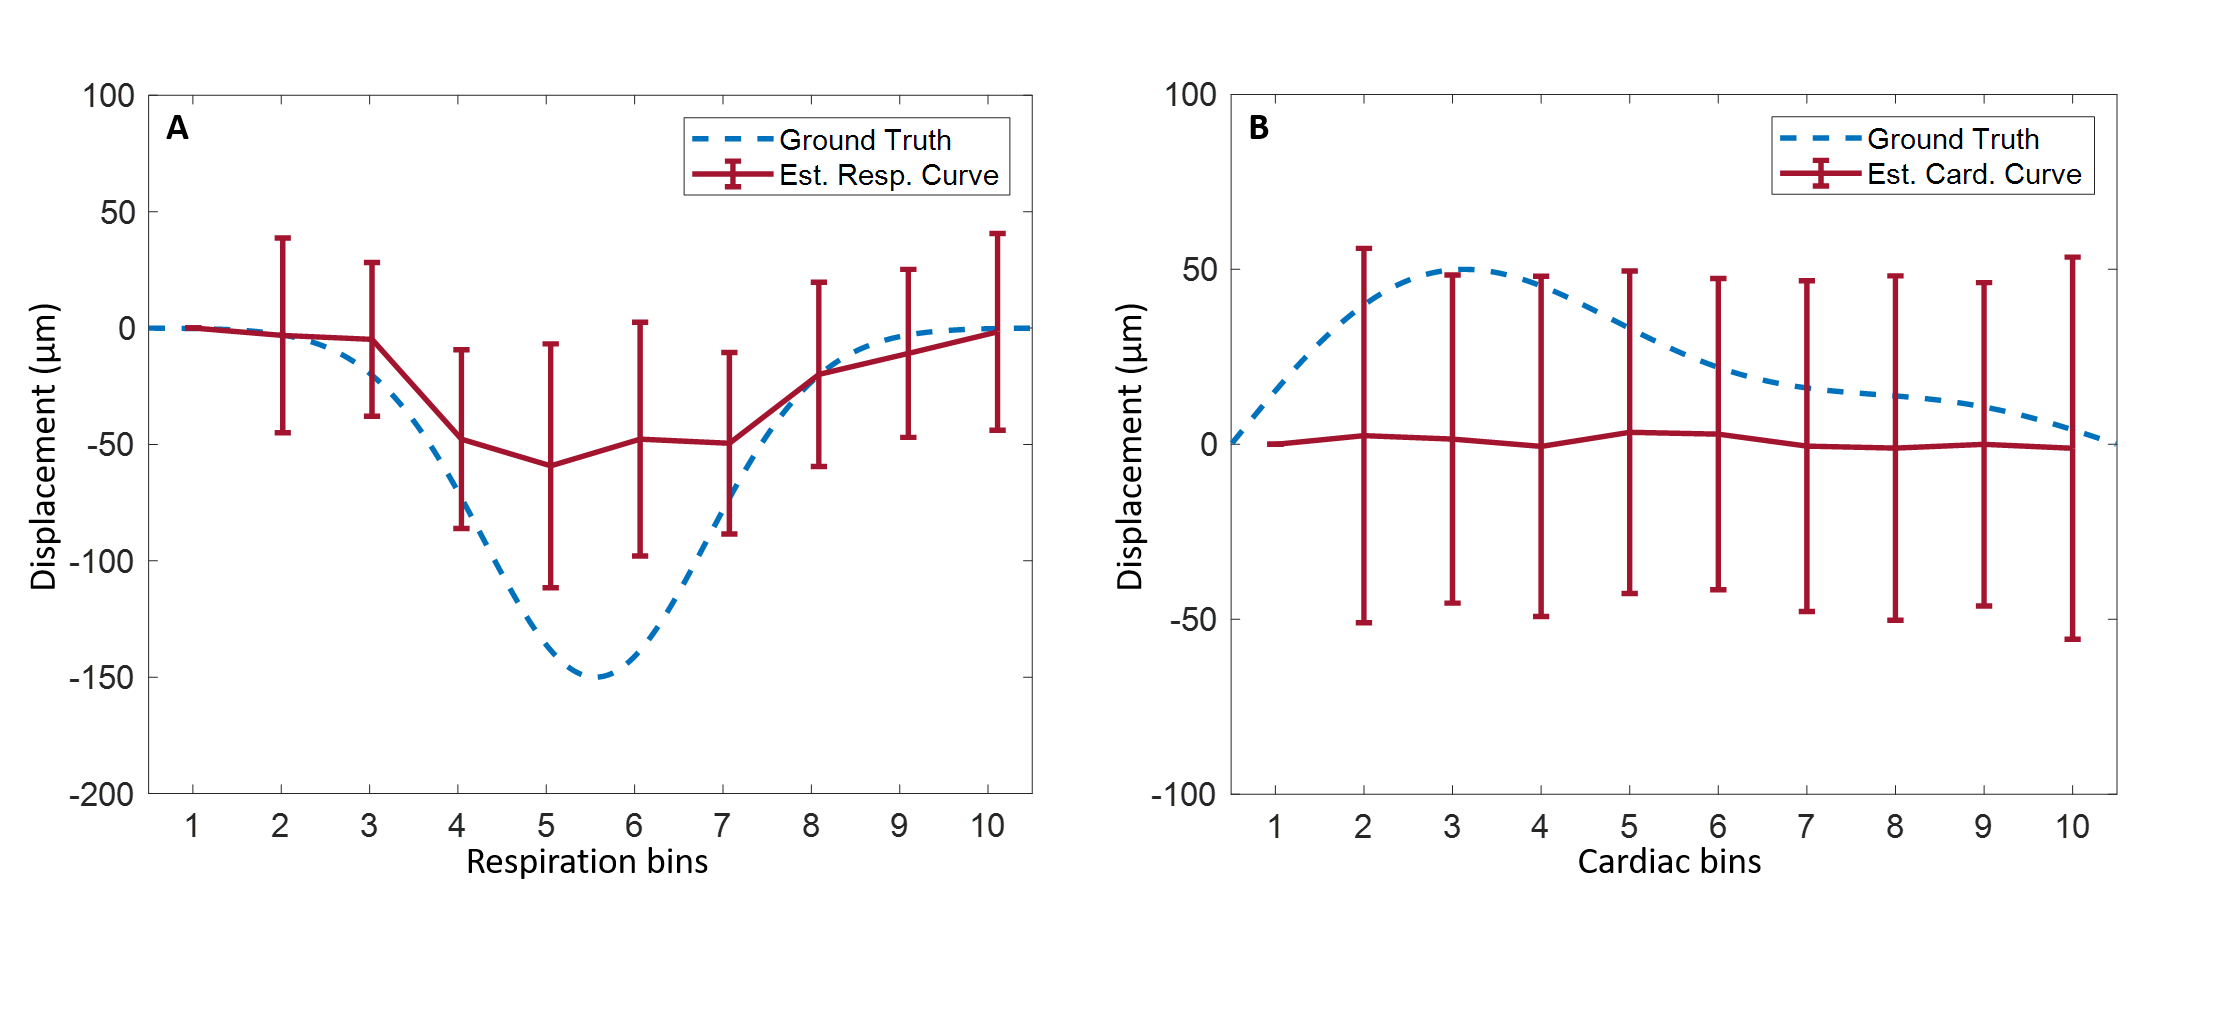
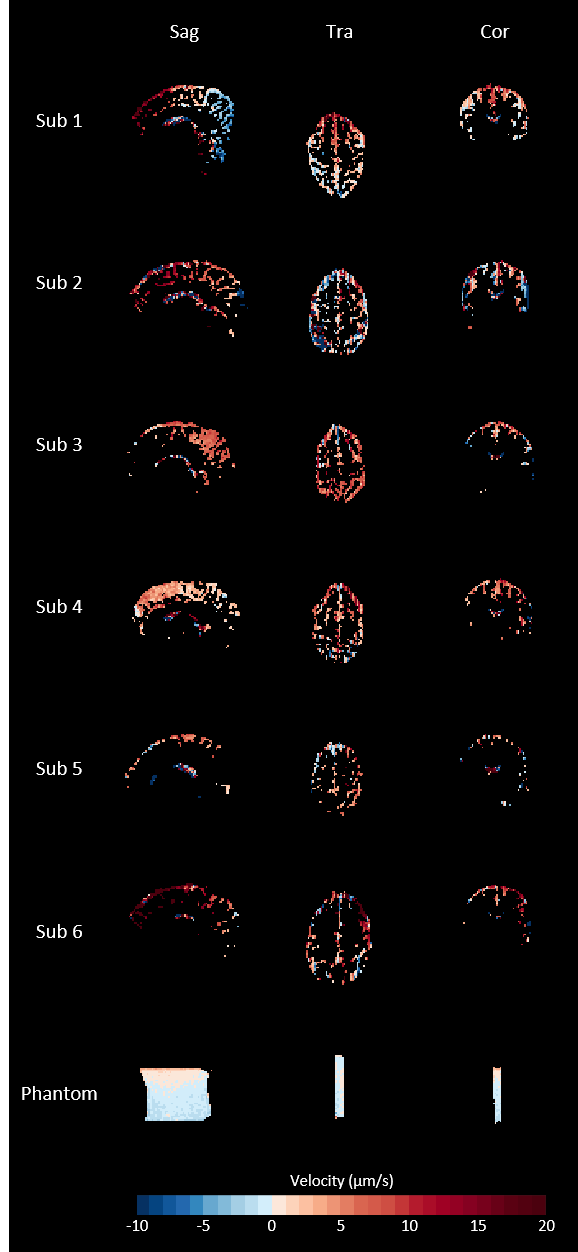
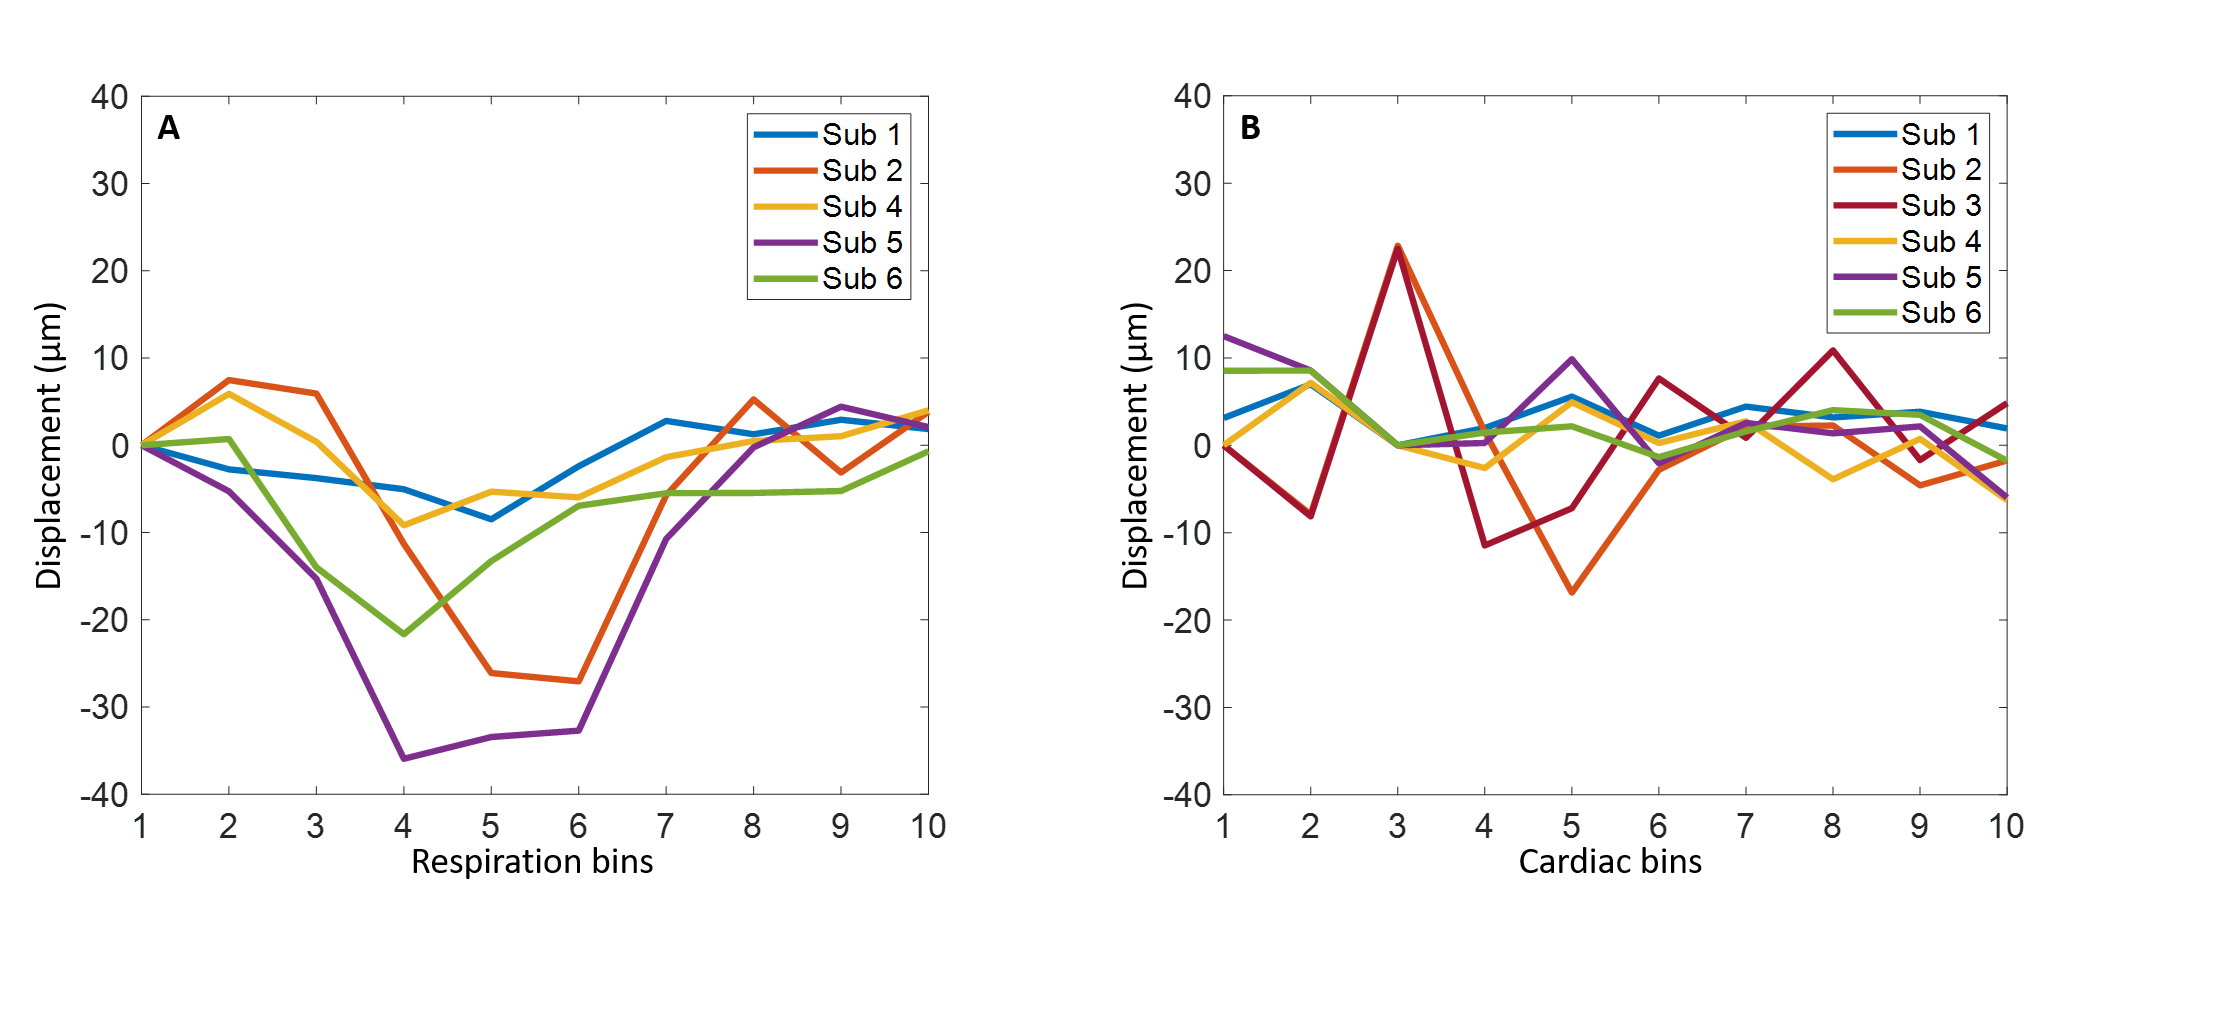
Data of two volunteers were discarded because of severe motion and incorrect PPU data. Figure 2 shows simulation results when a DENC of 250 µm was used, for which no phase wraps occur. The estimated net velocity was 5.0±0.50 µm/s. Both respiratory and cardiac motion were estimated accurately. Figure 3 shows similar results using a DENC of 125 µm for which on average 3.37±2.0 phase wraps occurred during a simulated acquisition. Estimated net velocity was -0.19±8.34 µm/s. Respiratory motion was underestimated but had correct waveform. Cardiac motion, however, was incorrect in this case. Figure 4 shows the results of in vivo measurements of CSF net velocity for all subjects and a static gel phantom. Most subjects showed a positive net velocity indicating cranial displacement of CSF of 4.41±1.57 µm/s. The phantom had a net velocity of -0.20±0.91 µm/s. The motion of CSF over the cardiac and respiratory cycle are shown in Figure 5. Motion of CSF due to respiration follows the same caudal pattern for most subjects. The cardiac motion does not show a consistent pattern among the subjects.Conclusion & Discussion
Preliminary in vivo results as well as simulations show the feasibility of measuring CSF net velocities due to continuous secretion. These measurements could provide insight into the quality of clearance in both health and disease. Simulations suggest that phase wraps might lead to incorrect estimation of cardiac motion whereas respiratory motion is underestimated but remains correct form which, might explain in vivo findings. The simulations suggest that the net velocity can be incorrect and underestimated as well in the presence of phase wraps. Further research is needed to avoid or properly deal with phase wraps to improve the estimations. Furthermore, findings must be validated using a calibrated flow phantom.Acknowledgements
No acknowledgement found.References
1. Spijkerman, J. M., Geurts, L. J., Siero, J. C., Hendrikse, J., Luijten, P. R., & Zwanenburg, J. J. (2019). Phase contrast MRI measurements of net cerebrospinal fluid flow through the cerebral aqueduct are confounded by respiration. Journal of Magnetic Resonance Imaging, 49(2), 433-444.
2. Yildiz, S., Thyagaraj, S., Jin, N., Zhong, X., Heidari Pahlavian, S., Martin, B. A., ... & Sabra, K. G. (2017). Quantifying the influence of respiration and cardiac pulsations on cerebrospinal fluid dynamics using real‐time phase‐contrast MRI. Journal of Magnetic Resonance Imaging, 46(2), 431-439.
3. Töger, J., Andersen, M., Haglund, O., Kylkilahti, T. M., Lundgaard, I., & Bloch, K. M. (2022). Real-time imaging of respiratory effects on cerebrospinal fluid flow in small diameter passageways. Magnetic Resonance in Medicine.
4. Sloots, J. J., Biessels, G. J., De Luca, A., & Zwanenburg, J. J. (2021). Strain Tensor Imaging: Cardiac-induced brain tissue deformation in humans quantified with high-field MRI. NeuroImage, 236, 118078.
Figures