3190
Intracranial Hemorrhage Patient CSF Susceptibility Variation: Implications for Quantitative Susceptibility Mapping Reference Selection.1Radiology, Beth Israel Deaconess Medical Center, Harvard Medical School, Boston, MA, United States, 2Department of Radiology, Weill Cornell Medicine, New York, NY, United States, 3Neurology, Beth Israel Deaconess Medical Center, Harvard Medical School, Boston, MA, United States, 4Department of Neurological Surgery, Cooper University Health Care, Cooper Medical School of Rowan University, Camden, NJ, United States, 5Neurosurgery, Beth Israel Deaconess Medical Center, Harvard Medical School, Boston, MA, United States, 6GE Healthcare, New York, NY, United States
Synopsis
Keywords: Neurofluids, Quantitative Susceptibility mapping, CSF Blood
QSM is an emerging MR technique with many clinical applications, especially in the brain. CSF has been used by many researchers as the reference region to obtain quantitative QSM values for inter-subject comparison. Here, we demonstrate the QSM values at hemorrhagic CSF sites are significantly different from that at non-hemorrhagic CSF sites in the same patient with various types of intracranial hemorrhage. This finding has significant clinical implication as selection of CSF as the reference region should be made with caution in patients with intracranial hemorrhage.INTRODUCTION:
Detecting intracranial hemorrhage is critical in numerous clinical settings, including stroke, traumatic brain injury, and brain tumors. Quantitative susceptibility mapping (QSM) is an emerging technique with excellent sensitivity to microhemorrhage while having high specificity to magnetic susceptibility sources1. To quantify magnetic susceptibility, QSM technique requires the selection of a reliable reference region2. A commonly used reference is cerebrospinal fluid (CSF) within the lateral ventricles3. However, the QSM values resulting from blood mixing with CSF, as often occurs with intracranial hemorrhage patients, is not well documented. We hypothesize that areas of visibly hemorrhagic CSF will differ significantly from non-hemorrhagic CSF, introducing variations in CSF values that could limit inter and intrasubject QSM value comparison.METHODS:
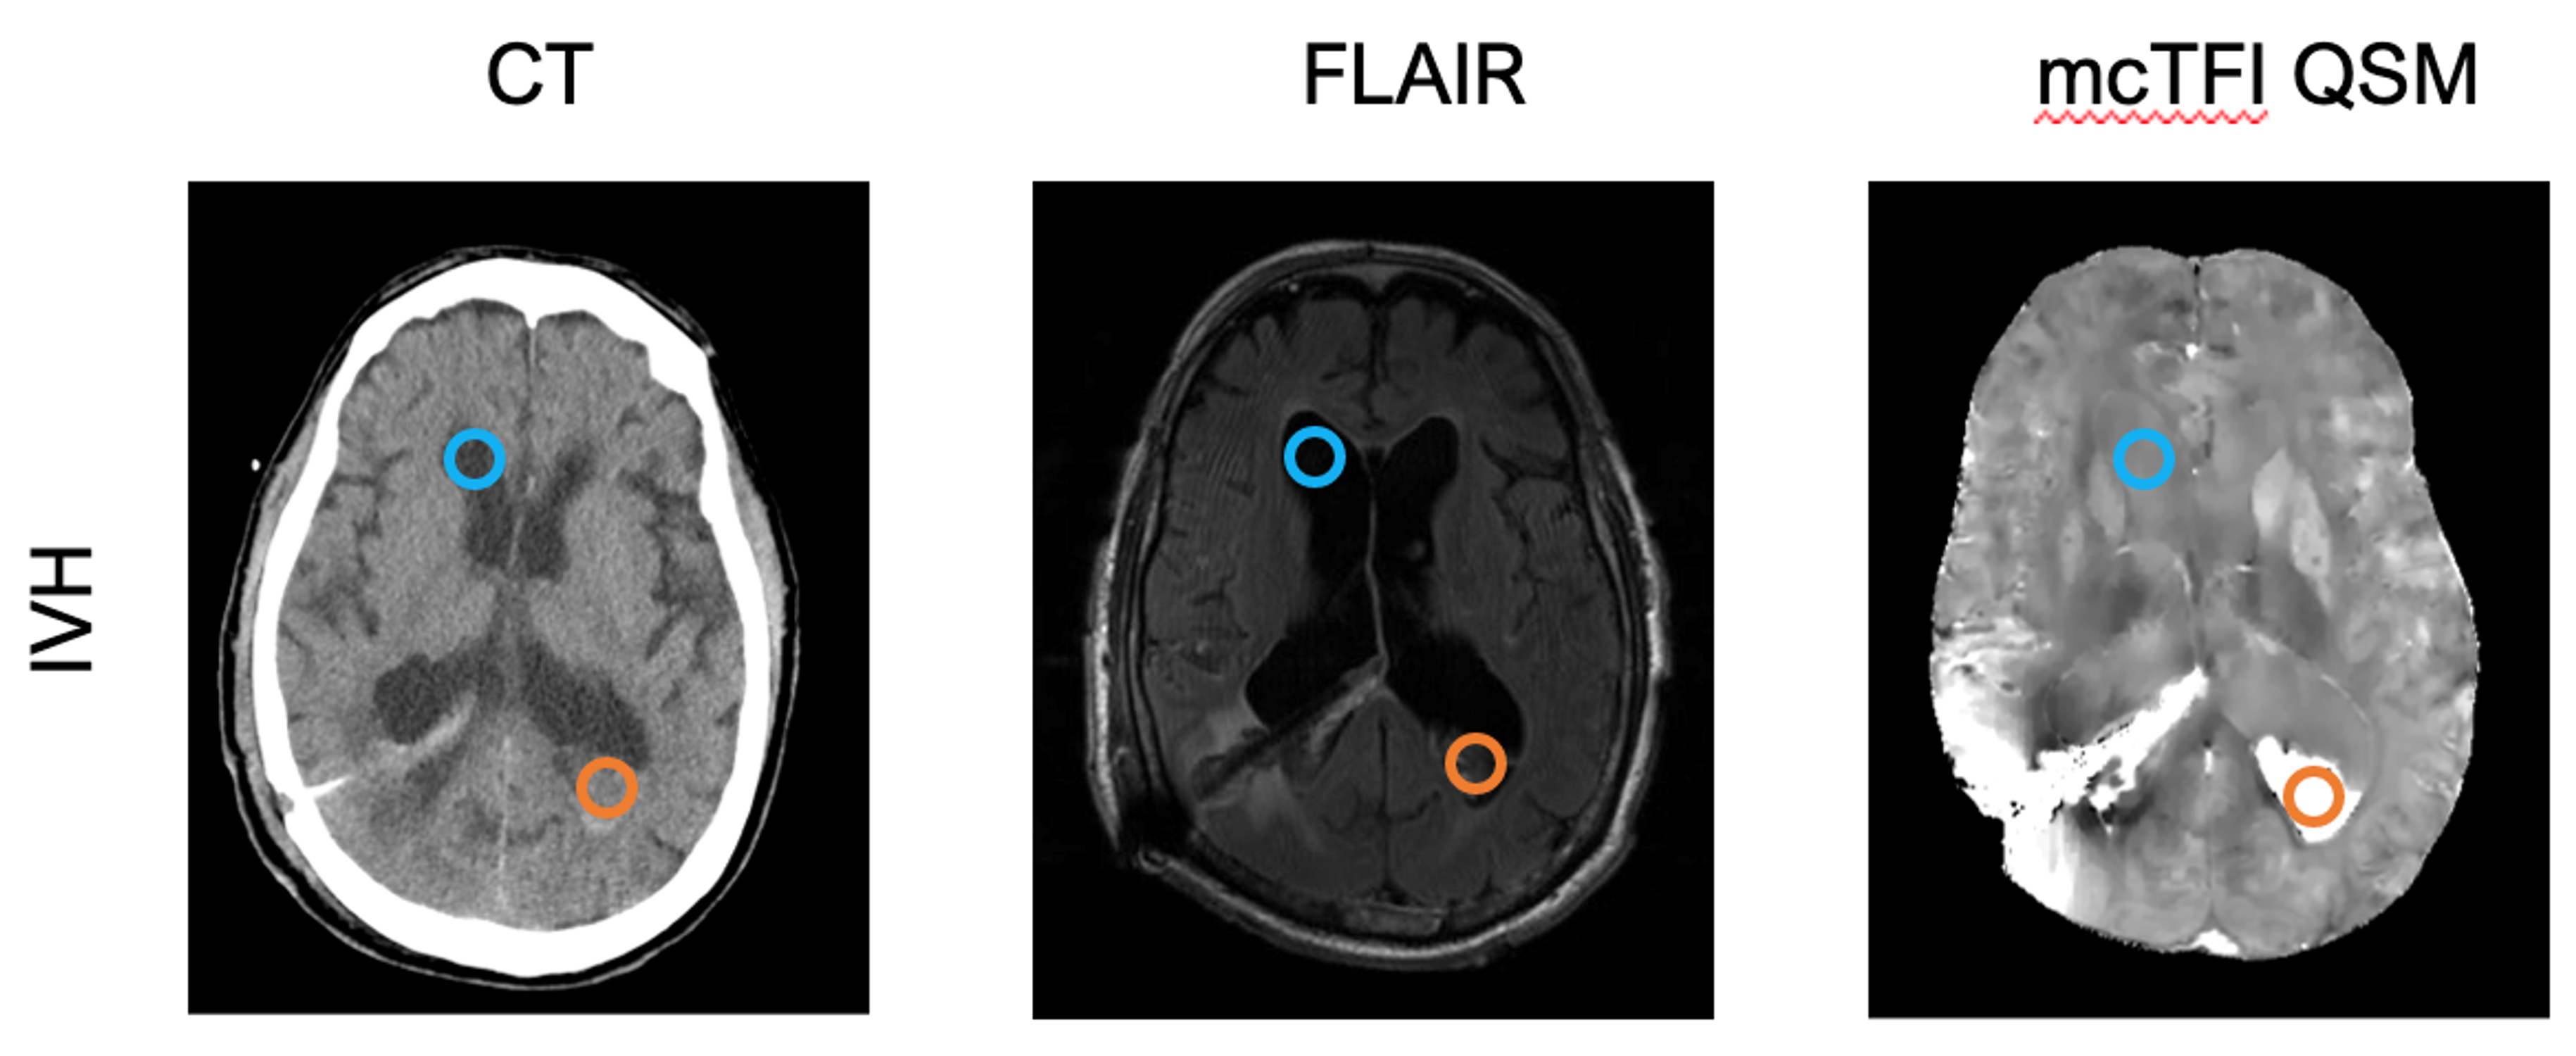
Under an IRB approved retrospective protocol, adult patients diagnosed with intracranial hemorrhage by non-contrast head CT and received concurrent brain MRI that included 3D multiecho GRE (3DMEGRE) and FLAIR imaging were recruited. All MRI data were collected on a MR system (Discovery MR750; GE Healthcare) at 3.0 T using a 32-channel head coil. Multiecho complex total field inversion (mcTFI) without CSF zero-referencing regularization were generated from the 3DMEGRE data and reviewed with FLAIR images4. Multiecho axial GRE sequence (first echo time, 3.648 msec; echo spacing, 3.984 msec; 11 echoes; repetition time, 47.424 msec; bandwidth, 62.5 kHz; voxel size, 0.5 x 0.5 x 1 mm3; flip angle, 12°; acquisition matrix, 256 x 256; reconstruction matrix, 512 x 512; total scan time, 4 minutes 30 seconds) and FLAIR images (TR 12000 msec; TE 94.1 msec; TI 2708.92 msec, and slice thickness 5.0 mm ) images were acquired. Regions of hemorrhagic and non-hemorrhagic CSF where manually selected in reference to head CT and FLAIR images (Figure 1) by a PGY III diagnostic radiology resident and CAQ certified neuroradiologist with 10 years’ experience through consensus read. All statistical analyses were performed using Prism Graphpad software. Comparisons between unregularized hemorrhagic QSM values to corresponding non-hemorrhagic QSM values were conducted with paired student-T tests. Relative QSM values were calculated by subtracting non-hemorrhagic CSF values from the hemorrhagic CSF values for each subject. Comparison of intraventricular (IVH) and subarachnoid (SAH) groups were made with an unpair student-T tests. Statistical significance was set at P < 0.05.RESULTS:
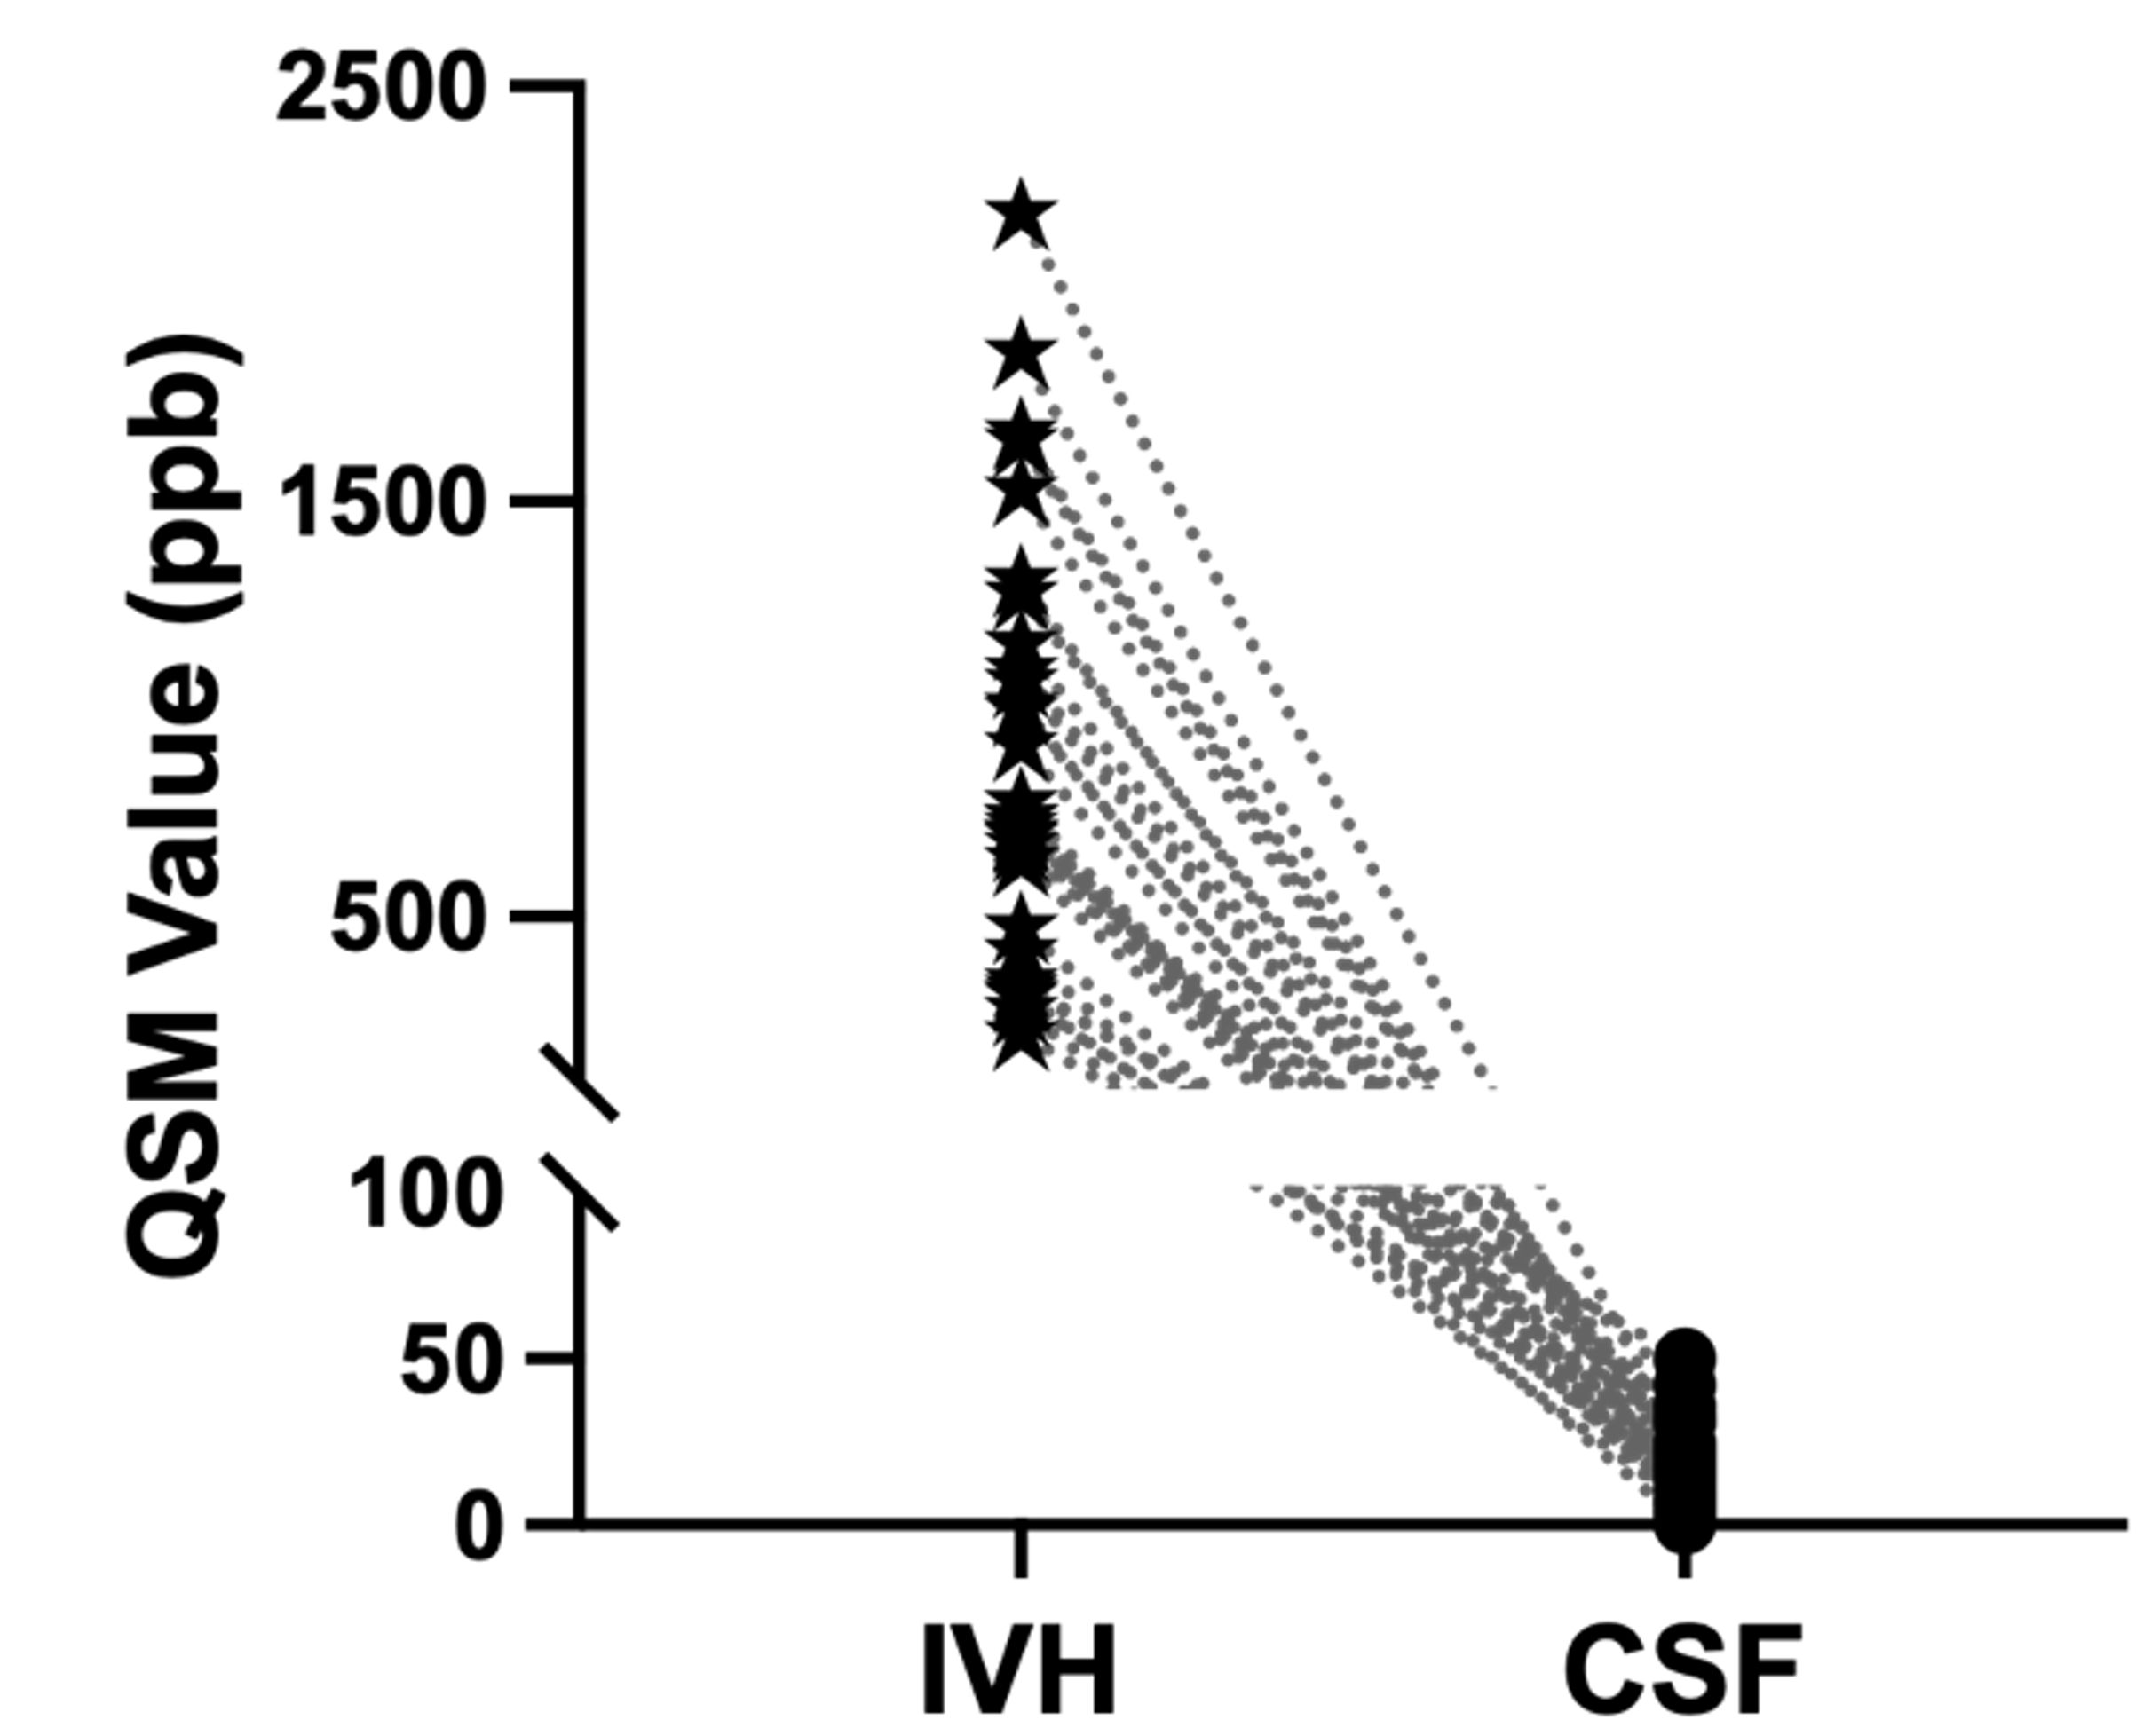
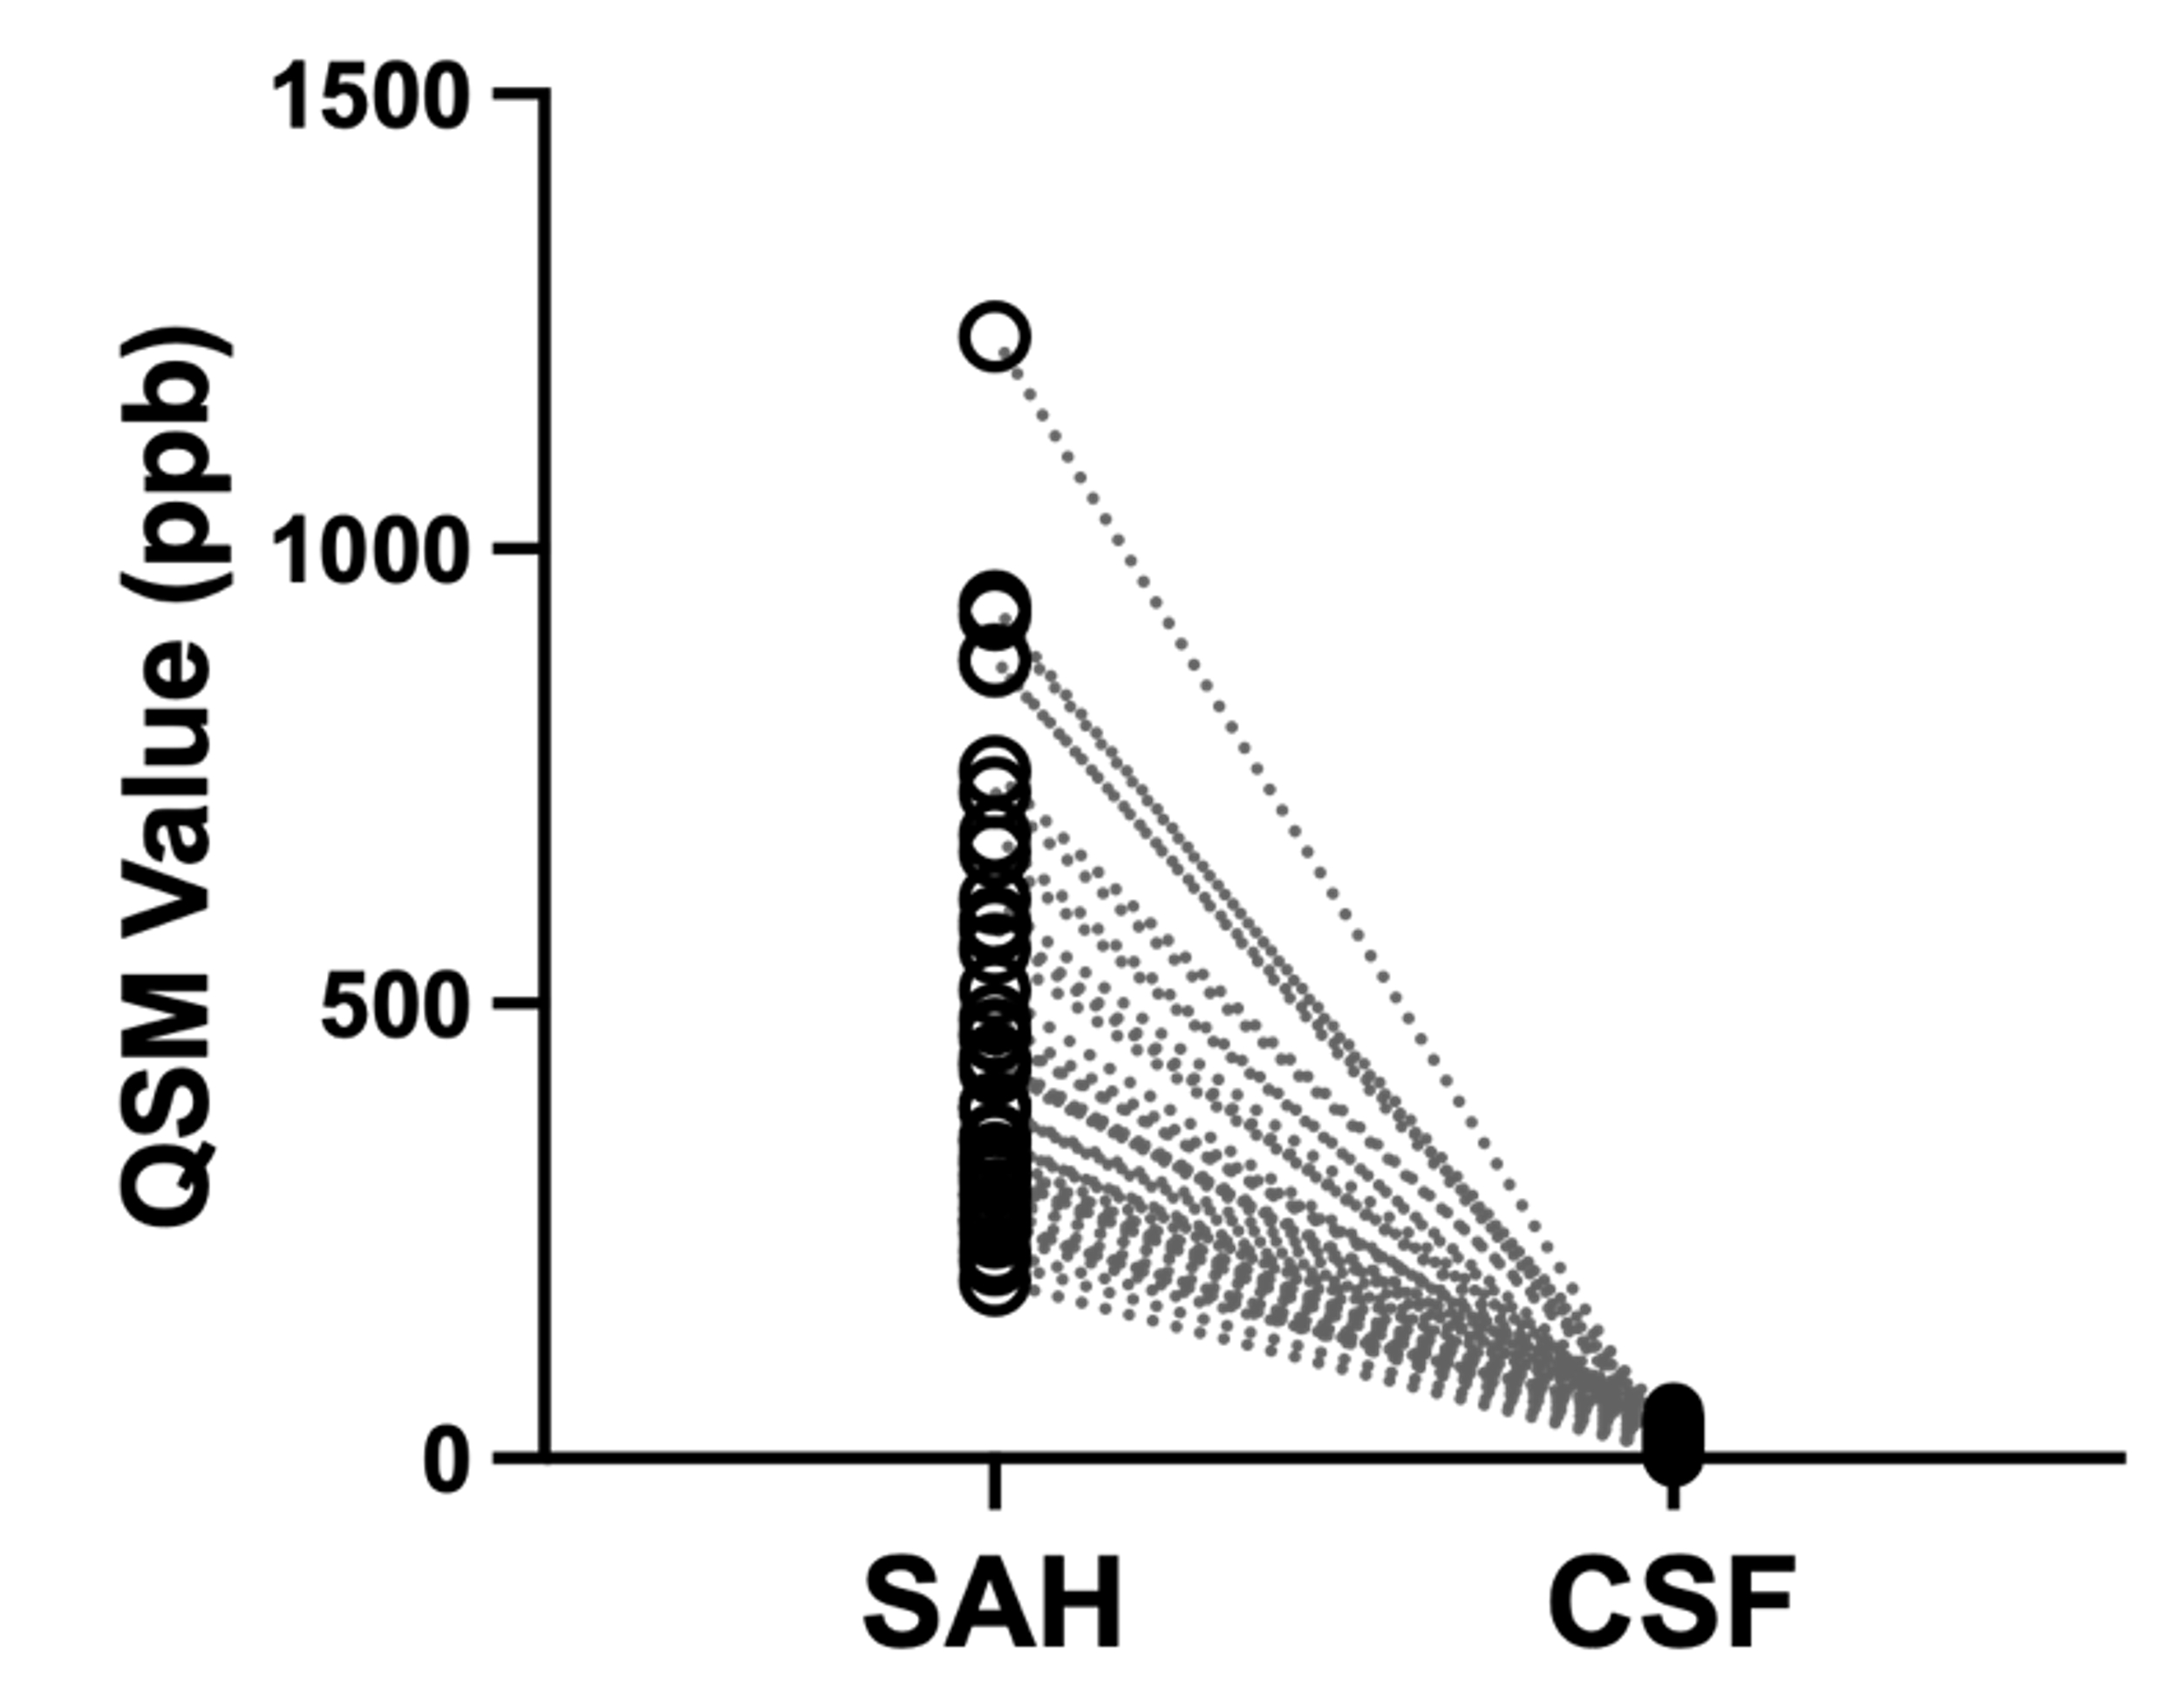
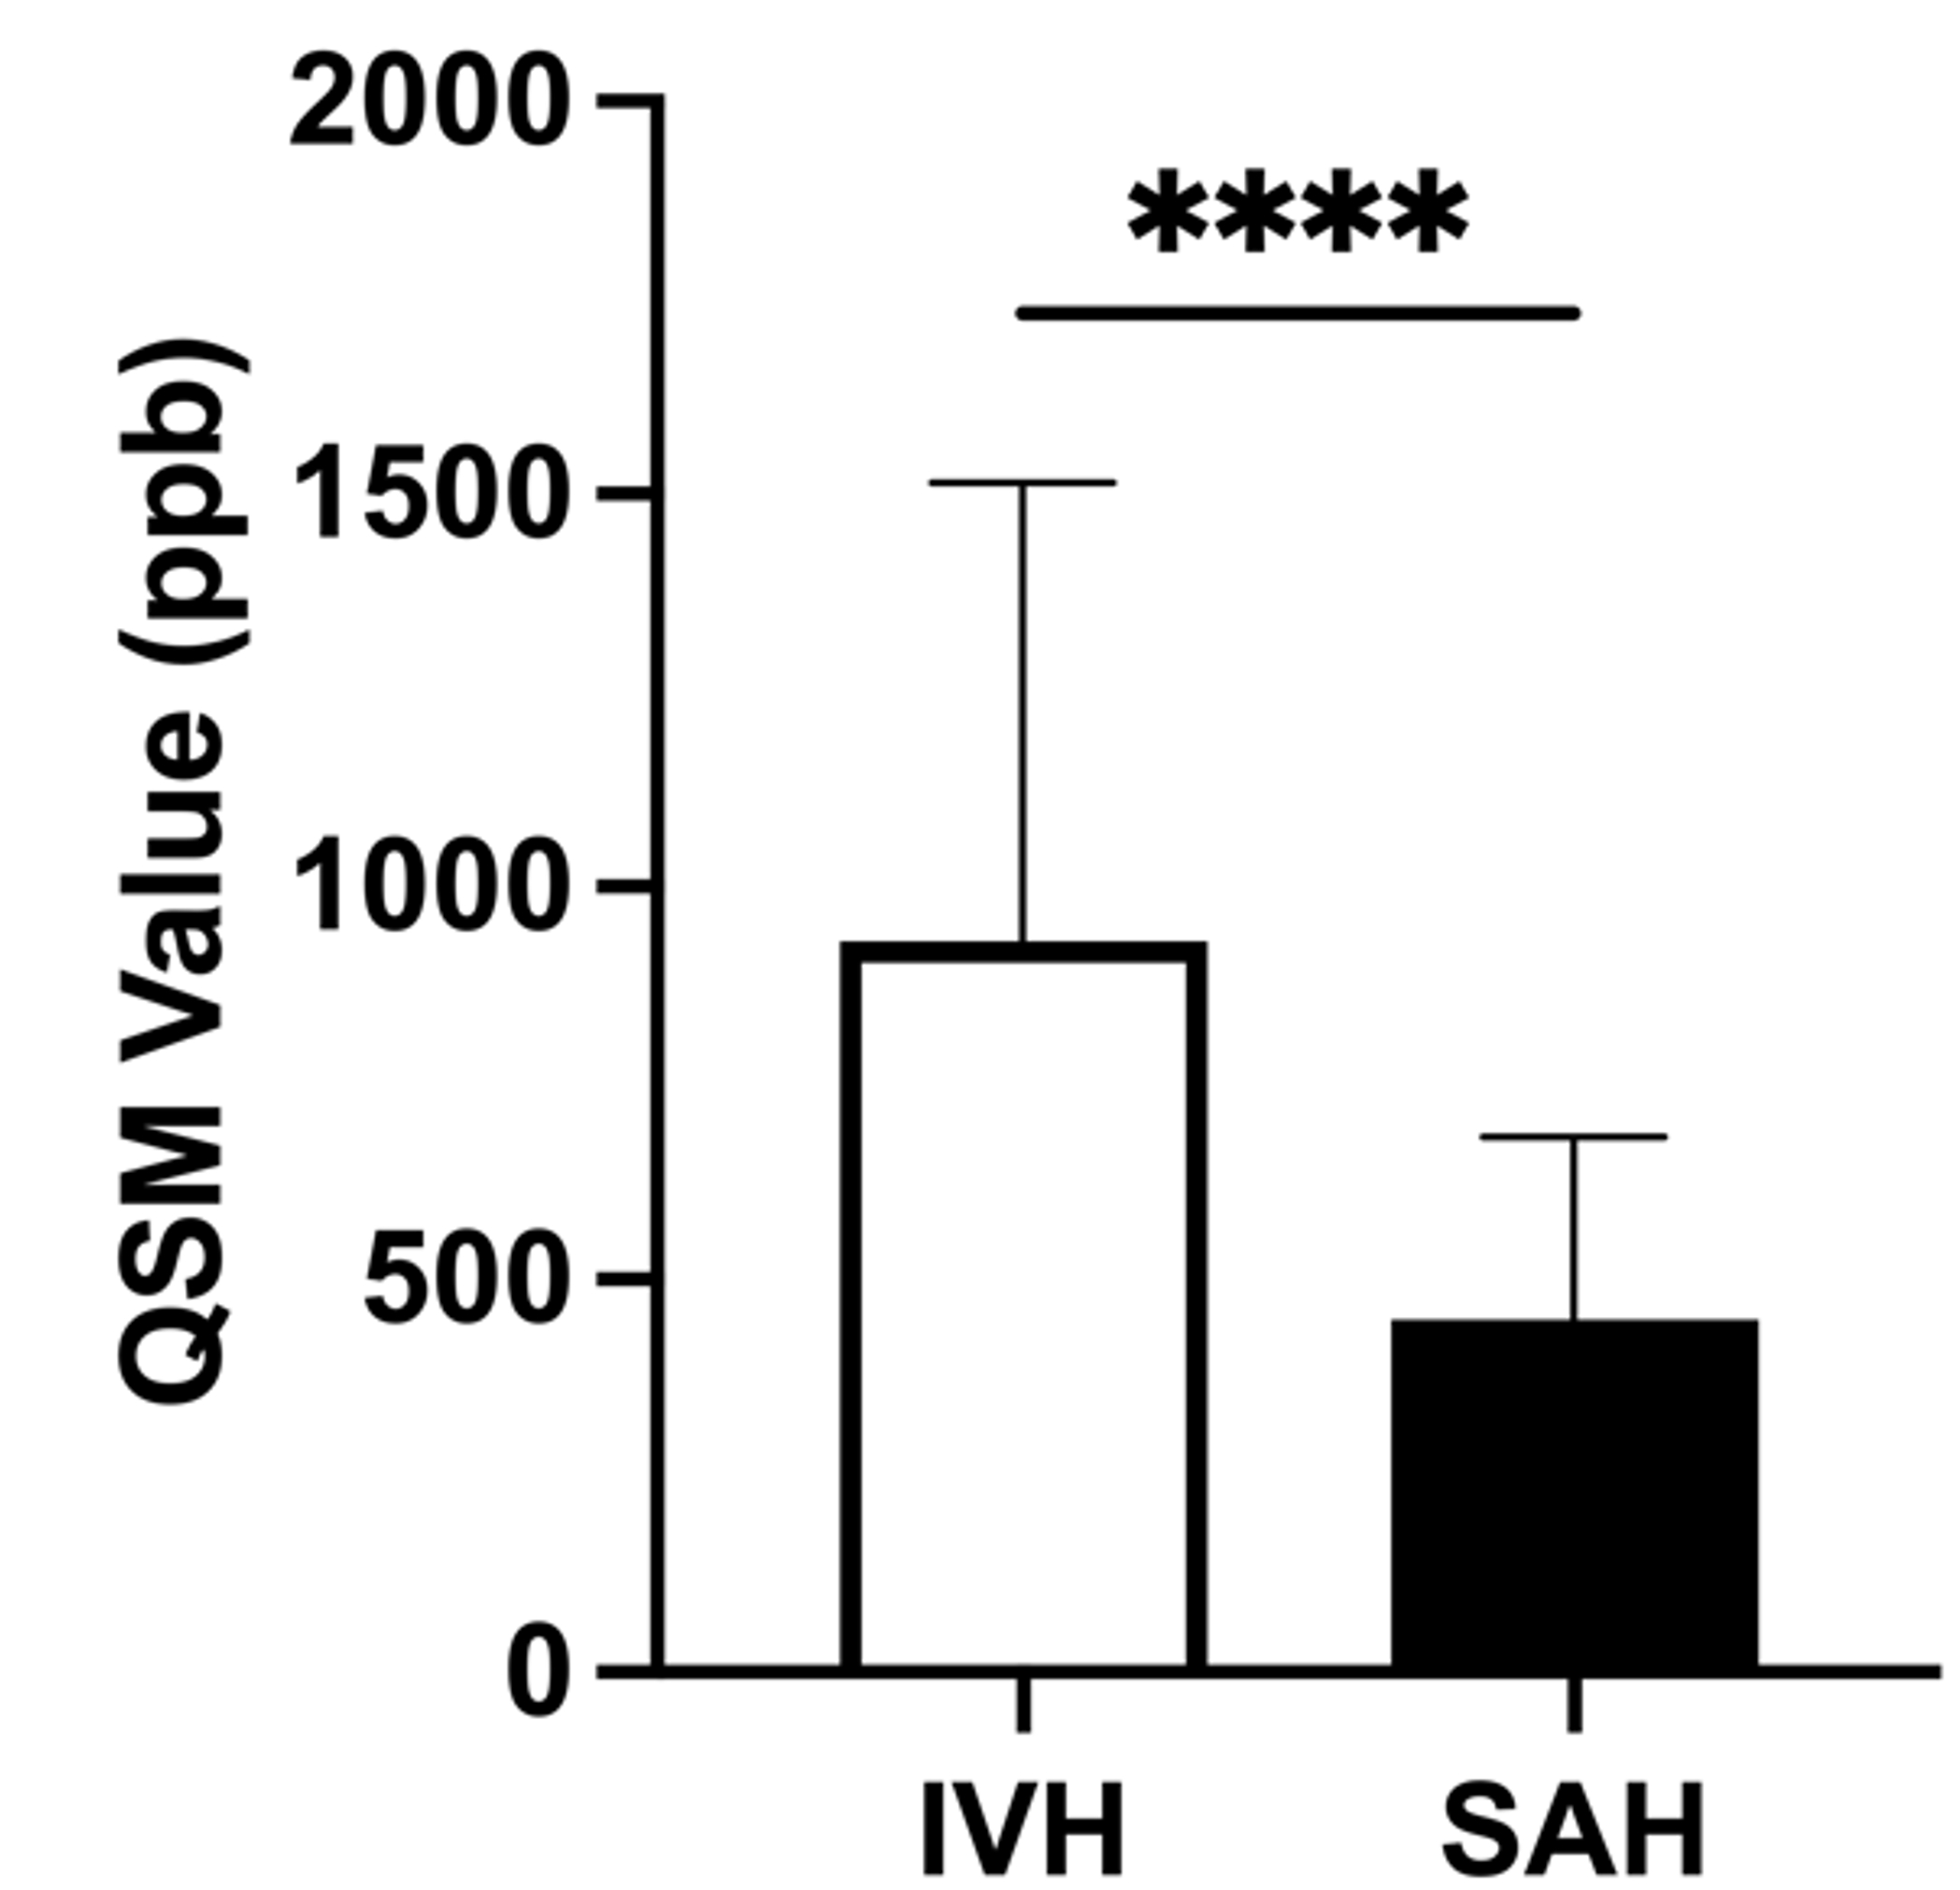
A total of 52 patients with intraventricular hemorrhage (N=31) and/or subarachnoid hemorrhage (N=45) were included in this study. In patients with intraventricular hemorrhage (IVH), the unregularized QSM value measured at the hemorrhagic CSF are overall higher than that measured at the non-hemorrhagic CSF, as showed in Figure 2. Similar trend was observed when comparing unregularized QSM values at the hemorrhagic CSF site and non-hemorrhagic CSF site in patients with subarachnoid hemorrhage (SAH), as demonstrated in Figures 3. Finally, we compared the relative QSM values of hemorrhagic CSF between patients with IVH and SAH. Interestingly, the relative QSM values in patients with IVH (449±231 ppb) were significantly higher than that in patients with SAH (930±574 ppb), Figure 4.DISCUSSION and CONCLUSIONS
In this study, we investigated the possible impacts of intracranial hemorrhage on utilizing CSF as reference region for quantitative susceptibility mapping of the brain. The mcTFI QSM was used for quantification as it has been shown to demonstrate better susceptibility quantification than earlier methods, and has been shown to correspond well with bleed age4-5. As expected, the QSM values are overall higher at the site of hemorrhagic CSF as determined by radiologist visual inspection of CT and MRI FLAIR images when compared with non-hemorrhagic CSF locations. The mean relative QSM values appear lower in the SAH groups, perhaps due to CSF dilution and relatively small region of interest measurement area. Meanwhile, the CSF at the dependent areas within the ventricles likely had more concentrated blood products. These results suggest that the use of CSF as a QSM reference in intracranial hemorrhage patients should be made with caution since it can impact inter and intrasubject comparison of QSM values between studies.Acknowledgements
No acknowledgement found.References
1. Sun, Klahr, A. C., Kate, M., Gioia, L. C., Emery, D. J., Butcher, K. S., & Wilman, A. H. (2018). Quantitative Susceptibility Mapping for Following Intracranial Hemorrhage. Radiology, 288(3), 830–839.
2. Deistung, Schweser, F., & Reichenbach, J. R. (2017). Overview of quantitative susceptibility mapping. NMR in Biomedicine, 30(4), e3569–n/a.
3. Straub, Schneider, T. M., Emmerich, J., Freitag, M. T., Ziener, C. H., Schlemmer, H., Ladd, M. E., & Laun, F. B. (2017). Suitable reference tissues for quantitative susceptibility mapping of the brain. Magnetic Resonance in Medicine, 78(1), 204–214.
4. Wen, Spincemaille, P., Thanh Nguyen, Cho, J., Kovanlikaya, I., Anderson, J., Wu, G., Yang, B., Fung, M., Li, K., Kelley, D., Benhamo, N., & Wang, Y. (2021). Multiecho complex total field inversion method (mcTFI) for improved signal modeling in quantitative susceptibility mapping. Magnetic Resonance in Medicine, 86(4), 2165–2178.
5. Champagne, Wen, Y., Selim, M., Filippidis, A., Thomas, A. J., Spincemaille, P., Wang, Y., & Soman, S. (2021). Quantitative Susceptibility Mapping for Staging Acute Cerebral Hemorrhages: Comparing the Conventional and Multiecho Complex Total Field Inversion magnetic resonance imaging MR Methods. Journal of Magnetic Resonance Imaging, 54(6), 1843–1854.
Figures