3188
Cross vendors test-retest validation of diffusion tensor image analysis along the perivascular space for evaluating glymphatic system function1Radiology and Biomedical Imaging, University of California, San Francisco, San Francisco, CA, United States, 2Zilkha Neurogenetic Institue, University of Southern California, Los Angeles, CA, United States, 3Mark & Mary Stevens Neuroimaging and Informatics Institute, University of Southern California, Los Angeles, CA, United States, 4Neurosurgery, Stanford University, Palo Alto, CA, United States, 5Radiology, Johns Hopkins University School of Medicine, Baltimore, MD, United States, 6Biomedical Engineering, Illinois Institute of Technology, Chicago, IL, United States, 7Diagnostic Radiology and Nuclear Medicine, Rush University, Chicago, IL, United States, 8The Mind Research Network, Albuquerque, NM, United States, 9Neurology, University of California, Davis, Davis, Davis, CA, United States, 10Neuroscience, University of Kentucky, Lexington, KY, United States, 11Population Health Sciences and Glenn Biggs Institute for Neurodegenerative Diseases, University of Texas Health Science Center at San Antonio, San Antonio, TX, United States, 12Neuroimage Analytics Laboratory and Biggs Institute Neuroimaging Core, Glenn Biggs Institute for Neurodegenerative Diseases, University of Texas Health Science Center at San Antonio, San Antonio, TX, United States, 13Neurology, University of California, San Francisco, San Francisco, CA, United States, 14Neurology, Massachusetts General Hospital, Boston, MA, United States, 15Radiology, Harvard Medical School, Boston, MA, United States, 16Athinoula A. Martinos Center for Biomedical Imaging,Massachusetts General Hospital, Charlestown, MA, United States, 17Computer Science and AI Lab, Massachusetts Institute of Technology, Cambridge, MA, United States, 18Radiology, Massachusetts General Hospital, Boston, MA, United States, 19Athinoula A. Martinos Center for Biomedical Imaging, Massachusetts General Hospital, Charlestown, MA, United States
Synopsis
Keywords: Neurofluids, Brain, glymphatic system
The diffusion tensor image analysis along the perivascular space (DTI-ALPS) method was proposed to evaluate glymphatic system (GS) function. However, few studies validate its reliability and reproducibility. 50 participants’ DTI data from the MarkVICD consortium were recruited in this study. Two pipelines by using DSI studio and FSL software were developed for data processing and ALPS-index calculation. The mean ALPS-index was obtained by the average of bilateral ALPS-index and was used for testing the cross vendors test-retest reliability by using R studio. Mean ALPS-index demonstrated favorable inter-scanner reproducibility, inter-rater reliability and test-retest repeatability, offering a potential biomarker for GS function.Abstract body
Introduction: Glymphatic system (GS) is one of the major putative clearance systems in central nervous system (CNS), According to the GS hypothesis, cerebral spinal fluid (CSF) flow moves along the peri-vascular space to clear away the brain waste solute through the exchange of cerebral spinal fluid (CSF)-interstitial spinal fluid (ISF) facilitated by astrocyte aquaporin-4 (AQP4) water channel, then drained out into lymphatic vessels1. GS seems to be critical for keeping cerebral fluids hemostasis and the dysfunction of GS has been found associated with numerous neurological diseases and brain disorders, such as cerebral small vessel disease (cSVD), Alzheimer’s disease (AD) and sleep disorders2. The diffusion tensor image analysis along the perivascular space (DTI-ALPS) method was proposed to non-invasively evaluate the GS function and has been regarded as a potential biomarker for GS dysfunction in various pathologies3,4. However, studies conducting cross-vendor test-retest validation of DTI-ALPS method are lacking. This study aimed to describe the findings of the cross-vendor test-retest validation of DTI-ALPS method.Methods: The participants and MRI data used in this study were acquired as part of the MarkVCID consortium, which consisted of seven sites. A total of 15 participants were selected for inter-scanner reproducibility and inter-rater reliability analysis. A total of 35 participants who underwent two MR scan sessions within a 14-day interval were recruited for test-retest repeatability analysis. The DTI data were acquired by using different 3T MR scanners at different sites, including two Siemens systems (TIM Trio and Prisma), one Philips system (Achieva) and one GE system (750W). The DTI protocol used a single shell, b=1000s/mm2, 40-direction with a voxel size of 2.0*2.0*2.0mm3 and six b=0 s/mm2. The reverse polarity data were used to estimate and correct image distortion. The general DTI data processing includes: TOPUP distortion correction, Eddy current and head movement correction, x-, y- and z-axis diffusion maps (Dxx, Dyy, Dzz) creation and co-registration to a standard template, regions of interest (ROIs) designation. We implemented and tested two pipelines for the DTI processing and the computation of the ALPS index: one employing a graphic-user interface software (DSI studio), another one fully automated based on FSL tool (See Figure 1A and 1B). Unlike the DSI studio pipeline, additional denoising and Gibbs-unringing via MRtrix3 were included in the FSL pipeline, the JHU-ICBM-FA template instead of ICBM standard template was used for co-registration and the ROIs were drawn as spheres with 5mm diameter on the JHU-ICBM-white-matter atlases in FSL pipeline (See Figure 1C). At the level of the lateral ventricle body, the medullary veins run in the same direction of the perivascular space (x-axis), while the nearby projection fibers (y-axis) and association fibers (z-axis) run orthogonal to the direction of the perivascular space, changes along the perivascular space will therefore equally affect both projection and association fibers. The ALPS-index was calculated as follows: ALPS- index=mean(Dxxproj, Dxxassoc)/mean(Dyyproj, Dzzassoc)3. The mean ALPS-index was calculated by the average of bilateral ALPS-index and was used for validation analysis, including inter-scanner reproducibility, inter-rater reliability and test-retest repeatability. The pairwise intraclass correlation coefficient (ICCc) between scanners was calculated as follows: ICCc = (MSR-MSE)/MSR+(k-1) MSE and the ICCAA between raters and test-retest was calculated as follows: ICCAA = (MSR-MSE)/MSR+(k-1)MSE+k/n(MSc-MSE) by using R studio software. Bland-Altman plot and scatterplot were used for outcome visualization. Outcome reports were classified as poor, moderate, good, and excellent following ICC values < 0.5, between 0.5 and 0.75, between 0.75 and 0.9, and > 0.90, respectively5.
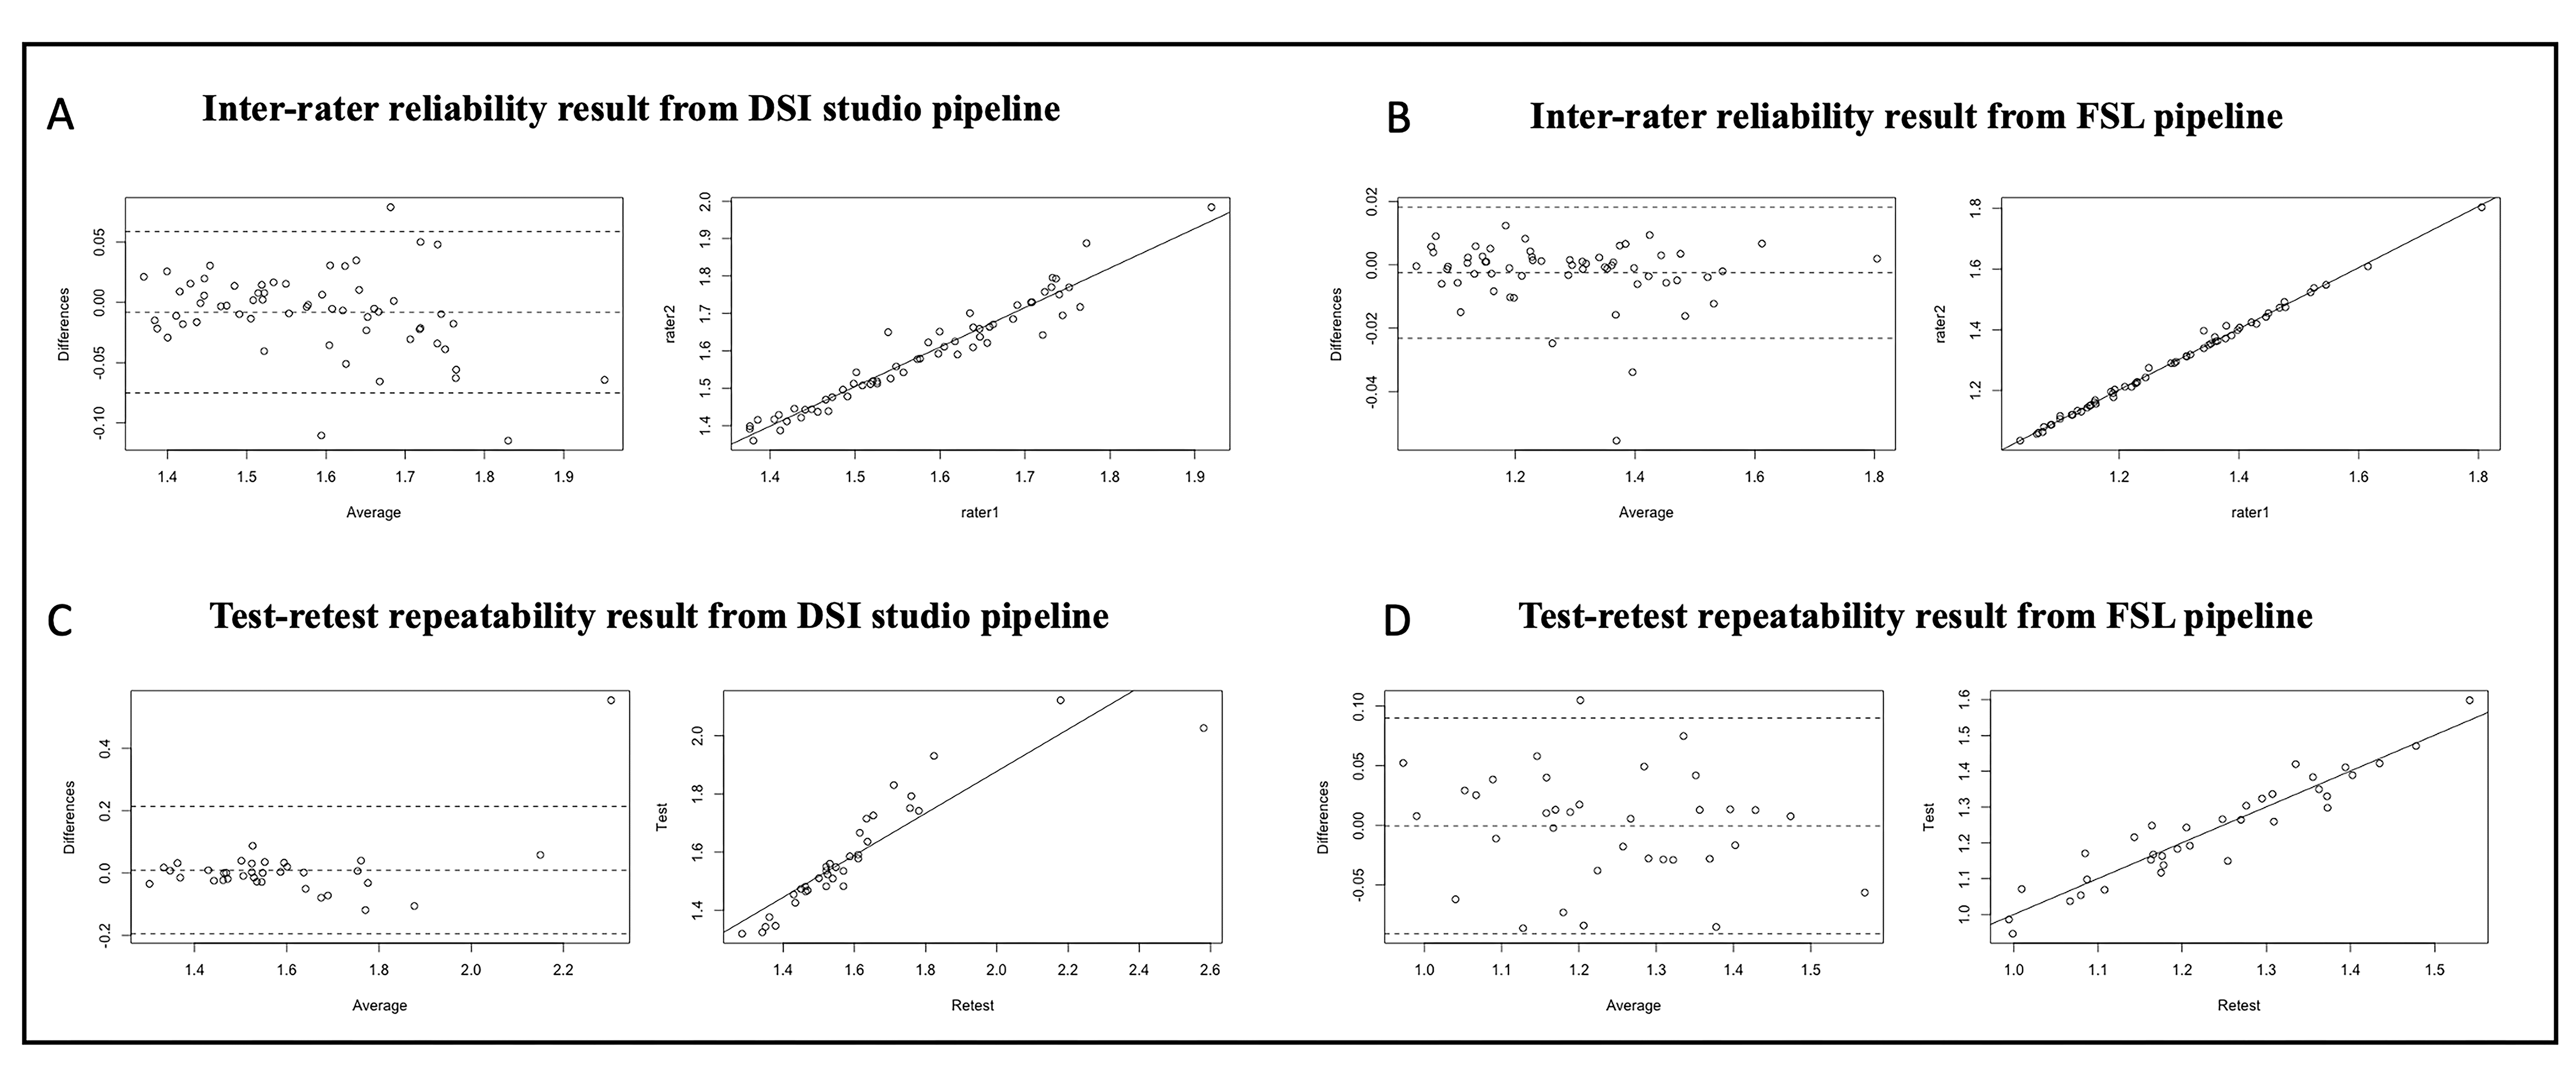
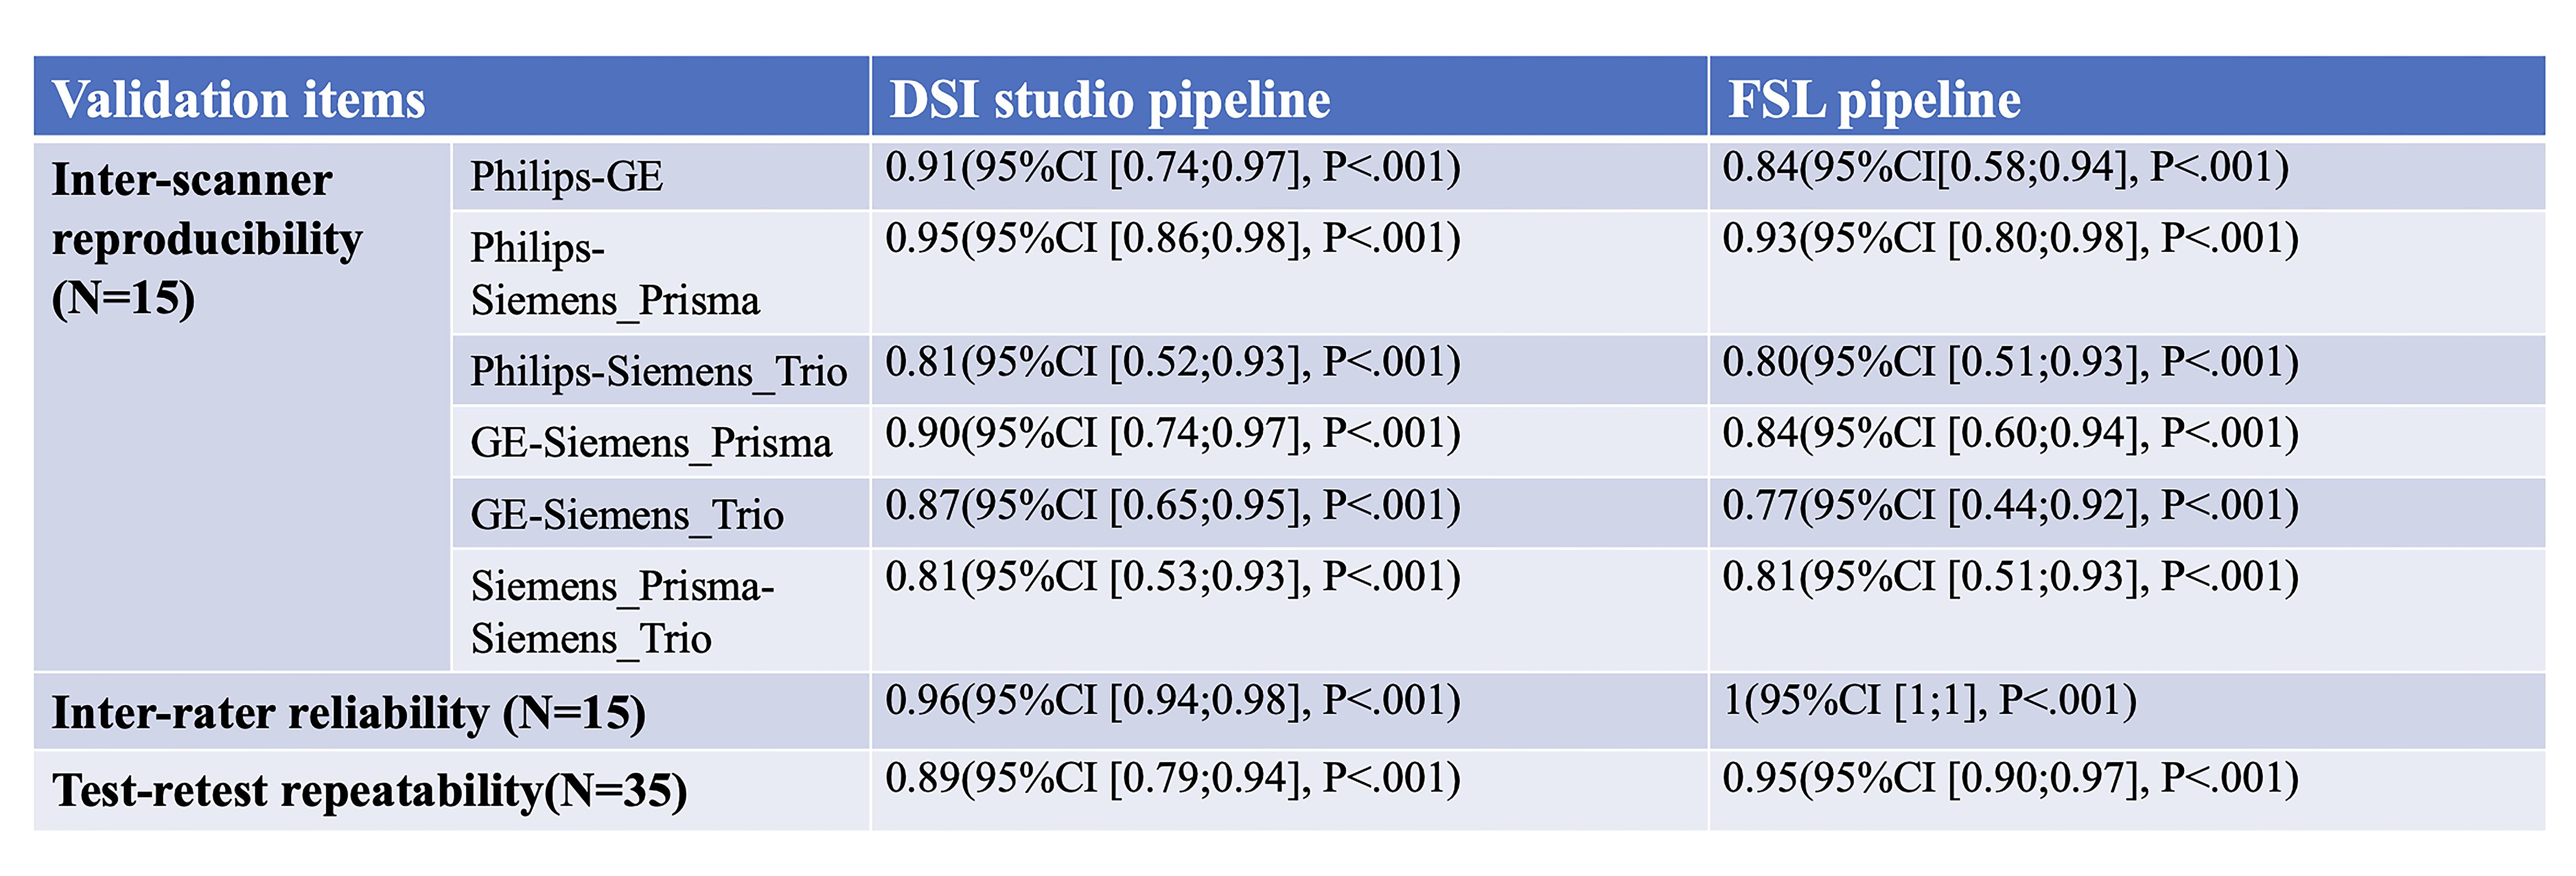
Results: Figure 2-3 illustrated the mean ALPS-index results from both DSI studio and FSL pipelines have good consistencies across the four scanners, excellent inter-rater reliability and high agreement between test and retest sessions. Figure 4 demonstrated the pairwise ICCc for each paired scanner was all significant (P<.001): 0.91(95%CI [0.74;0.97]) (DSI studio) and 0.84 (95%CI [0.58;0.94]) (FSL) for Philips-GE, 0.95 (95%CI [0.86;0.98]) (DSI studio) and 0.93 (95%CI [0.80;0.98]) (FSL) for Philips-Siemens_Prisma, 0.81(95%CI [0.52;0.93]) (DSI studio) and 0.80 (95%CI [0.51;0.93]) (FSL) for Philips-Siemens_Trio, 0.90 (95%CI [0.74;0.97]) (DSI studio) and 0.84 (95%CI [0.60;0.94]) (FSL) for GE-Siemens_Prisma, 0.87 (95%CI [0.65;0.95] (DSI studio) and 0.77 (95%CI [0.44;0.92]) for GE-Siemens_Trio, 0.81(95%CI [0.53;0.93]) (DSI studio) and 0.81(95%CI [0.51;0.93]) (FSL) for Siemens_Prisma-Siemens_Trio. The overall ICCAA between raters and test-retest sessions were 0.96 (95%CI [0.94;0.98]) (DSI studio) and 1(95%CI [1;1]) (FSL), and 0.89 (95%CI [0.79;0.94]) and 0.95 (95%CI [0.90;0.97]) (FSL), respectively (P<.001).
Discussion: The mean ALPS-index demonstrated favorable inter-scanner reproducibility, inter-rater reliability and test-retest repeatability. The relatively lower consistency across Siemens_Trio and the other three scanners might be due to the lack of reverse polarity data or missing B0 image in the DTI datasets acquired on Siemens_Trio, which prevented to conduct the TOPUP distortion correction. Compared to the DSI studio pipeline, the mean ALPS-index analyzed with the automated FSL pipeline demonstrated better agreement between raters and test and retest sessions, but showed slightly lower consistency across scanners, which might be due to the discrepancies between the two pipelines. Assessing which factors would influence the validation results requires further investigation.
Conclusion: The mean ALPS-index demonstrated favorable inter-scanner reproducibility, inter-rater reliability and test-retest repeatability, offering a robust biomarker for the evaluation of GS function in the context of cSVD and vascular cognitive impairment and dementia (VCID).
Acknowledgements
The authors thank the patients who participated in this study and the support of MarkVCID consortium.References
1. Iliff JJ, Wang M, Liao Y, et al. A paravascular pathway facilitates CSF flow through the brain parenchyma and the clearance of interstitial solutes, including amyloid β. Sci Transl Med. 2012;4(147).
2. Jessen NA, Munk ASF, Lundgaard I, Nedergaard M. The Glymphatic System: A Beginner’s Guide. Neurochem Res. 2015;40(12):2583-2599.
3. Taoka T, Masutani Y, Kawai H, et al. Evaluation of glymphatic system activity with the diffusion MR technique: diffusion tensor image analysis along the perivascular space (DTI-ALPS) in Alzheimer’s disease cases. Jpn J Radiol. 2017;35(4):172-178.
4. Taoka T, Ito R, Nakamichi R, et al. Reproducibility of diffusion tensor image analysis along the perivascular space (DTI-ALPS) for evaluating interstitial fluid diffusivity and glymphatic function: CHanges in Alps index on Multiple conditiON acquIsition eXperiment (CHAMONIX) study. Jpn J Radiol. 2022;40(2):147-158.
5. Koo TK, Li MY. A Guideline of Selecting and Reporting Intraclass Correlation Coefficients for Reliability Research. J Chiropr Med. 2016;15(2):155-163.
Figures
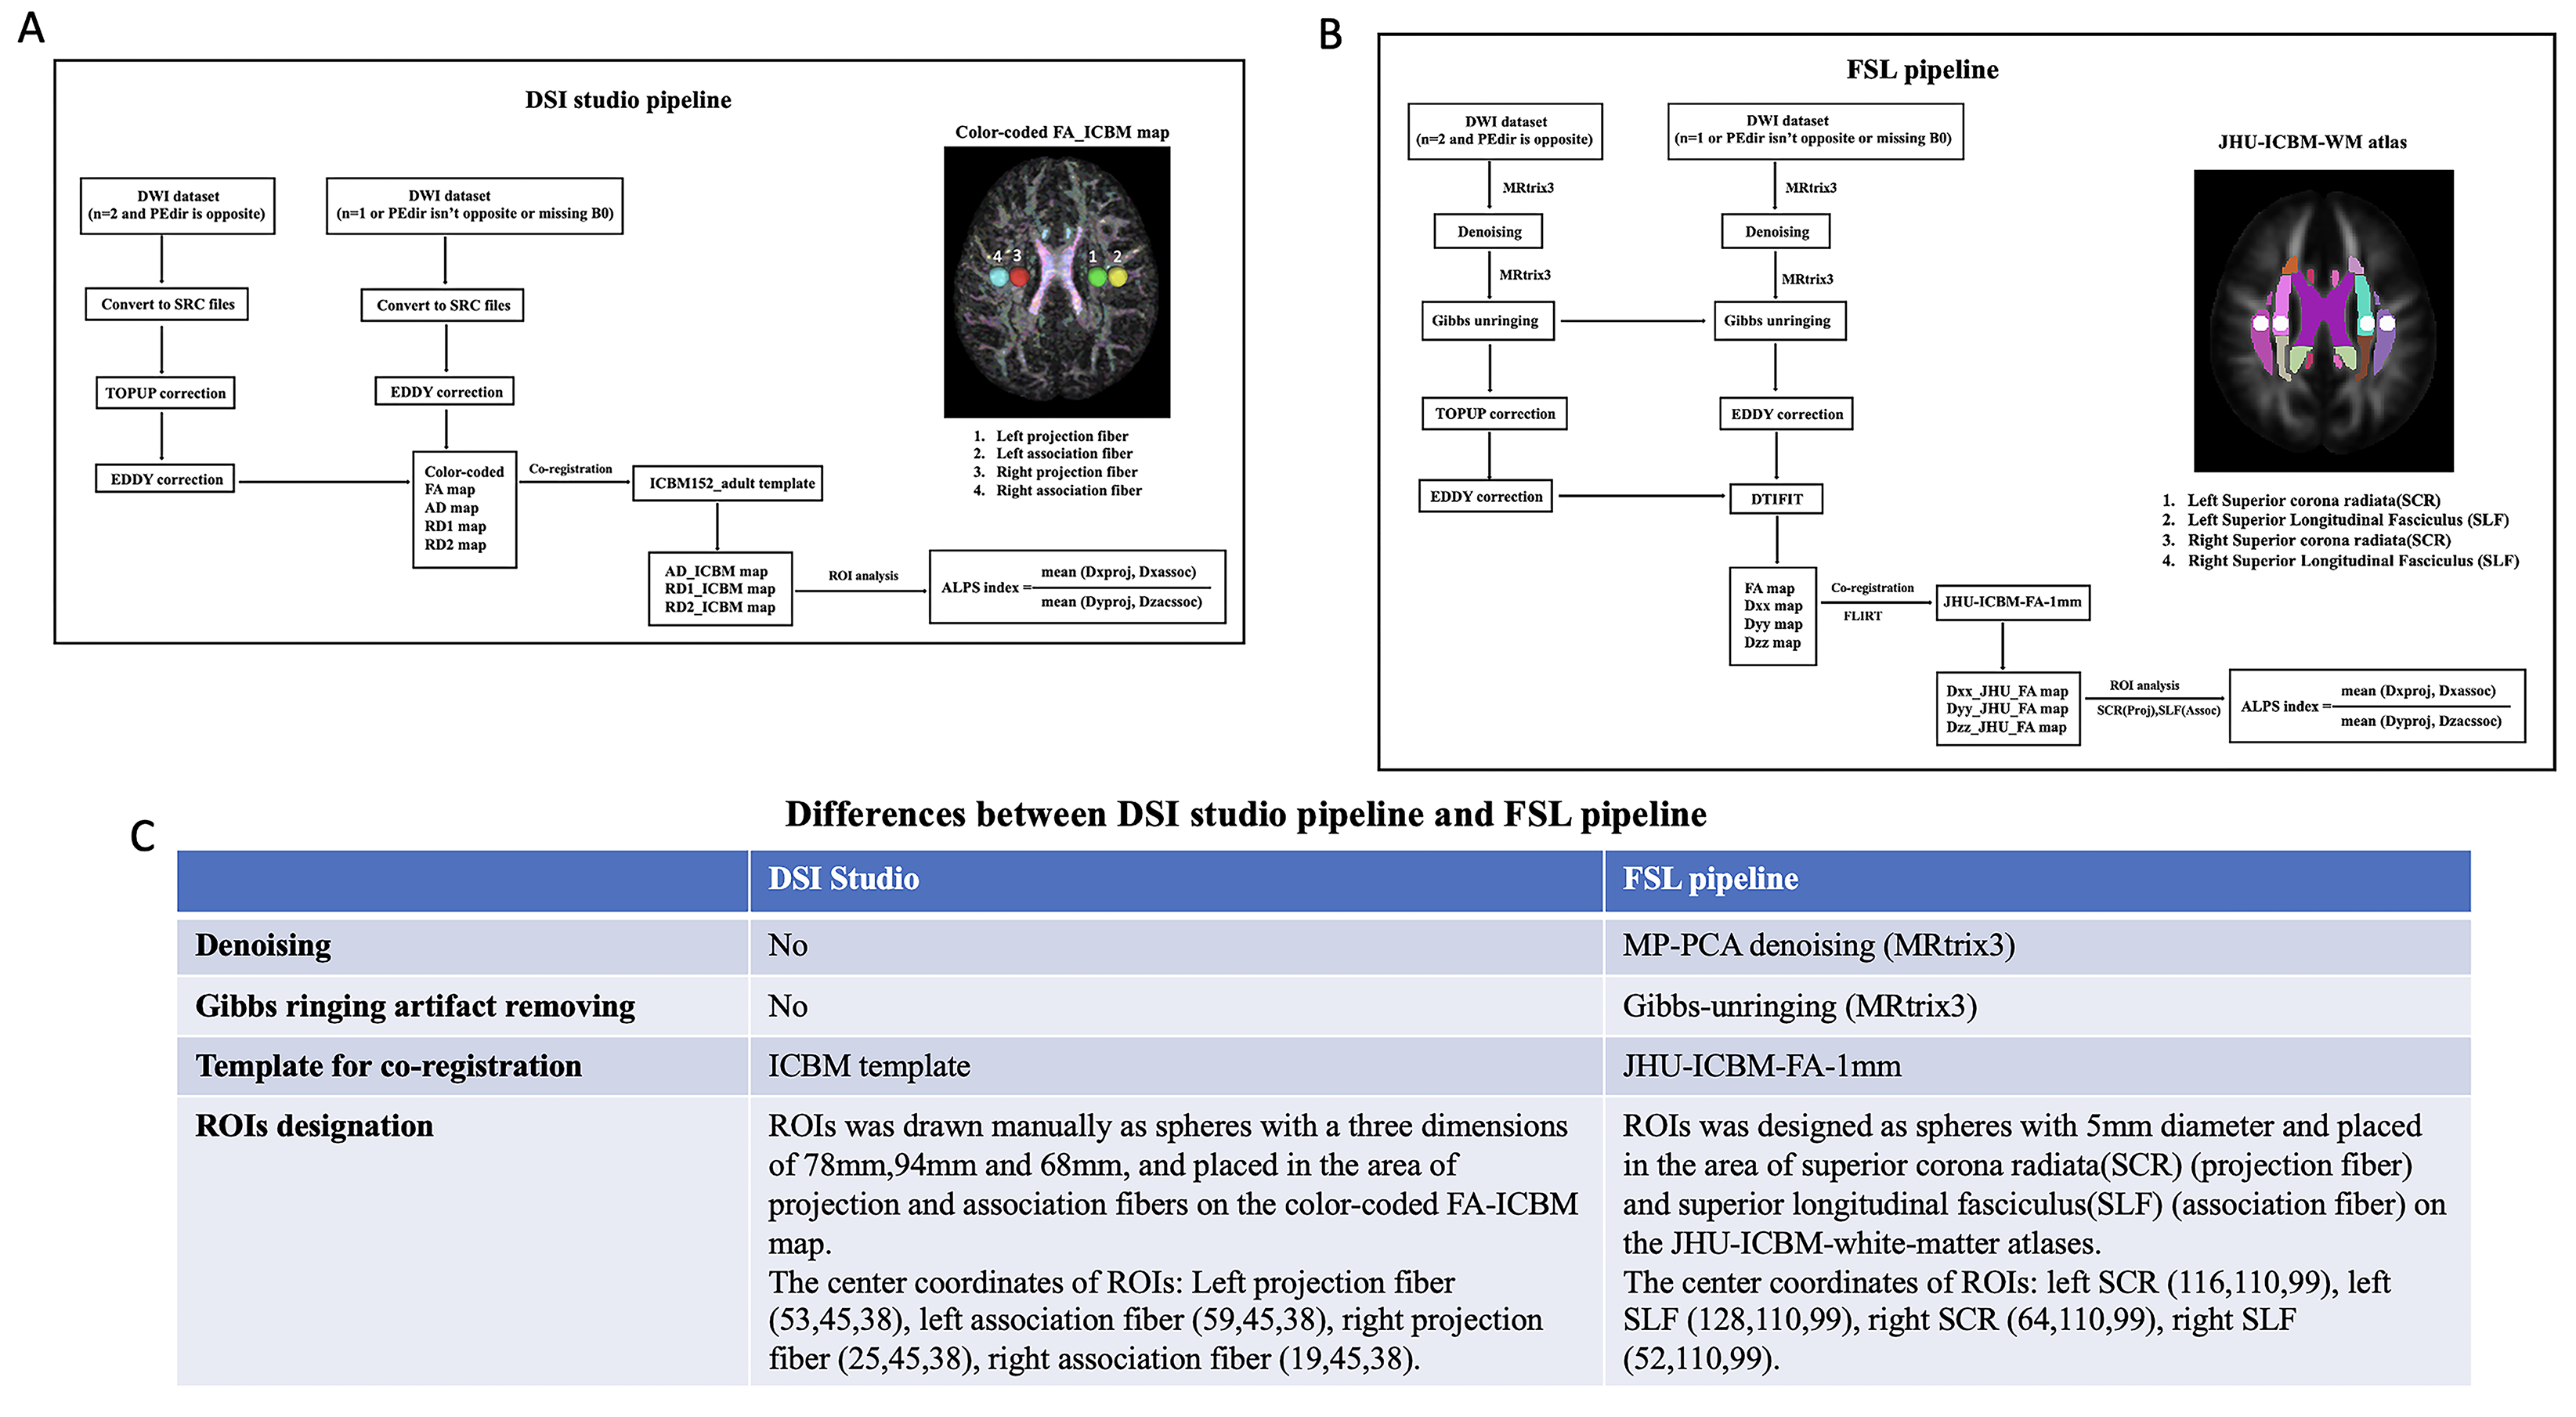
Figure 1 DSI studio pipeline vs. FSL pipeline. Figure 1A shows the DSI studio pipeline for DTI data processing and ALPS-index calculation. Figure 1B shows the FSL pipeline for DTI data processing and ALPS-index calculation. Figure 1C shows the differences between the DSI studio pipeline and the FSL pipeline.
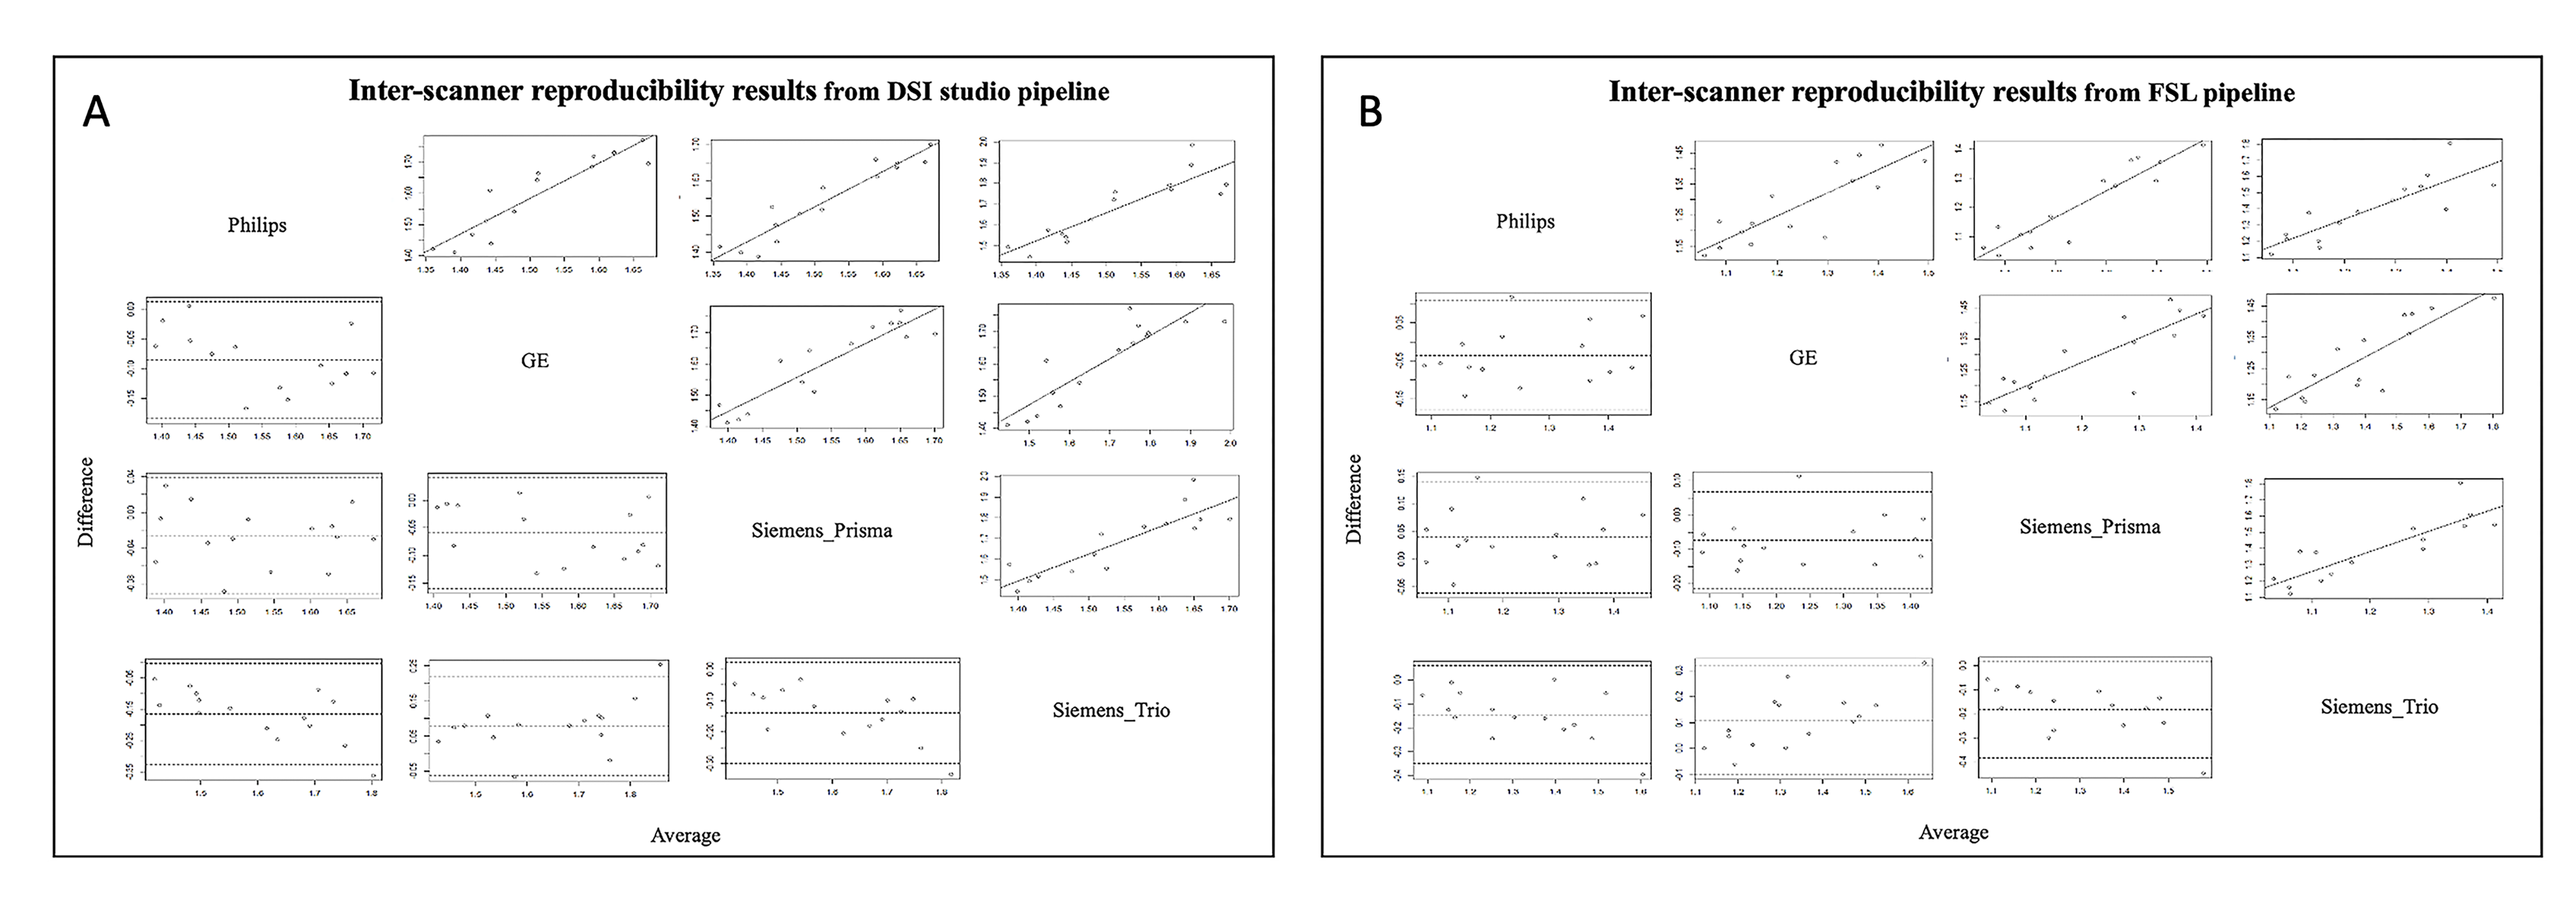
Figure 2 Bland-Altman plot (lower triangle panel) and scatterplot with linear regression line (upper triangle panel) of the mean ALPS-index obtained from different pairs of scanners in a total of 15 subjects. Figure 2A shows the inter-scanner reproducibility results from the DSI studio pipeline. Figure 2B shows the inter-scanner reproducibility results from the FSL pipeline.