3187
Machine Learning for Quantitative IVIM (qIVIM) Cerebral Perfusion Imaging
Mira Liu1, Julian Bertini1, Niloufar Saadat2, Chisondi Simba Warioba1, Donovan Gorre1, Timothy Carroll1, and Gregory Christoforidis2
1University of Chicago, Chicago, IL, United States, 2Interventional Radiology, University of Chicago, Chicago, IL, United States
1University of Chicago, Chicago, IL, United States, 2Interventional Radiology, University of Chicago, Chicago, IL, United States
Synopsis
Keywords: Neurofluids, Perfusion
Intravoxel Incoherent Motion (IVIM) is a non-contrast perfusion scan that measures various speeds of molecular movement. Segmentation of IVIM signal origin, i.e. from blood, cerebrospinal fluid (CSF), or tissue water, is crucial. Simulation suggested Inversion Recovery should not be used in IVIM to remove CSF, and analysis of signal patterns suggested differing signal decay as a method of removing CSF during post-processing. A threshold determined by k-fold leave-one-out cross-validation on IVIM diffusion coefficient returned successful CSF segmentation (dice = .69), and CSF removal by supervised machine learning via linear discriminant analysis returned quantitative IVIM with strong agreement to microsphere perfusion.Introduction
Intravoxel Incoherent Motion (IVIM) is a non-contrast MR diffusion-based scan that uses a multitude of b-values to measure various speeds of molecular movement[1]. Unlike contrast-based perfusion, signal comes from all water molecules in the brain. The ability to separate IVIM signal origin, i.e. from blood, CSF, or tissue water, is a critical step in clinical and research application. Simulations and machine learning algorithms were studied to compare supervised machine learning to traditional Inversion Recovery (IR) magnetization preparation[2] for the suppression of non-specific cerebrospinal fluid (CSF) in quantitative IVIM-based tissue perfusion images.Materials and Methods
Studies were performed based on physics simulations, human volunteers, and a canine model of acute stroke at baseline, Co2 induced hypercapnia, and post middle cerebral artery occlusion[3].Image Acquisition: Diffusion weighted images (DWI) for IVIM were collected at 10 b-values from 0 to 1000 and 3 directions with 50 slices to cover the entire head (2D single shot EPI, TR/TE= 3056/91 ms, slices/thickness = 50/2mm, FOV = 160mm, SENSE Factor=2). Scan time for the IVIM sequence was 5:38. IVIM signal across b-values were normalized to b0-value and fit to $$$ \frac{S(b)}{S(0)} = fe^{-bD^*} + (1-f)e^{-bD} $$$ with a two-step fit to return IVIM parameters f, D, D*. Signal was also fit to a mono-exponential $$$ \frac{S(b)}{S(0)} = Ae^{-bD_{mono}}$$$
Inversion Recovery Simulation: A simulation considering both T1 and T2 effects in an Inversion Recovery Spin Echo sequence was written in Python 3.0 (Anaconda Software Distribution, Austin, TX) with literature value T1 and T2 values for blood and CSF.
Machine Learning: K-fold nested Leave-One-Out Cross-Validation (LOOCV) of a threshold on IVIM mono-exponential coefficient was used to create CSF masks with hand-drawn segmentation as ‘truth’ with 11 cases, 3 slices each, with success gauged by dice similarity coefficient. Multiclass segmentation of voxels via linear and quadratic discriminant analysis of IVIM parameters (f, D, D*) was written in MATLAB 2022b (Mathworks, M.A., U.S.). The model was constructed for baseline, hypercapnia, and post-occlusion with 75% of total voxels (5.1k, 3.7, and 4.6k respectively) and tested on segmenting the remaining 25% into “CSF”, “Infarct”, “Cortex” and “White Matter”. Binary segmentation was performed with linear and quadratic discriminant analysis to remove CSF contamination from IVIM perfusion maps. The models were created five different times with five varying random seeds, with various combinations of subject groups, and confusion matrices were generated and used to calculate mean and standard deviation of performance metrics Precision, Sensitivity, and F1 scores.
Volunteer Studies: Presumed healthy volunteers were scanned with and without IR-prep and images were visually inspected to compare IR-Prep to ML and nominal qIVIM.
Acute Stroke Model: Seventeen mongrel canines (20-30 kg) were instrumented under x-ray guidance after which IVIM scans were acquired under normal physiology, after Co2-induced hypercapnia, and after occlusion of the middle cerebral artery.
Results
Simulations: IRSE simulation of CSF suppression with an IR pulse at t = 1850ms was found to reduce blood signal by 82% with TR = 5000ms and the shortest possible TE (37ms) from the scanner (Fig. 1). Longer TE would cause even greater blood signal loss showing that IR should not be used in IVIM to remove CSF.Volunteer Studies: Inversion recovery with varying suppression times was tested on one healthy human subject. Average signal curves and fits were performed on anatomic regions of interest and showed demonstrable difference in exponential behavior (Fig. 2a).
Machine Learning: K-fold LOOCV thresholding returned an optimal threshold with an outer-loop independent dice coefficient of .69 (Fig. 2b). Multi-class segmentation returned highest F1 scores for CSF segmentation (>.93) with both linear and quadratic discriminant analysis. For binary segmentation (Fig. 4), linear discriminant analysis outperformed quadratic discriminant analysis for all physiologic states, and performance was close between all states (Fig. 5a). The linear discriminant analysis machine learning model built from baseline subjects performed best across all physiologic states (Fig. 5b). Hemispheric qIVIM without manual CSF avoidance was compared to gold-standard microsphere perfusion via linear regression, Bland-Altman, and paired Wilcoxon signed rank (Table 1).
Discussion and Conclusion
Simulation suggested IR should not be used in IVIM to remove CSF, and analysis of signal patterns suggested differing signal decay as a method of removing CSF during post-processing. K-fold nested Leave-One-Out Cross-Validation (LOOCV) of a threshold on IVIM mono-exponential coefficient returned strong segmentation success. Application of machine learning linear discriminant analysis from physiologic baseline subjects showed improved image quality and excellent agreement with reference standard microspheres perfusion values. This suggests that CSF may be removed from IVIM with a simple machine learning model during post-processing to return signal strongly correlated with microsphere perfusion.Acknowledgements
Research reported in this publication is supported by NSF Fellowship NSF DGE-1746045, NIH Grant R01NS093908, and NIH Training Grant 5R25GM109439-09.References
1. Le Bihan, D., What can we see with IVIM MRI? Neuroimage, 2019. 187: p. 56-67.
2. Kwong, K.K., et al., CSF-suppressed quantitative single-shot diffusion imaging. Magn Reson Med, 1991. 21(1): p. 157-63.
3. Saadat, N., et al., Influence of simultaneous pressor and vasodilatory agents on the evolution of infarct growth in experimental acute middle cerebral artery occlusion. J Neurointerv Surg, 2020.
Figures
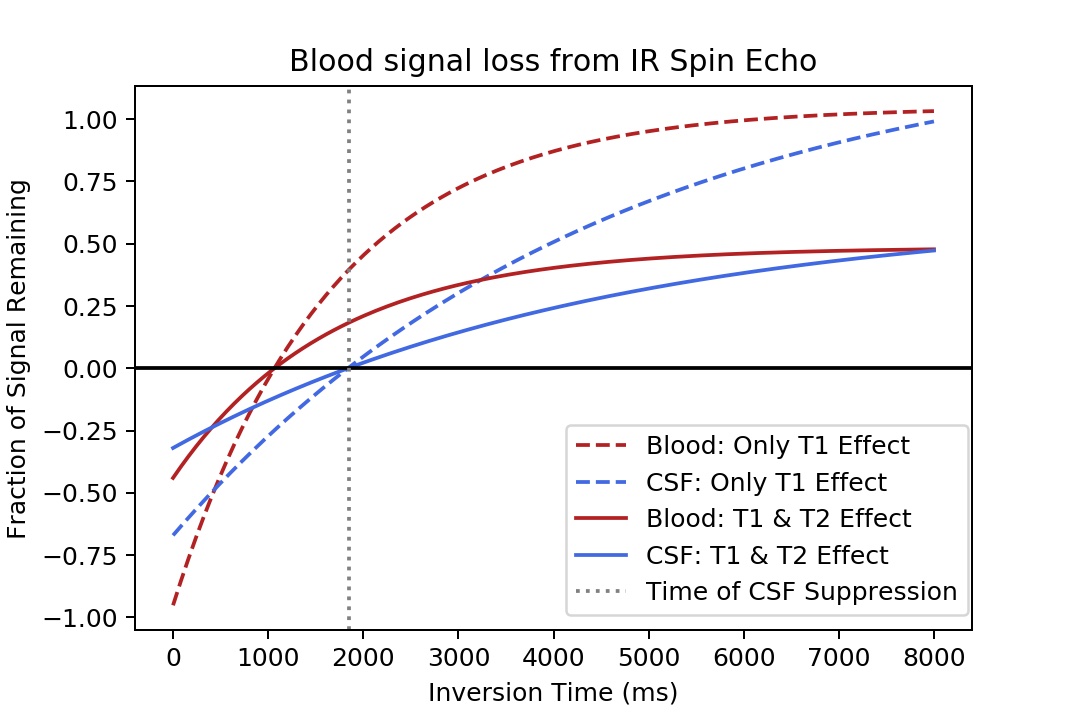
Figure 1. IR SE CSF suppression simulation of remaining transverse signal from CSF and blood taking both T1 and T2 effects into account. Notice: blood suppressed to 18% of original signal.
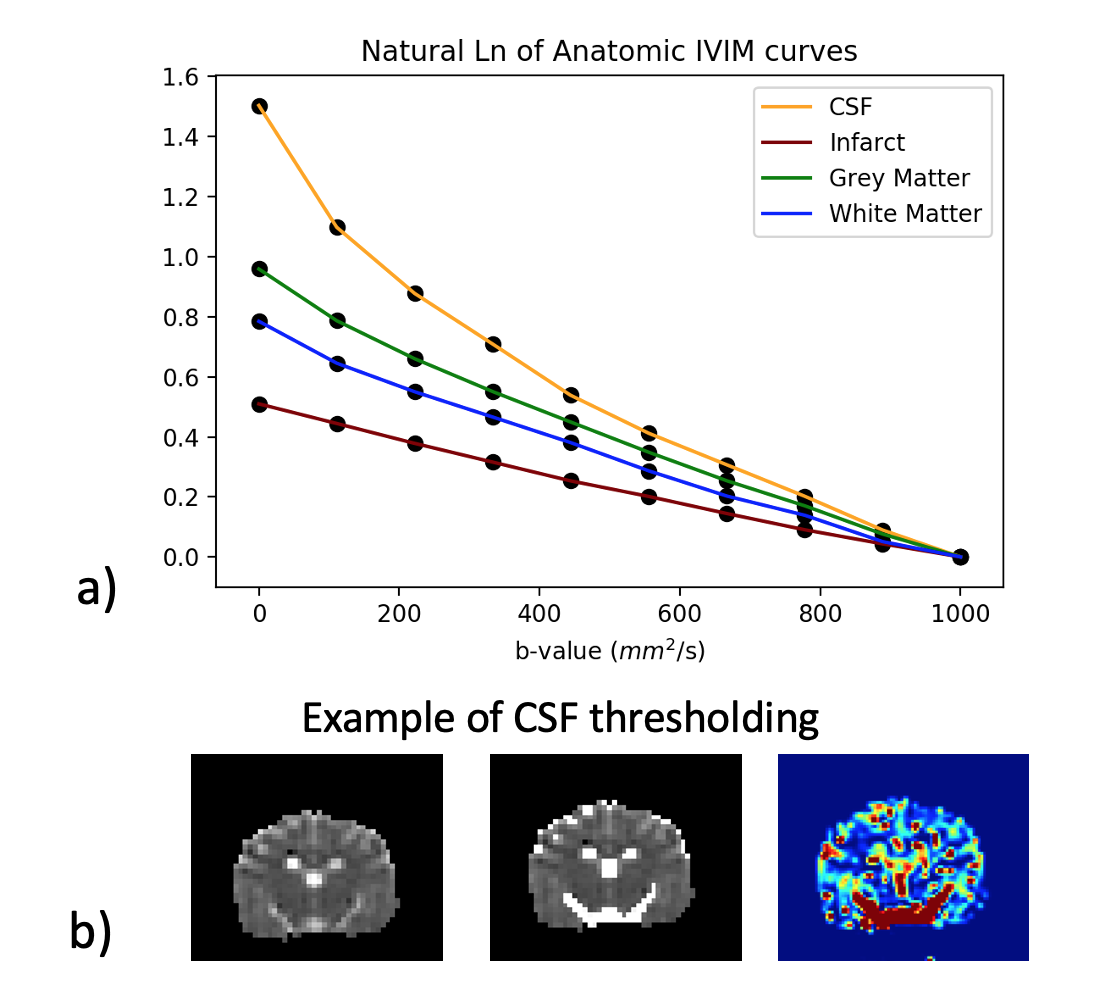
Figure 2. a) Natural log of averaged IVIM curves of anatomic ROIs on human volunteer across b-values and normalized to b=1000. Note lack of perfusion in infarct (no bi-exponential) and potential tri-exponential behavior of CSF. b) An example of the DWI and IVIM perfusion of a canine subject; IVIM mono-exponential (left) with CSF mask from nested LOOCV threshold imposed (middle), and corresponding IVIM perfusion map (right).
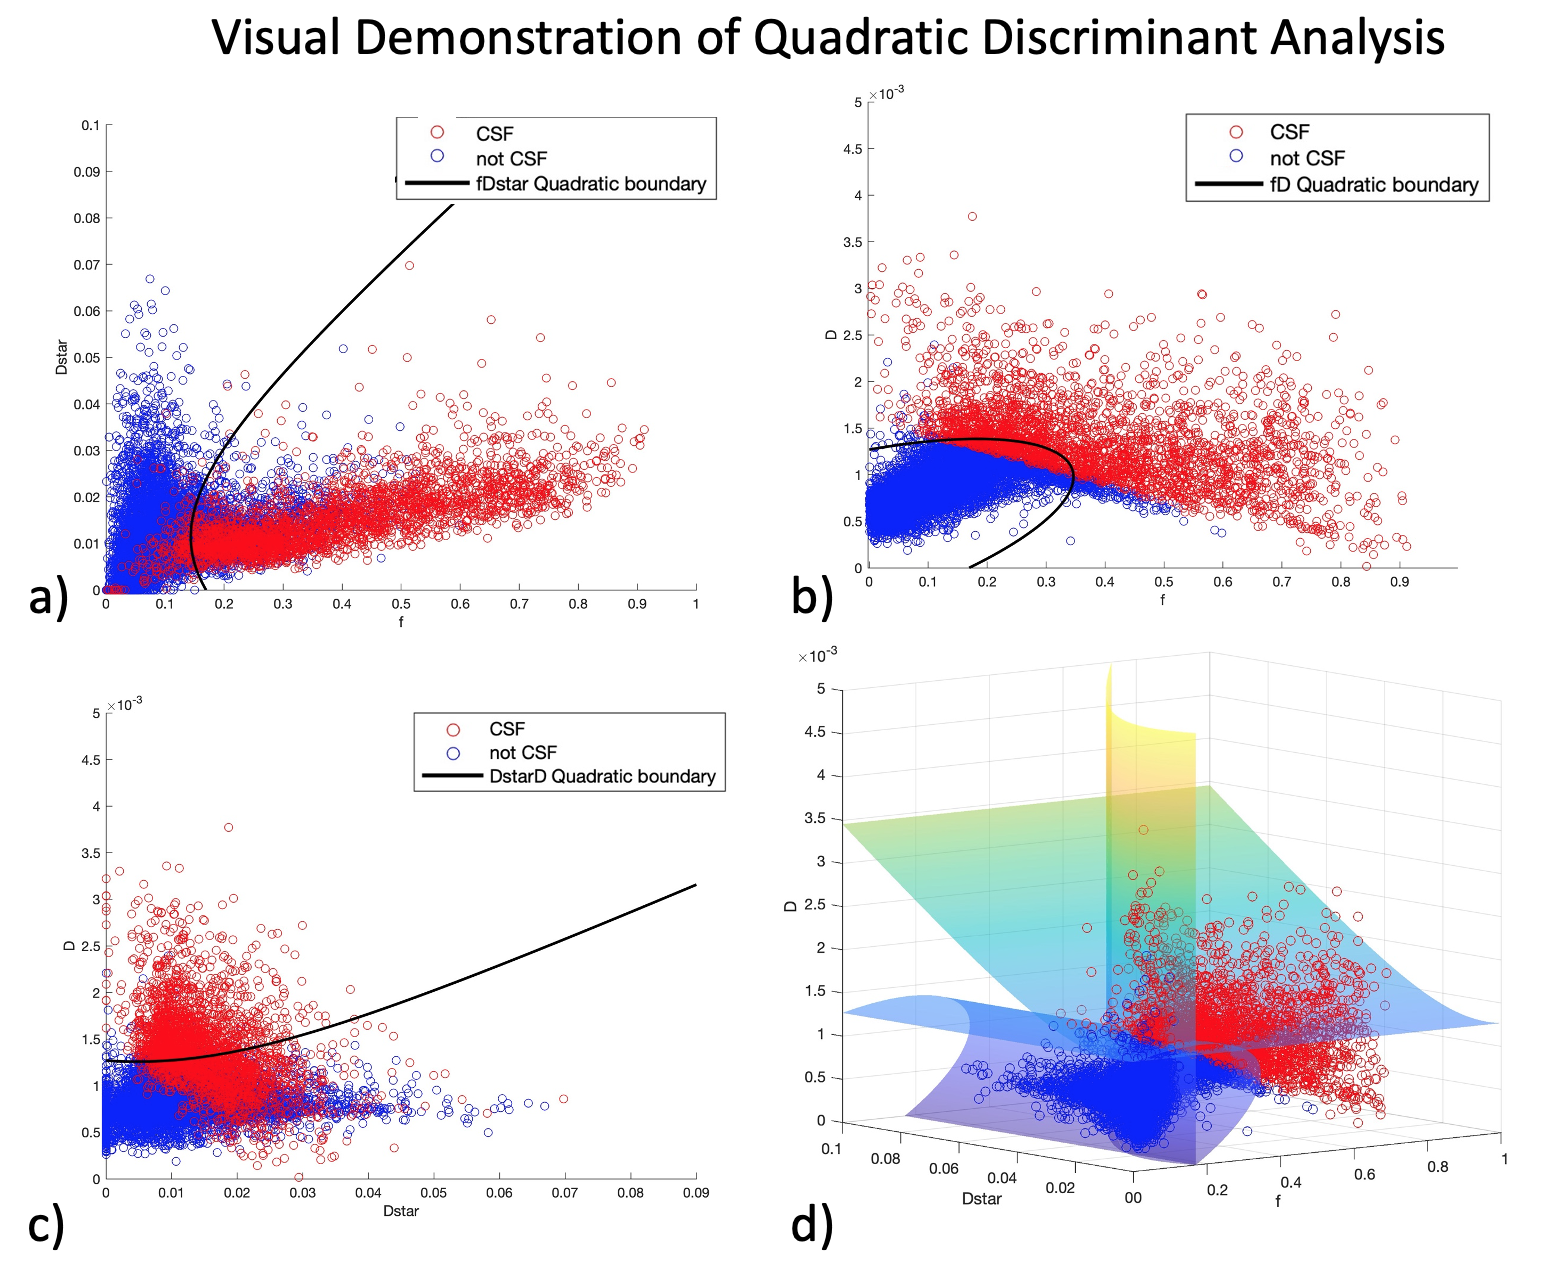
Figure 3. Supervised Machine learning via binary quadratic discriminant analysis of CSF (red) and non-CSF (blue) with boundaries between three IVIM parameters (f, D*, D). Figures a-c show projections of the quadratic discriminant lines between the three combinations of parameters. Figure d) shows the 3D discriminant planes. Data from all physiologic states is shown here.
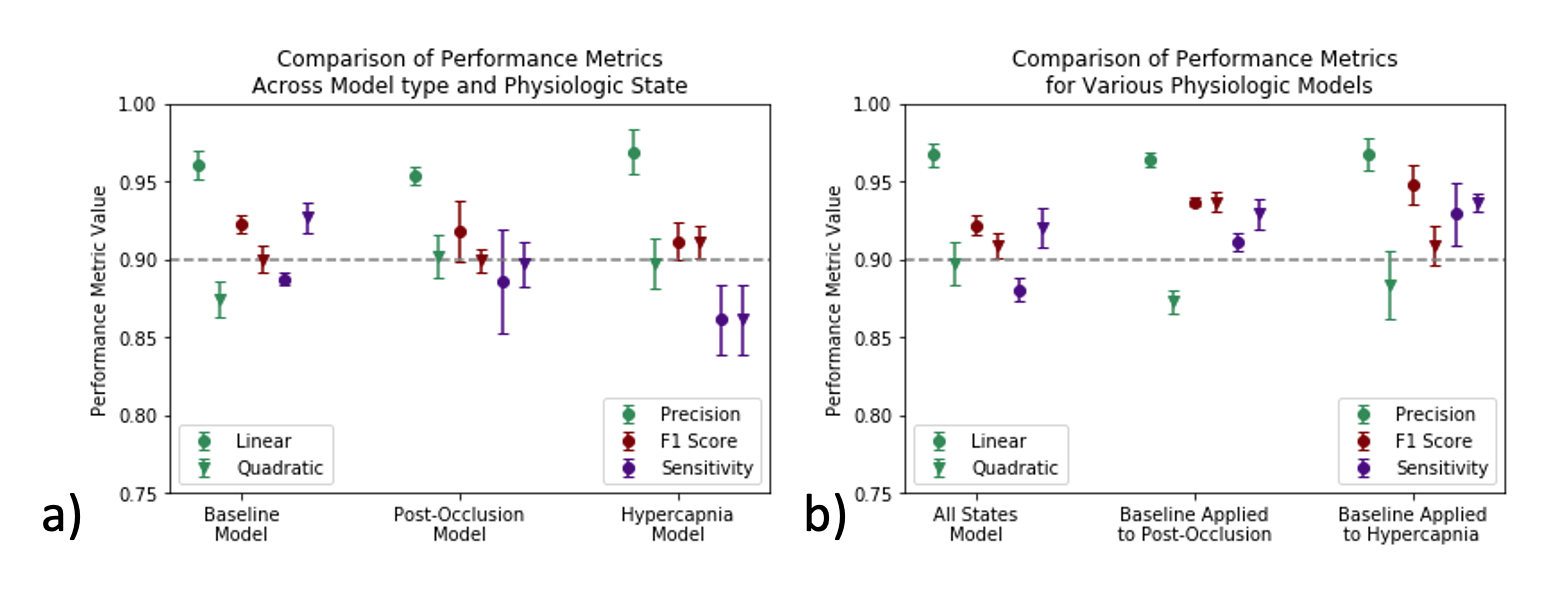
Figure 4. Binary segmentation of CSF performance metrics a) within physiologic states and b) all states and baseline applied to post-occlusion and hypercapnia. Precision (green), F1 score (red), sensitivity (purple) from linear (circle) and quadratic (triangle) discriminant analysis. Notice: high overall F1 scores, superior performance of linear model, and superior application of baseline model on all states for CSF segmentation.
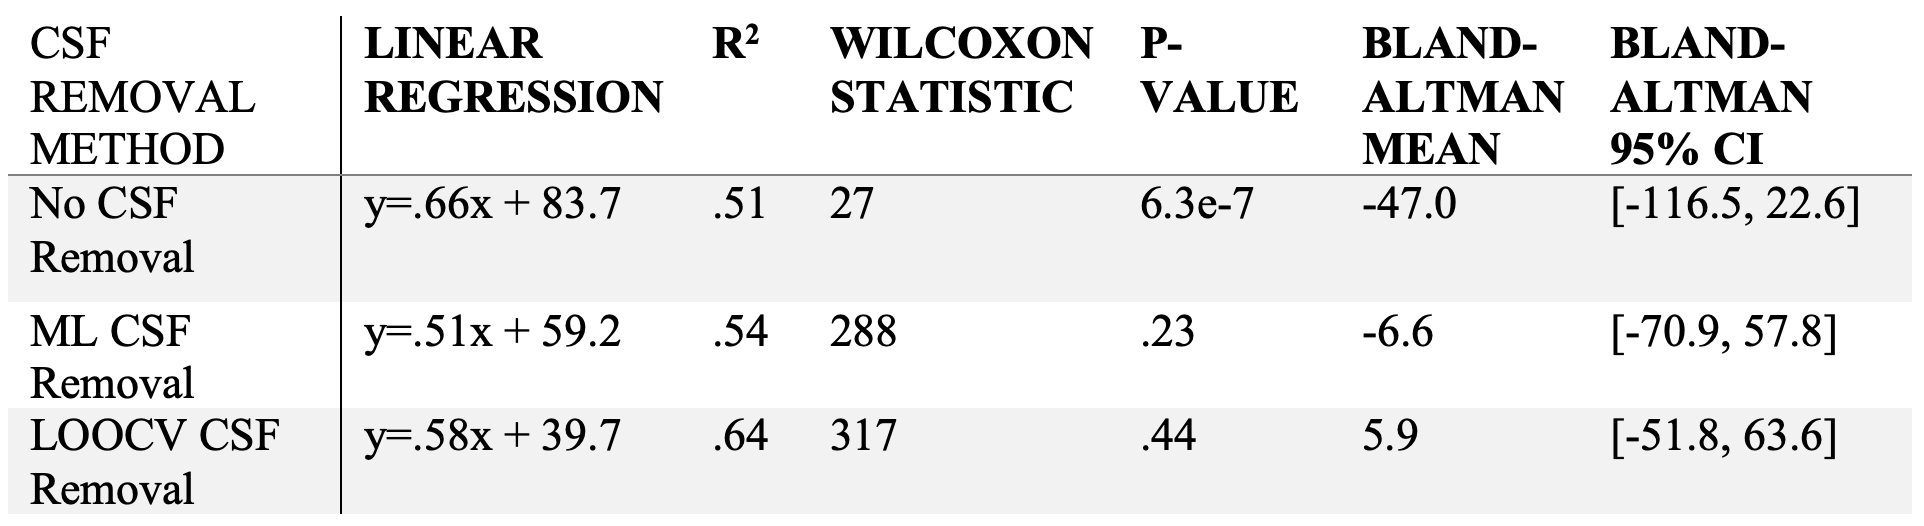
Table 1. Linear regression with corresponding correlation coefficient, Wilcoxon signed rank and corresponding p-value, and Bland-Altman mean and 95% CI of hemispheric statistical comparison between qIVIM with various methods of CSF removal during post-processing and neutron capture microsphere perfusion.
DOI: https://doi.org/10.58530/2023/3187