3183
Fluid mechanics based distinct cerebrospinal fluid dynamics signature in normal pressure hydrocephalus
Pragalv Karki1, Petrice M Cogswell1, Matthew C Murphy1, Sandeep K Ganji1, Jonathan Graff-Radford2, David T Jones2, Benjamin D Alder2, and John Huston III1
1Department of Radiology, Mayo Clinic, Rochester, MN, United States, 2Department of Neurology, Mayo Clinic, Rochester, MN, United States
1Department of Radiology, Mayo Clinic, Rochester, MN, United States, 2Department of Neurology, Mayo Clinic, Rochester, MN, United States
Synopsis
Keywords: Neurofluids, Brain, Cerebrospinal fluid dynamics
Normal pressure hydrocephalus (NPH) is a brain pathology with enlarged ventricles and is diagnosed as a cerebrospinal fluid (CSF) dynamics disorder based on a delayed ascent of radiotracer over the cerebral convexity and elevated flow through the cerebral aqueduct. In this study, we provide fluid dynamics-based evidence of disruption in CSF oscillation within the cerebral aqueduct in NPH patients. Particularly, we show that the peak volumetric flow is delayed with respect to peak transmantle pressure in NPH patients as compared to healthy control participants.INTRODUCTION
Cerebrospinal fluid (CSF) disorders, such as hydrocephalus1 and idiopathic intracranial hypertension2, are characterized by a disruption of CSF regulation in the brain. Normal pressure hydrocephalus (NPH) is a paradigmatic example of a CSF dynamics disorder diagnosed by delayed ascent of radiotracer over the cerebral convexity during a nuclear medicine cisternogram3,4,5 and increased flow through the cerebral aqueduct on phase contrast MRI6. The cerebral aqueduct or the aqueduct of Sylvius is the conduit through which CSF flows through the intracranial compartments. The main goal of this study was to evaluate if the CSF flow through the cerebral aqueduct has a unique fluid mechanics signature in NPH.METHODS
The study included 18 patients, 6 each cognitively unimpaired (CU), Alzheimer’s disease (AD), and NPH groups. The mean age of participants was 78.8±3.8 in CU, 76.2±3.4 in AD, and 75.8±3.3, with 3 female participants in CU, 2 in AD, and 1 in CU. Imaging was performed on a 3T Philips system. The protocol included a real-time echo-planar-based phase contrast acquisition at the cerebral aqueduct and sagittal high spatial resolution highly T2-weighted imaging of the midline structures. The phase contrast data was retrospectively gated using pulse oximeter recording, and the volumetric flow of CSF (density $$$\rho \approx 10^{-3} \text{kg/m}^{3}$$$ and kinematic viscosity $$$ \nu \approx 0.71\times10^{-6} \text{m}^{2}/\text{s}$$$) through the aqueduct calculated for multiple cardiac cycles. The data was averaged to get the flow in one cardiac cycle. The length $$$L$$$ and radius $$$r$$$ of the aqueduct was measured from the high resolution T2-weighted sequence using a multi-planar reformatting tool (Figure 1). The flow data and measurements were then input into a model that calculated pressure across the aqueduct for a cardiac cycle using a boundary layer formulation and axisymmetric Navier-Stokes equations7, which outputs non-dimensionalized volume $$$\overline{V}(t)$$$ and pressure $$$\overline{P}(t)$$$ over a cardiac cycle. The quantities with dimensions can be recovered through $$$P(t)=\rho \omega^{2} L_{s} L \overline{P}(t)$$$ and $$$V(t)=\omega V_{s} \overline{V}(t)$$$, where $$$\omega$$$ is the cardiac frequency, $$$V_{s}$$$ is the stroke volume and $$$L_{s}=V_{s}/\pi r^{2}$$$ is the characteristic stroke length. The model has been used to study age and aqueductal dimension related effects on transmantle-pressure8. The aqueductal dimensions were measured from brain MRI scans of the individuals as shown in Figure 1. The absolute values of the peak pressure and volume are reported for the caudal and the cranial cycle where the caudal direction was defined to be positive. The difference between the peak pressure and the peak volume during the caudal cycle reported in % cardiac cycle was defined as the phase lag $$$\phi$$$. For the two-sample Welch’s t-test, p-value of 0.01 and less was considered significant.RESULTS
The cardiac pulsation drives CSF into the brain through the cerebral aqueduct. The pressure difference between the third and fourth ventricles, $$$P(t)=P_{3}(t)-P_{4}(t)$$$, facilitates the volumetric CSF flow $$$ V(t)$$$ in the aqueduct. The time-dependent non-dimensionalized pressure difference $$$\overline{P}(t)$$$ and the volumetric flow $$$\overline{V}(t)$$$ for the groups plotted versus the cardiac cycle are shown in Figure 2. When the pressure difference changes in sign between caudal and cranial cycle, there is a slight time lag between the peak pressure difference and the peak volume as the transition cannot be instantaneous. That quantity defined as the phase lag $$$\phi$$$ is illustrated in the last panel of Figure 2. The absolute peak values for the pressure and volume during the caudal and the cranial cycles are shown in the left and the middle panels of Figure 3, respectively. The phase lag values shown on the right panel of Figure 3 demonstrates significantly higher phase lag in NPH patients compared to the CU with Welch’s t-test value of p<0.01.DISCUSSION
NPH is a CSF dynamics disorder. The increased phase lag in NPH we report in this study provides a fluid dynamics description of the disorder shedding further light into the physiopathology of NPH. The phase lag could be an important quantity to study in other CSF dynamics disorders as well.CONCLUSION
NPH is a brain pathology with enlarged ventricles with demonstrated alteration in the brain viscoelastic properties9. In this study, we have shown that CSF dynamics is also altered in NPH hinting towards a possible underlying connection with brain viscoelasticity. In addition to the trend of elevated mean volumetric flow through the cerebral aqueduct in NPH, we show that the phase lag between the peak pressure and the peak volumetric flow is significantly higher in NPH. The result motivates further fluid dynamics-based studies in NPH. One interesting direction would be to analyze the phase lag between before and after shunt surgery in cases of NPH to assess if the value normalizes after surgery.Acknowledgements
We are thankful for Dr. Stephanie Sincomb providing us with the model for the pressure calculations performed in this study and for prompt feedback on pertinent questions.References
- Farb R, Rovira À. Hydrocephalus and CSF Disorders. 2020 Feb 15. editors: Hodler J, Kubik-Huch RA, von Schulthess GK. Diseases of the Brain, Head and Neck, Spine 2020–2023: Springer; 2020. Chapter
- PMID: 32119247. 2. Janny P, Chazal J, Colnet G, Irthum B, Georget AM. Benign intracranial hypertension and disorders of CSF absorption. Surg Neurol. 1981 Mar;15(3):168-74.
- D.H. Patten, D.F. Benson. Diagnosis of normal-pressure hydrocephalus by RISA cisternography. J. Nucl. Med., 9 (1968), pp. 457-461
- A.E. James, F.H. DeLand, F.J. Hodges, H.N. Wagner. Normal-pressure hydrocephalus Role of cisternography in diagnosis. JAMA, 213 (1970), pp. 1615-1622.
- D.C. McCullough, J.C. Harbert, G. Di Chiro, A.K. Ommaya. Prognostic criteria for cerebrospinal fluid shunting from isotope cisternography in communicating hydrocephalus. Neurology, 20 (1970), pp. 594-598.
- P.H. Luetmer, J. Huston, J.A. Friedman, G.R. Dixon, R.C. Petersen, C.R. Jack, R.L. McClelland, M.J. Ebersold. Measurement of cerebrospinal fluid flow at the cerebral aqueduct by use of phase-contrast magnetic resonance imaging: technique validation and utility in diagnosing idiopathic normal pressure hydrocephalus. Neurosurgery, 50 (2002), pp. 534-543 \
- Sincomb, S., Coenen, W., Sánchez, A., & Lasheras, J. (2020). A model for the oscillatory flow in the cerebral aqueduct. Journal of Fluid Mechanics, 899, R1. doi:10.1017/jfm.2020.463
- S.J. Sincomb, W. Coenen, E. CriadoHidalgo, K. Wei, K. King, M. Borzage, V. Haughton, A.L. Sánchez, J. C. Lasheras. Transmantle Pressure Computed from MR Imaging Measurements of Aqueduct Flow and Dimensions. American Journal of Neuroradiology Oct 2021, 42 (10) 1815-1821.
- M. Murphy, P. Cogswell, J. Trzasko, A. Manduca, M. Senjem, F. Meyer, R. Ehman, and J. Huston, Identification of normal pressure hydrocephalus by disease-specific patterns of brain stiffness and damping ratio, Investigative Radiology 55, 200 (2020).
Figures
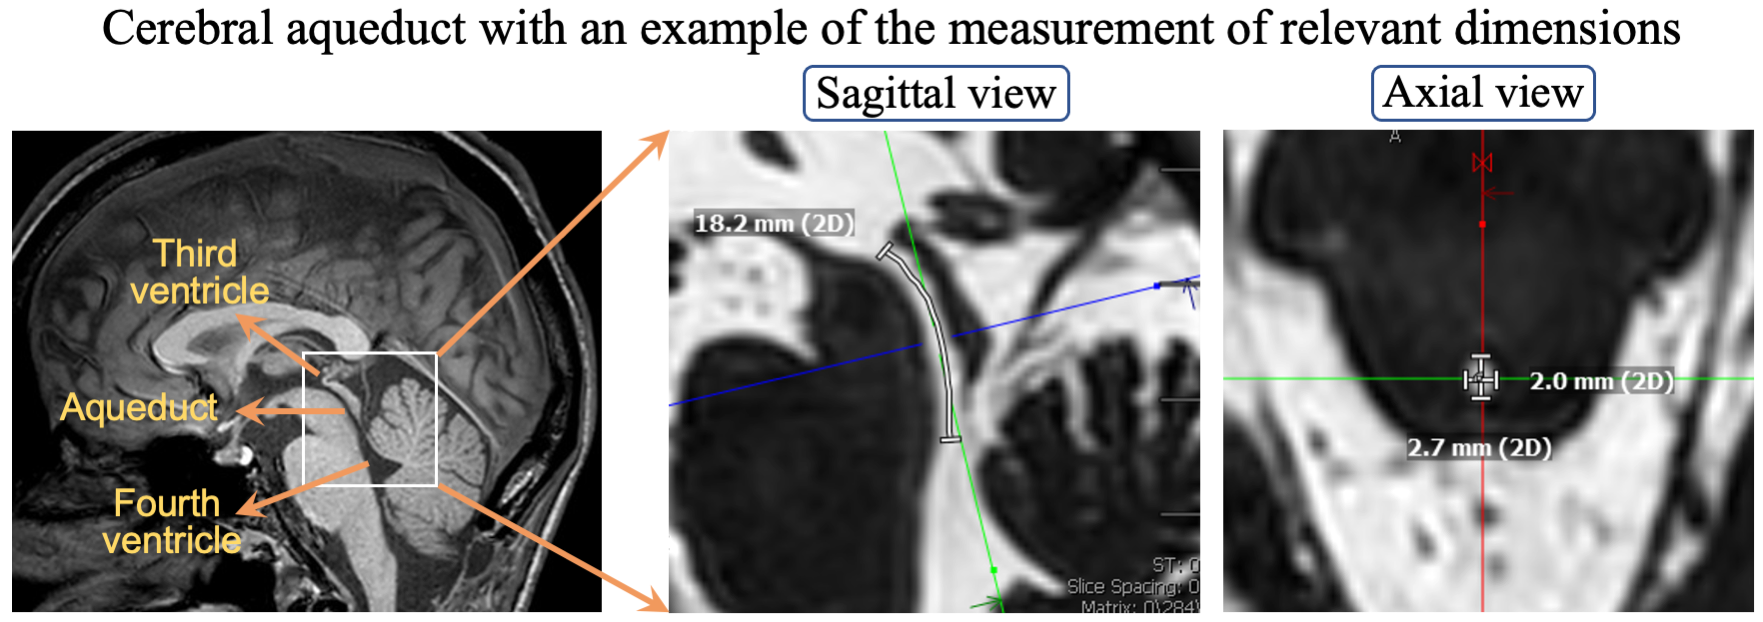
Figure 1. Cerebral aqueduct with the
sagittal and the axial view of high spatial resolution highly T2-weighted
imaging of the cerebral aqueduct in one AD participant. The third ventricle,
aqueduct, and the fourth ventricle are shown in the left figure. The length of
the aqueduct is measured to be 18.2 mm in this case. The right figure shows the
axial view and the diameter measurements of the aqueduct in two directions. The
radius of the aqueduct is taken as the mean of the radius measured from the two
diameters
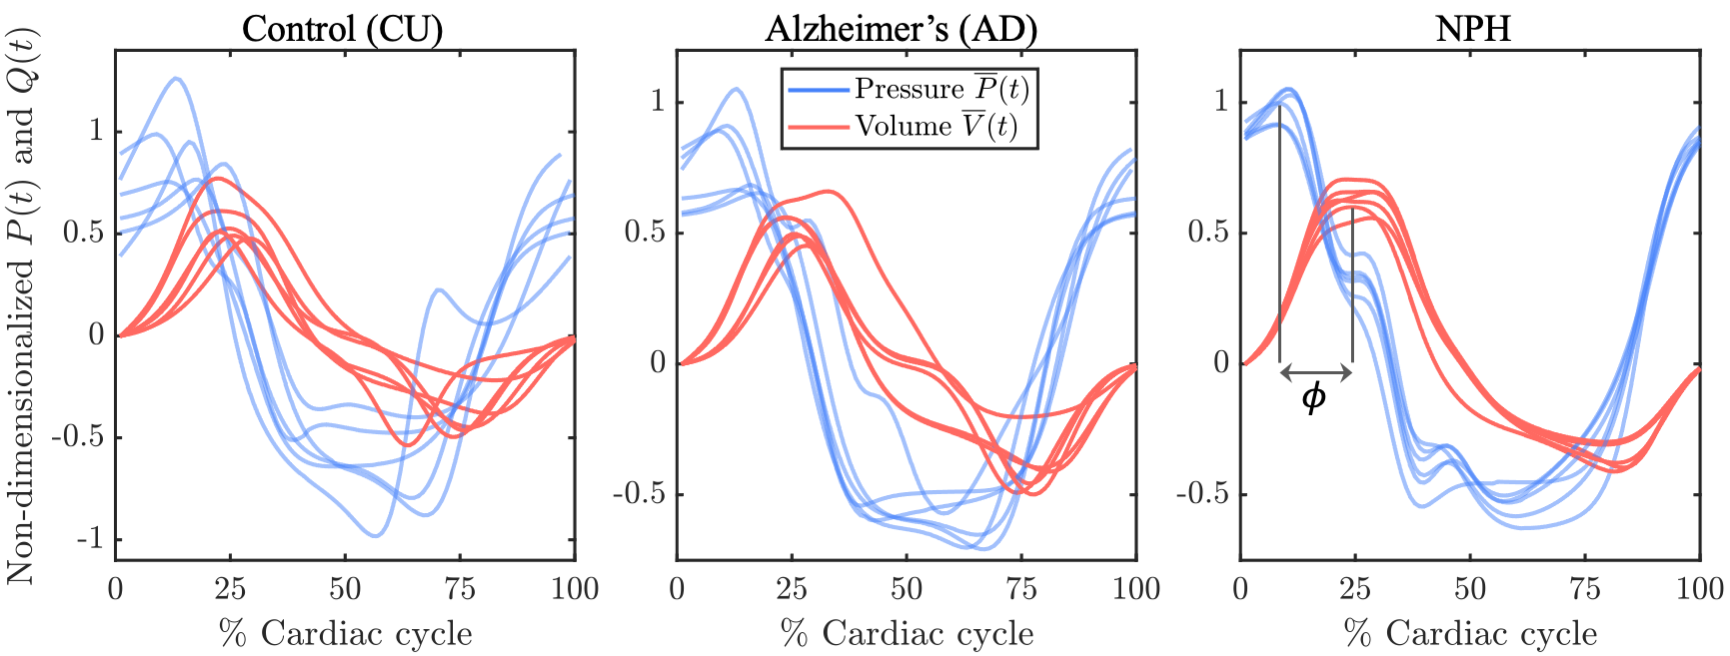
Figure 2. Non-dimensionalized
pressure differences and the volumetric flow across the aqueduct versus the
cardiac cycle for the three groups CU, AD, and NPH, respectively. The legend in
the middle panel and the y-axis label in the left panel is shared by all
panels.
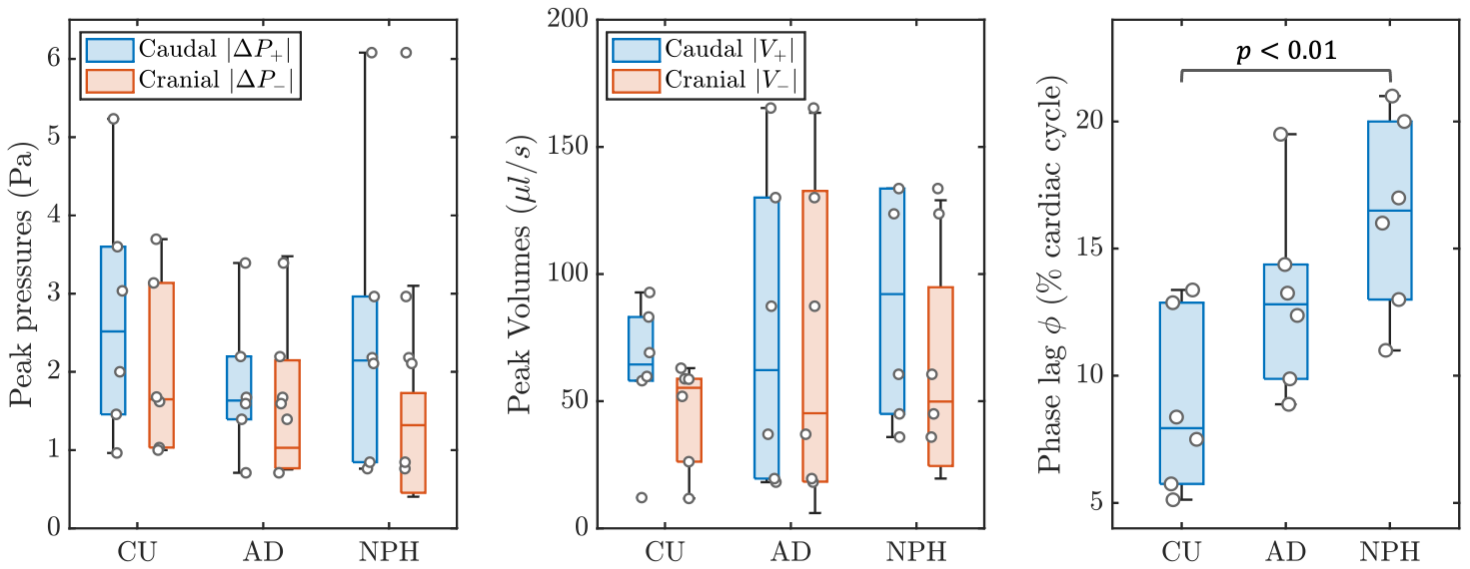
Figure 3. Absolute values of peak
pressure (Pa) and volumetric flow ($$$\mu l/s$$$) for the caudal and cranial
cycle are shown in the left and the middle panel, respectively. The right panel
is the phase lag between the peak pressure and the peak volume
in the caudal cycle. Welch’s t-test p-value
between the relevant groups is shown in the figure.
DOI: https://doi.org/10.58530/2023/3183