3181
CO2 as an engine for neuro-fluid flow1Center for Imaging Science, UMC Utrecht, Utrecht, Netherlands, 2Purdue University, West Lafayette, IN, United States, 3Radiotherapy, UMC Utrecht, Utrecht, Netherlands
Synopsis
Keywords: Neurofluids, Neurofluids
We use Blood Oxygen Level Dependent BOLD in combination with controlled hypercapnic stimulus to investigate the relationship between presumed cerebral blood volume changes and CSF flow in the brain. In a group of 11 subjects, we observe strong CSF inflow to the brain as a result of contracting cerebro-vasculature conforming to the Monro-Kellie Doctrine. Our results suggest that changes in arterial blood gases may provide an ‘engine’ through which to potentially enhance the clearance of waste from the brain.Introduction
The high metabolic rate of the brain requires an effective clearance mechanism to remove byproducts and maintain homeostasis. However, the brain lacks a conventional lymphatic system, which in the rest of the body collects and clears metabolic waste. Although the exact pathways of brain waste clearance remain controversial, cerebrospinal fluid (CSF) and interstitial fluid (ISF) are generally considered as major carriers of waste products. To date, most research on brain clearance has been limited animal research where findings have focused on arterial dynamics such as heartbeat and vasomotion as critical motive forces of clearance (by propelling CSF and ISF)1,2. Van Veluw et al.3 have shown that increasing the amplitude of vasomotion by means of visually evoked vascular responses results in increased clearance rates in the visual cortex of awake mice. In human studies, the low frequency dynamics such as vasomotion4, and slower dynamics as observed in sleep appear to be major drivers of clearance5. This observation raises the speculative, but intriguing, question of whether clearance is evoked by other factors that modulate brain-wide vascular dynamics, such as CO2 breathing challenges. As a first step towards answering this question, we analyzed CSF dynamics in the 4th ventricle following CO2 breathing challenges, and related these observation to the whole-brain BOLD response curves.Methods
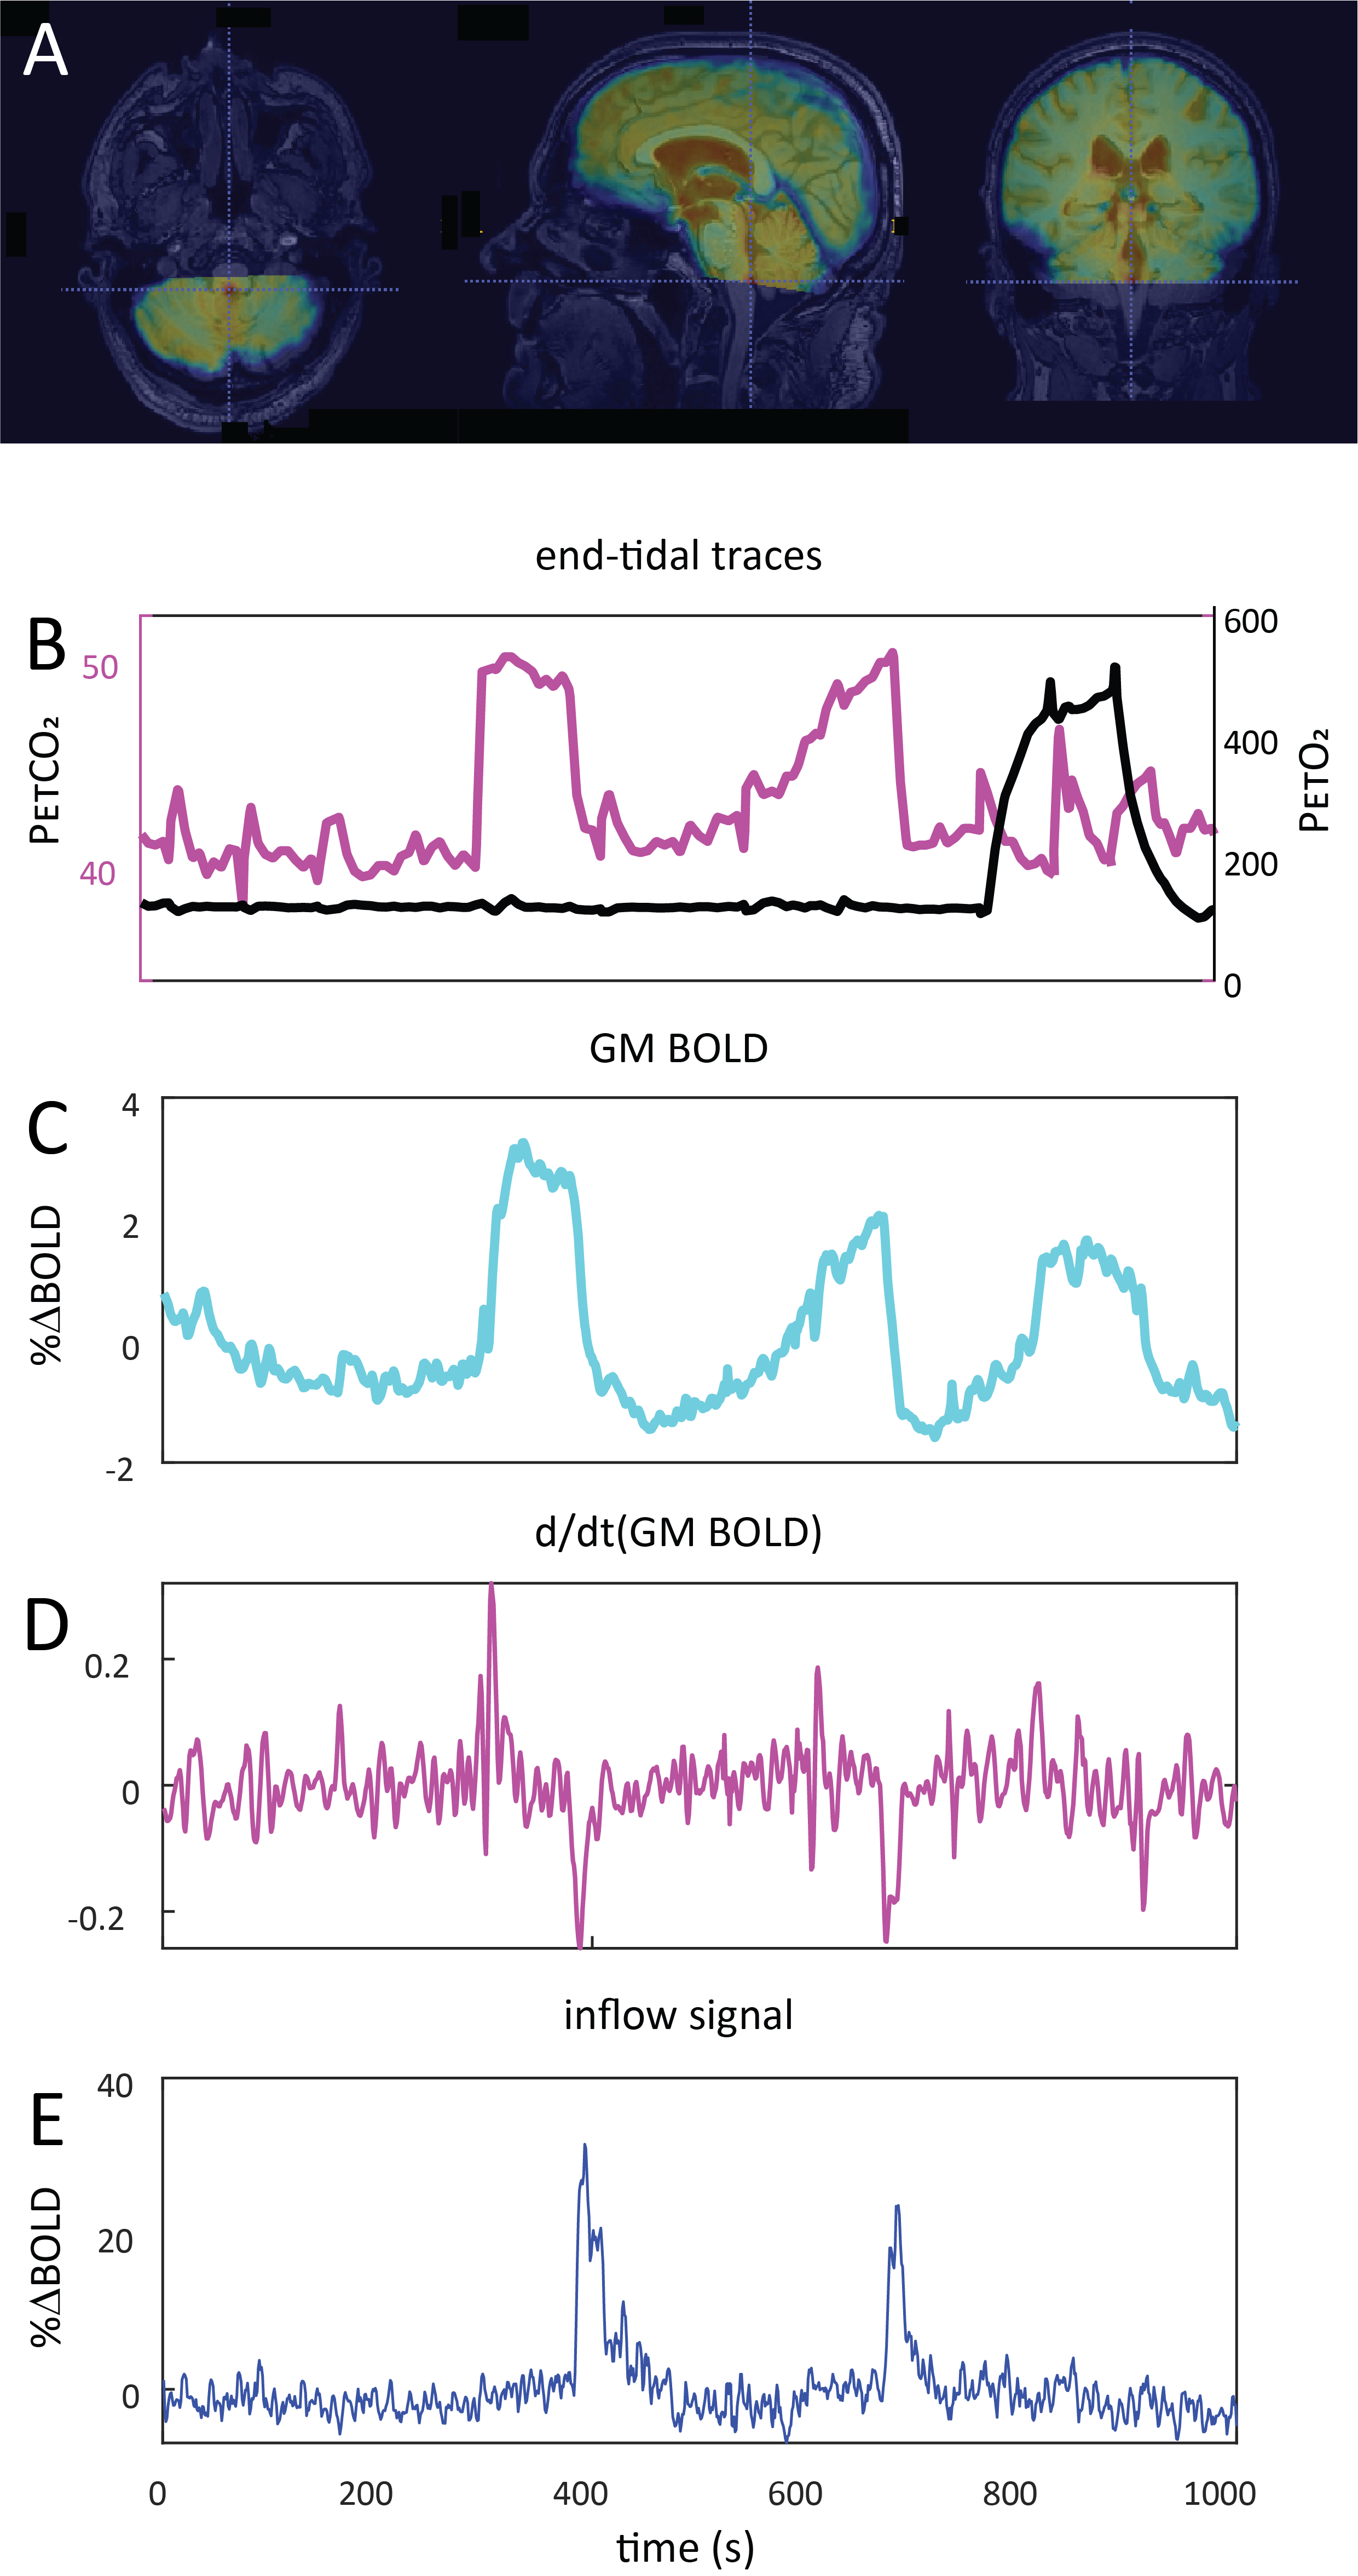
Data Acquisition: Data were retrospectively selected from the ongoing Assessing and Predicting Radiation Influence on Cognitive Outcome using the cerebrovascular stress Test (APRICOT) study. A subset of 11 patients with brain metastases were included who were scanned on a 3T Philips (Best, The Netherlands) system using a multi-slice GE-EPI sequence (BOLD-fMRI) throughout a controlled manipulation of arterial blood gases using a RespirAct system (Thornhill Research, Canada). MRI parameters were: TR=1050ms, TE=30ms, α=65°, resolution=2.292x2.292x2.5mm3, matrix=96x96, slices=51, volumes=1000, multi-band factor=3. The respiratory paradigm consisted of a 5 minute resting-state period followed by a 90s hypercapnic block (+10mmHg), 120s baseline , 180s progressively increasing hypercapnic ramp (max=+12mmHg), 90s baseline, 180s hyperoxic block (target 680mmHg) and final 120s baseline period. Baselines were clamped at individual subject’ resting PetCO2 values (figure 1). In a single subject, CSF inflow was evaluated in response to consecutive 20s inspiratory breath-holds followed by three hypercapnic blocks.Data Processing: MRI data were preprocessed using FSL6. Steps included brain extraction (BET), distortion correction (TOPUP) and temporal realignment (MCFLIRT). Respiratory traces were interpolated to the TR of the MRI scans and a bulk alignment between the average whole brain signal and resampled PetCO2 trace was done using functions from the seeVR toolbox7. The last two slices of the MRI data were used to calculate CSF inflow. Here, a manual segmentation of voxels containing CSF at the 4th ventricle was performed. From here, the voxel containing either the highest magnitude signal or highest temporal noise to signal (tNSR) was manually selected depending on which gave highest contrast. CSF signals were smoothed and de-trended. The grey matter (GM) MRI signal was smoothed and the temporal derivative was calculated as a surrogate for CBV change4. The same was done for the PetCO2 trace (see figs).
Results
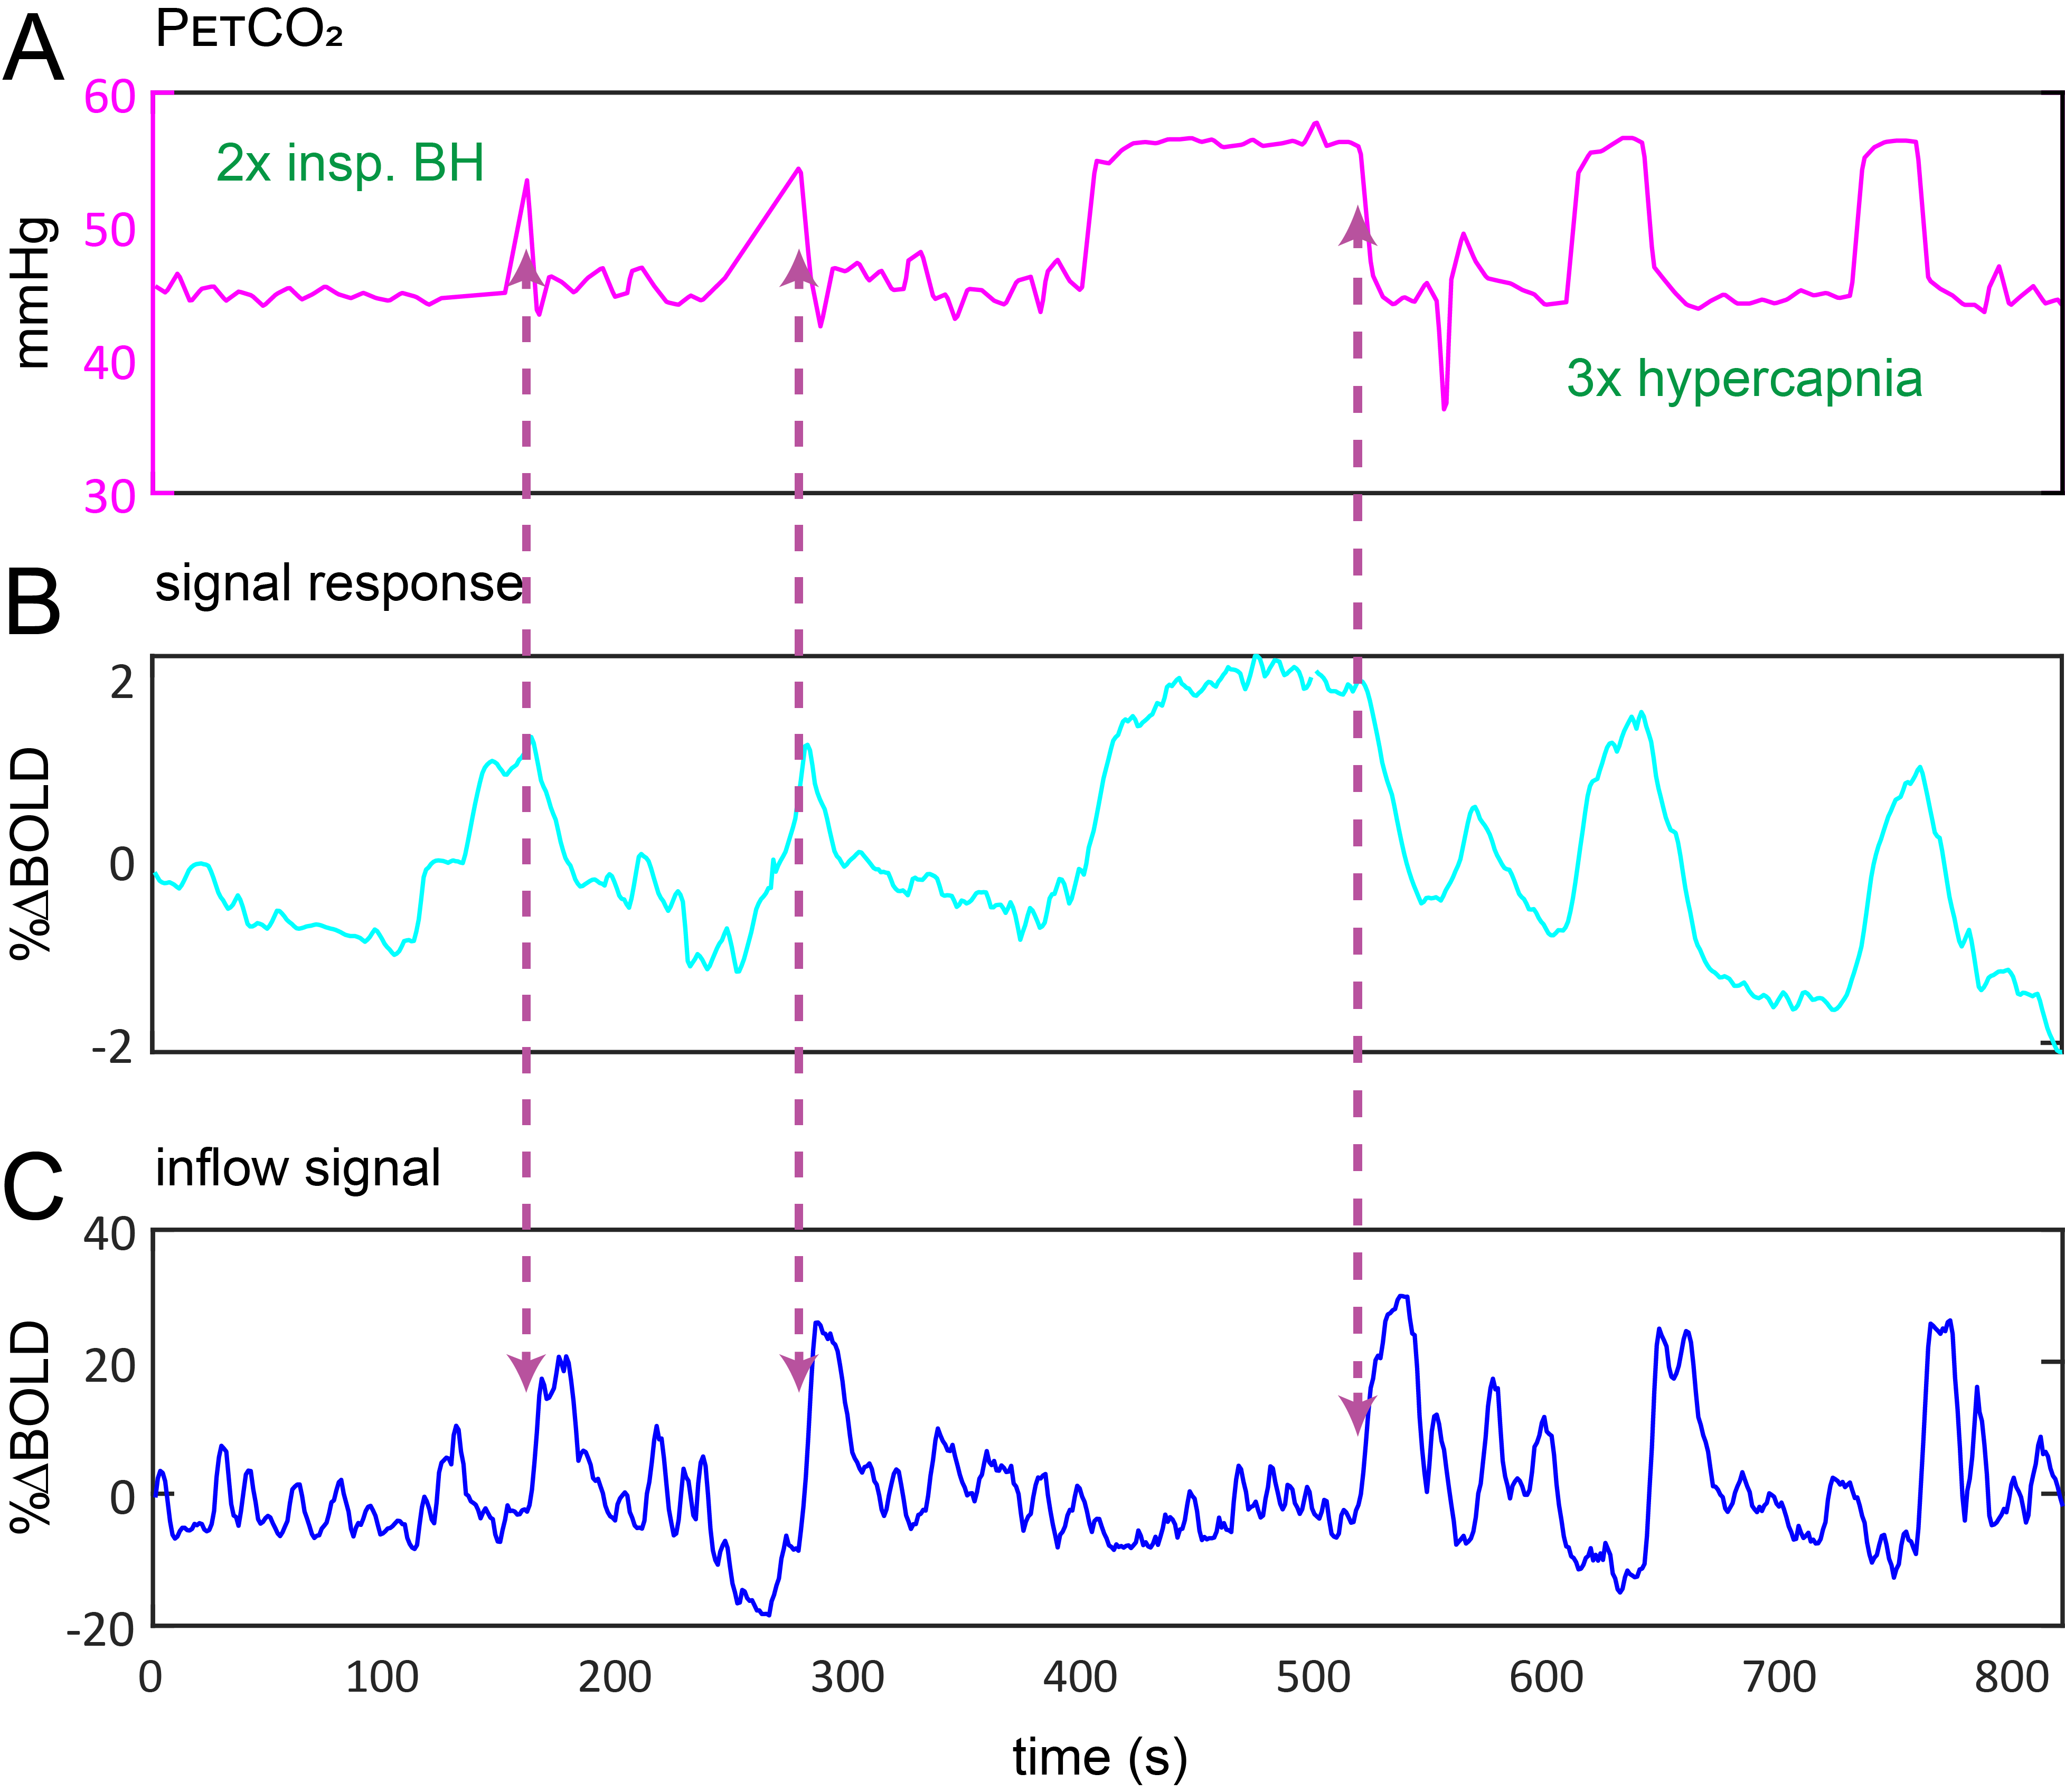
A typical single subject example is shown in figure 1. Group average (n=11) end-tidal traces, BOLD signal responses and their respective time derivatives are shown in figure 2 along with the CSF inflow response. Note that whole CO2 changes result in inflow signal, changes in O2 do not since transient O2 is not vasoactive. The delay between the peak rate of CO2 change and the peak inflow response was 5.1+/-6.0s – this was subject to bulk-alignment errors and averaging of hemodynamic lag effects throughout the GM tissue. The delay between the peak rate of BOLD signal change and the peak inflow response was 1.5+/-1.2 seconds. Finally, although not quite as abrupt, endogenous CO2 accumulation via breath-holding was sufficient to modulate CBV and induce a notable inflow effect (see figure3).Discussion
Our main finding was that changes in arterial CO2 levels, whether through strong controlled stimuli or simple breath-hold, strongly modulate CBV (as measured through the BOLD signal proxy4). This supports the notion that CSF flow (and potentially glymphatic flow) may be driven by vascular mechanisms, and so validates the model proposed by Yang et al. since we not explicitly drive vasodilation4. On a more speculative note, these findings suggest that presumed CVR response delays may be driven, in part, by mechanical resistance related to the excretion of CSF from the intra-cranial space through the 4th ventricle; i.e. space needs to be made for blood. This is suggested by the inverse relationship between inflow and d/dt(GM BOLD).Limitations: In this perspective study, planning of the BOLD acquisition was not always optimal for observing CSF flow at the 4th ventricle. Besides, the patient group exhibited varying degrees of edema as a result of brain metastases and treatment effects, which might have affected the results. Future work should include a prospective study, and ideally should aim to explicitly assess clearance function.
Acknowledgements
No acknowledgement found.References
1. Mestre H, Tithof J, Du T, et al. Flow of cerebrospinal fluid is driven by arterial pulsations and is reduced in hypertension. Nature communications. 2018;9(1):4878.
2. Iliff JJ, Wang M, Zeppenfeld DM, et al. Cerebral arterial pulsation drives paravascular CSF-interstitial fluid exchange in the murine brain. JCBFM 2013;33(46):18190-18199.
3. van Veluw SJ, Hou SS, Calvo-Rodriguez M, et al. Vasomotion as a Driving Force for Paravascular Clearance in the Awake Mouse Brain. Neuron. 2020;105(3):549-561.e545.
4. Yang HS, Inglis B, Talavage TM, et al. Coupling between cerebrovascular oscillations and CSF flow fluctuations during wakefulness: An fMRI study. JCBFM. 2022;42(6):1091-1103.
5. Fultz NE, Bonmassar G, Setsompop K, et al. Coupled electrophysiological, hemodynamic, and cerebrospinal fluid oscillations in human sleep. Science (New York, N.Y.). 2019;366(6465):628-631.
6. Jenkinson M, Beckmann CF, Behrens TE, Woolrich MW, Smith SM. FSL. Neuroimage. 2012;62(2):782-790.
7. Bhogal AA. seeVR: a toolbox for analyzing cerebrovascular reactivity data. Zenodo. 2021;(v1.01).
Figures
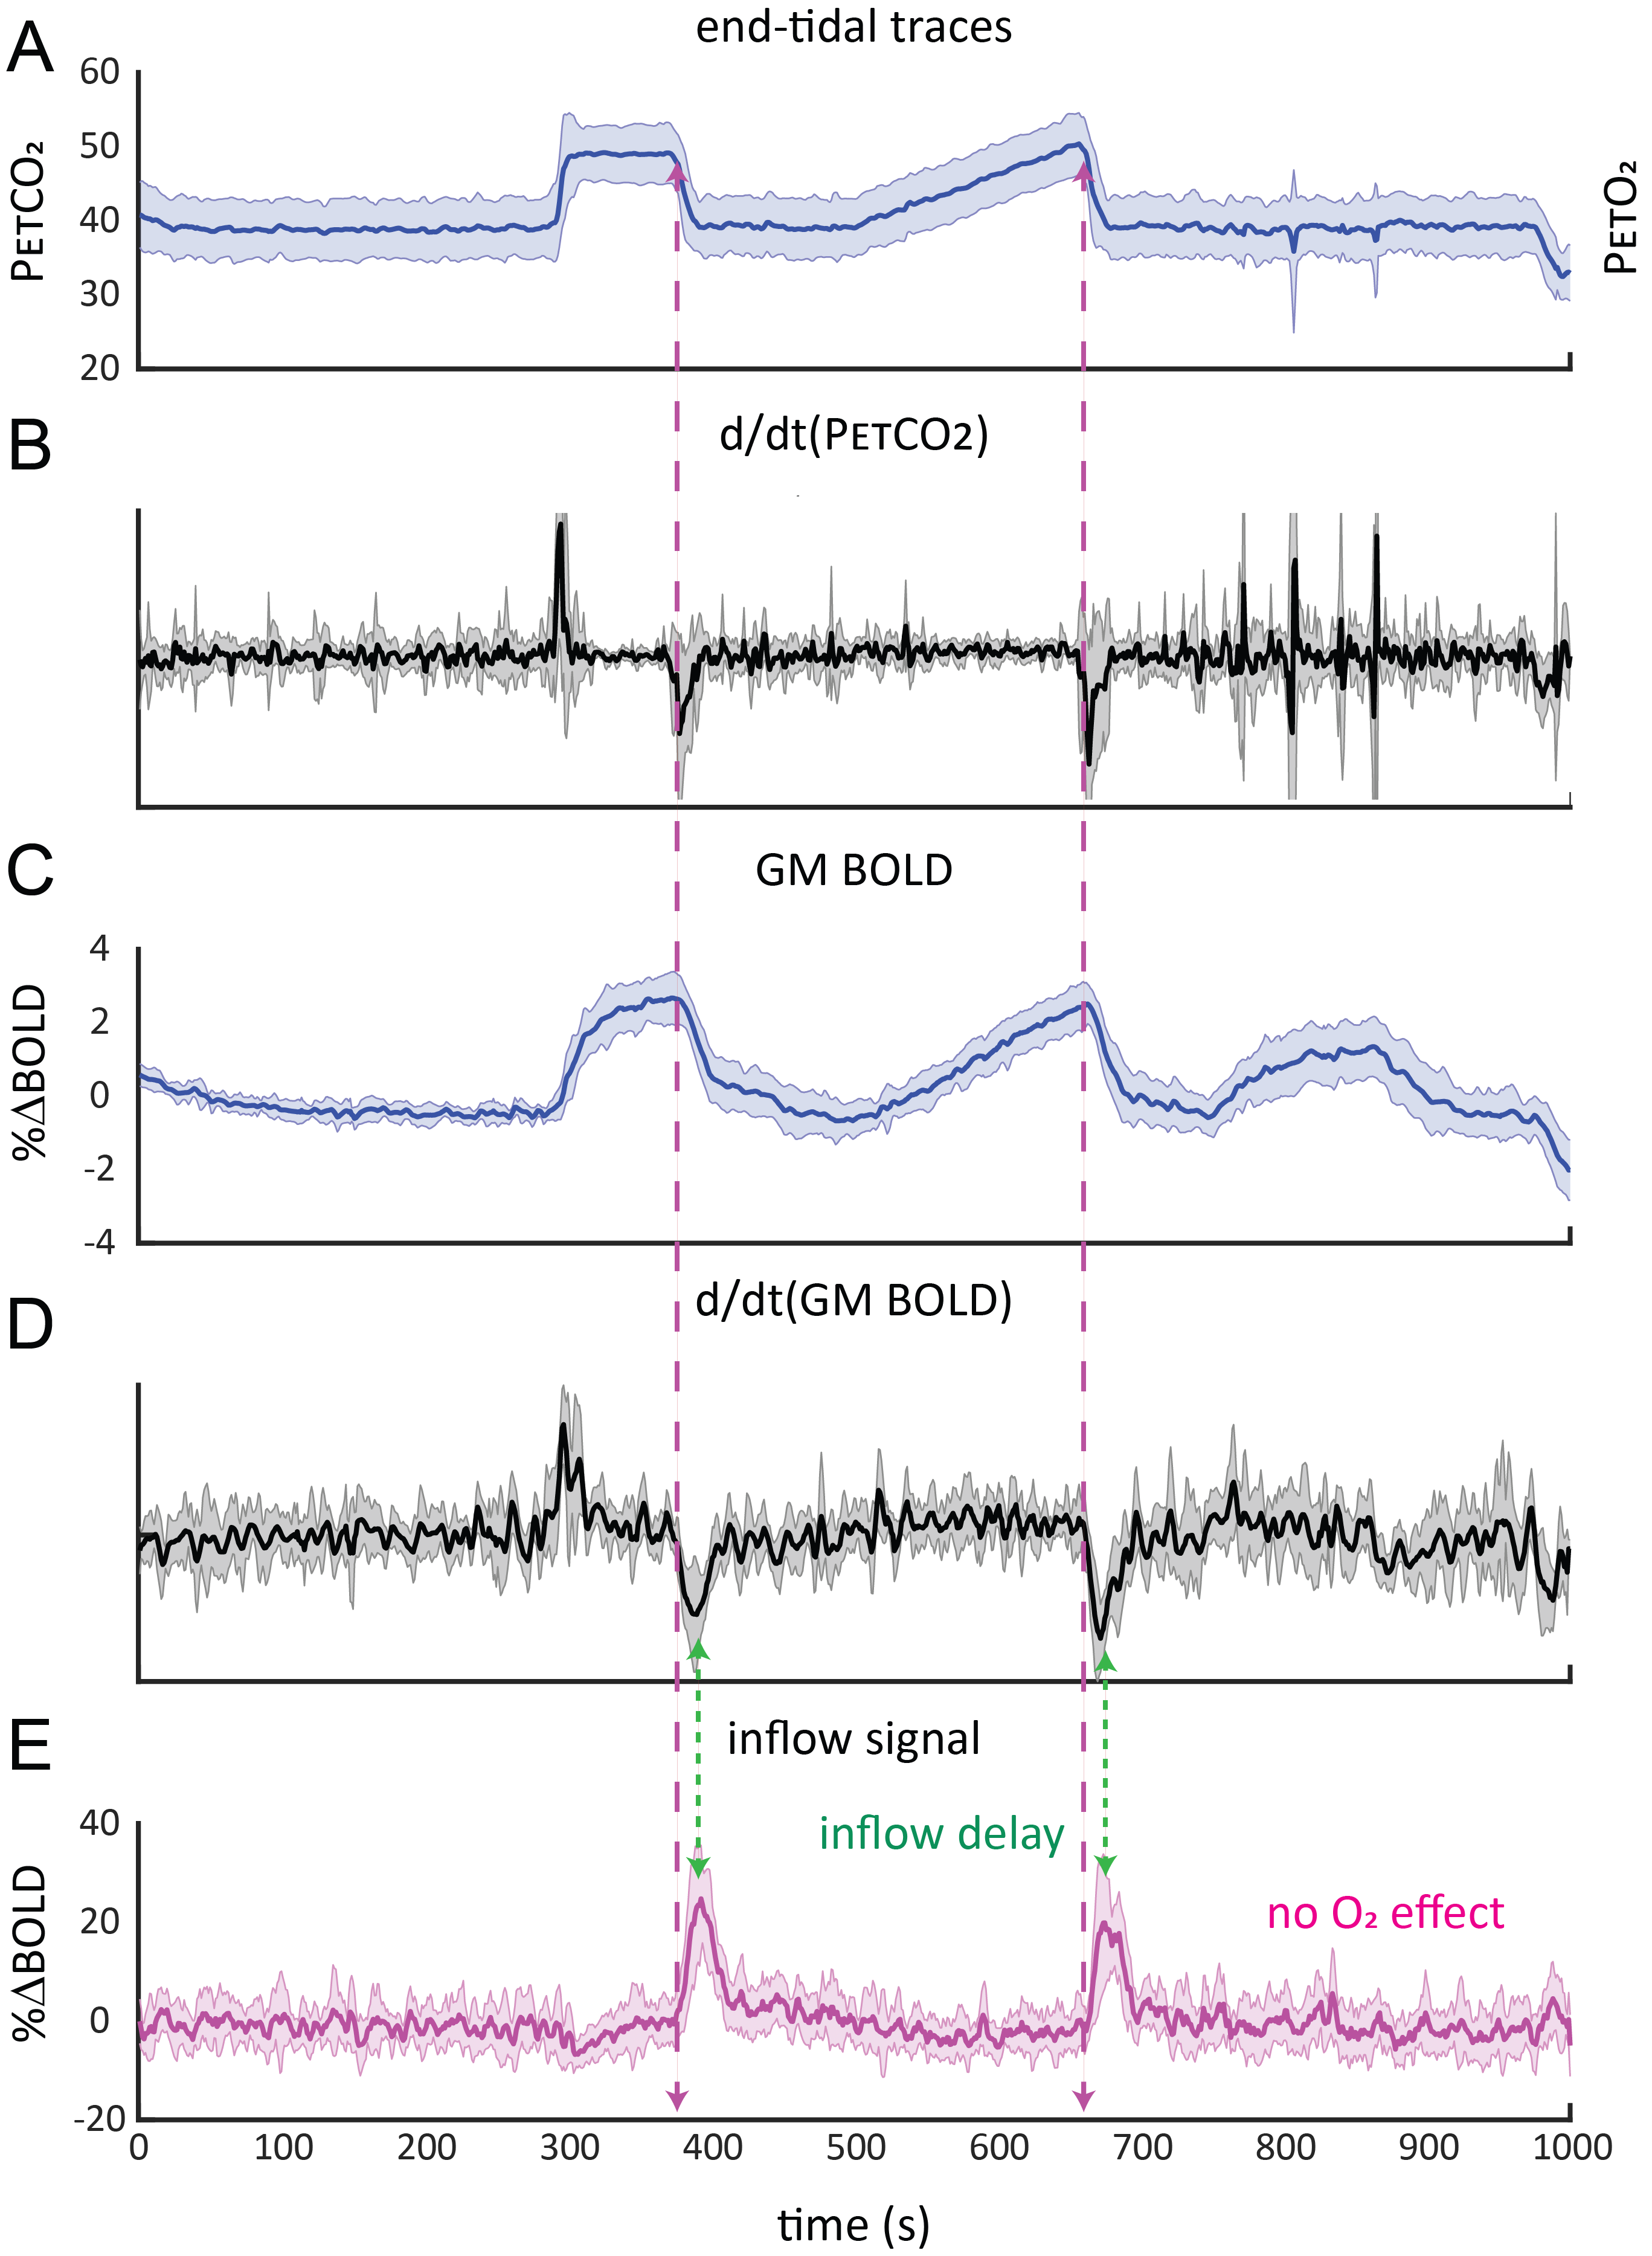
Average responses (n=11):A) group-averaged end-tidal CO2 traces and corresponding time-derivative (B). C) group-averaged BOLD signal response and corresponding time-derivative (D). E) inflow signal resulting from CO2-mediated modulation of CBV. Note the delay between the peak response time-derivative and peak inflow signal and fact that transient O2 produces no inflow effect. Also outflow effects are absent as changes are based on the time-of-flight effect, requiring the inflow of fresh, non-saturated CSF. The shaded areas indicate the standard deviation across subjects.