3178
Perivascular Space Imaging during Therapy for Medulloblastoma1Diagnostic Imaging, St Jude Children's Research Hospital, Memphis, TN, United States, 2Oncology, St Jude Children's Research Hospital, Memphis, TN, United States, 3Pediatric Medicine, St Jude Children's Research Hospital, Memphis, TN, United States, 4Radiation Oncology, St Jude Children's Research Hospital, Memphis, TN, United States
Synopsis
Keywords: Neurofluids, Brain, Perivascular Space Imaging
Patients with medulloblastoma treated with radio-chemotherapy (N=211) were examined by perivascular space (PVS) imaging at three time points: 0, 3, and 12 months. The patients were treated with different dose level based on risk factors. For low dose radiation, there were no significant changes in PVS between time points. A transient increase in PVS was observed for high and standard dose radiation during radiotherapy which subsequently resolved during chemotherapy. Perivascular space imaging is a potential biomarker to monitor the side effects from combined modality therapy.
INTRODUCTION
Medulloblastoma (MB) is the most common malignant brain tumor in children accounting for approximately 20% of all brain tumors1. Post-operative craniospinal irradiation (CSI) and post-irradiation systemic chemotherapy has a long-standing role in the adjuvant treatment of MB2. With improved rates of long-term survival, the toxicity of combined modality therapy is a major concern3. Perivascular spaces (PVS) are fluid filled compartments surrounding the small blood vessels in the brain. They play an important role in the brain glymphatic clearance system4. Recent studies show that enlarged PVS may be an indicator of increased risk of stroke5,and have also been observed in a range of neurological disorders4. MRI is a powerful tool to investigate this glymphatic clearance pathway. In this study, a large cohort of patients with MB who underwent surgery and received radio-chemotherapy were studied with PVS at three unique stages of treatment. The goal was to examine the impact of combined modality therapy.METHODS
Subjects were from a clinical trial for newly diagnosed medulloblastoma (NCT01878617). Imaging and treatment protocols were approved by the local Institutional Review Board. Written informed consent was obtained. Patients were examined at three time points (TP): baseline (0M), after completing six weeks of radiotherapy and six weeks of rest (3M), and after completion of chemotherapy (12M). The patients were treated with clinical and molecular risk-directed therapy including different CSI doses and chemotherapy regimens. High-risk patients received high dose (HD) CSI (36Gy) standard and intermediate-risk patients received standard dose (SD) CSI (23.4Gy) and low-risk patients received reduced dose (RD) CSI (15Gy). The demographic characteristics of the 211 patients are listed in Table 1. Among the full cohort, 118 patients completed all three TPs listed in the last row labeled as “matched” in the table.3D T1w images with a resolution of 1x1x1mm3 were acquired by Siemens 3T MRI scanners using MPRAGE sequence (TR = 2000 ms; TE = 2.26 ms; flip angle = 15°; inversion time = 1100 ms; field of view = 221 × 191 × 161 mm3). All the T1w images were first normalized to a mean value of 110 using the FCM-based normalization method6. The PVS images were segmented on a white mask created by MRtrix3 (http://mrtrix.org) in a similar way as described by Sepehrband et al7. The threshold was 0.05 and the maximum PVS size is set to 150 mm3 to avoid false positive detection caused by white matter hyperintensity or CSF shunting.
The PVS ratio, defined as the ratio of PVS volume over white matter volume, of all 211 patients were statistically compared at three TPs using one‐way analysis of variance (ANOVA) and Tukey HSD post‐hoc tests. The PVS ratio of the 118 patients who completed all three TPs were compared using one-way repeated measurement ANOVA and Tukey HSD post‐hoc tests. The P values were adjusted for multiple comparison. The significance threshold was set to P < 0.05. The statistical analysis was performed by using R (version 4.0.3).
RESULTS
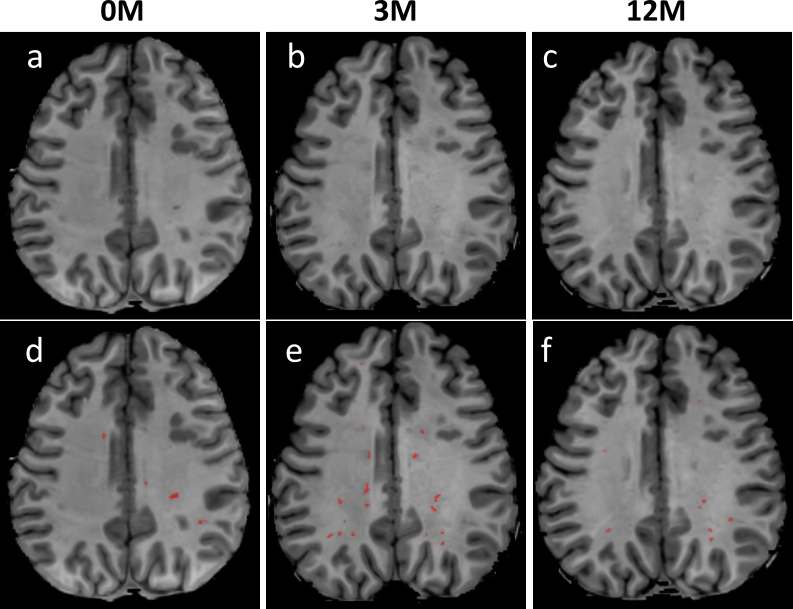
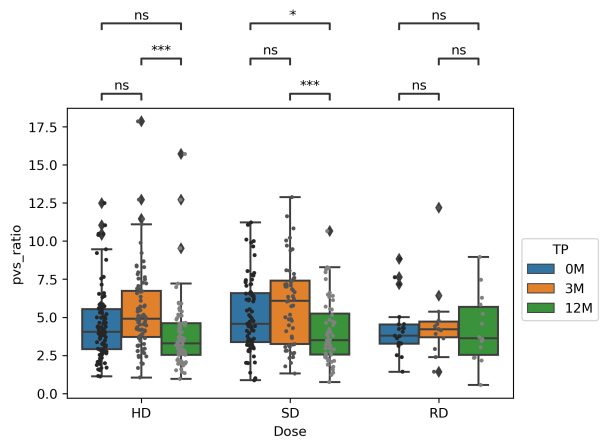
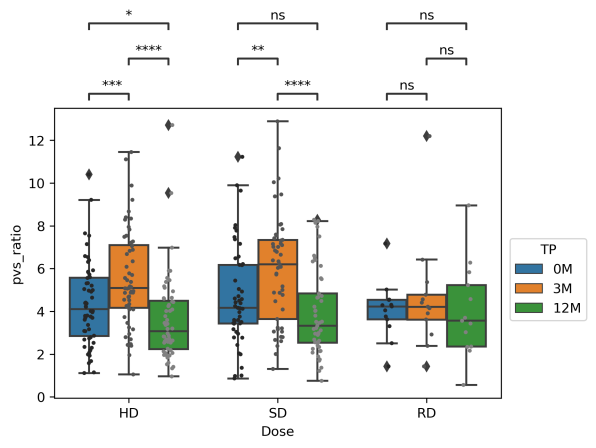
Fig. 1 shows T1w images of a patient at three TPs, along with the PVS segmentations overlaid on the corresponding T1w images. The PVS were effectively identified by the software. Table 2 summaries the means and standard deviations (STD) of the PVS ratios (in ‰) for different TPs. The mean PVS ratios increased during irradiation (0M to 3M) with the greatest change observed for the HD or SD group and lowest in the RD group. A PVS reduction was then observed during chemotherapy in the 3M to 12M interval. PVS changes were further confirmed in Fig. 2 using statistical comparisons between TPs for all the patients. In the RD cohort, no significant difference was observed between any of the TPs. Some significant differences were observed for some of TPs in HD and SD patients. Furthermore, the patients (matched patients) who completed all 3 TPs were compared in Fig. 3 using repeated measurement test. Again, no significant differences were observed between TPs in the RD cohort. For the SD cohort, significant differences were found between 0M–3M, and 3M –12M, but no significant difference was found for between 0M–12M. For HD cohort, significant differences were observed between all pairs of TPs.DISCUSSION
Our study showed that radiotherapy may play a significant role in the alteration of PVS. For low dose radiation, there were no significant changes between TPs. The PVS ratio is increased during irradiation from 0M to 3M in HD (p < 0.0001) and SD (p < 0.001) patients. The PVS ratios at 12M are the lowest. These results indicated that the PVS increase due to irradiation appears to be reversible, and chemotherapy may not increase the PVS ratio in children.PVS increases following radiation have been previously reported as clinical findings in a limited number of cases8,9. This study systematically confirmed these qualitative finding in a large cohort of 211 pediatric patients. One limitation of this study is that the number of patients in the RD cohort is limited.
CONCLUSIONS
Perivascular space imaging is a potential biomarker to monitor the side effects from combined modality therapy. High or standard dose radiation could induce an increase in PVS. However, chemotherapy may not increase the PVS ratio in children.Acknowledgements
We thank Farshid Sepehrband, Ph.D, Keck School of Medicine, University of Southern California, for providing the PVS processing script on which our processing script is based. We acknowledge grant funding from ALSAC.References
1. Pui CH, Gajjar AJ, Kane JR, Qaddoumi IA, Pappo AS. Challenging issues in pediatric oncology. Nat. Rev. Clin. Oncol. 2011;8:540–549 doi: 10.1038/nrclinonc.2011.95.
2. Merchant TE, Happersett L, Finlay JL, Leibel SA. Preliminary results of conformal radiation therapy for medulloblastoma. Neuro. Oncol. 1999;1:177–187 doi: 10.1093/neuonc/1.3.177.
3. Seidel C, Heider S, Hau P, Glasow A, Dietzsch S, Kortmann RD. Radiotherapy in medulloblastoma—evolution of treatment, current concepts and future perspectives. Cancers (Basel). 2021;13:1–16 doi: 10.3390/cancers13235945.
4. Bacyinski A, Xu M, Wang W, Hu J. The paravascular pathway for brain waste clearance: Current understanding, significance and controversy. Front. Neuroanat. 2017;11:1–8 doi: 10.3389/fnana.2017.00101.
5. Selvarajah J, Scott M, Stivaros S, et al. Potential surrogate markers of cerebral microvascular angiopathy in asymptomatic subjects at risk of stroke. Eur. Radiol. 2009;19:1011–1018 doi: 10.1007/s00330-008-1202-8.
6. Reinhold JC, Dewey BE, Carass A, Prince JL. Evaluating the impact of intensity normalization on MR image synthesis. 2019:126 doi: 10.1117/12.2513089.
7. Sepehrband F, Barisano G, Sheikh-Bahaei N, et al. Image processing approaches to enhance perivascular space visibility and quantification using MRI. Sci. Rep. 2019;9:1–12 doi: 10.1038/s41598-019-48910-x.
8. Gopinath M, Nagesh C, Kesavadas C. Post radiation evolution of giant virchow-robin spaces in a case of pituitary macroadenoma. Indian J. Radiol. Imaging 2018;28:373–374 doi: 10.4103/ijri.IJRI_335_17.
9. Mark IT, Carr CM, Ruff MW, Flanagan EP, Johnson DR. Enlarging Perivascular Spaces Following Radiation Therapy in the Brain: A Report of 2 Cases and Literature Review. World Neurosurg. 2020;138:436–439 doi: 10.1016/j.wneu.2020.03.159.
Figures
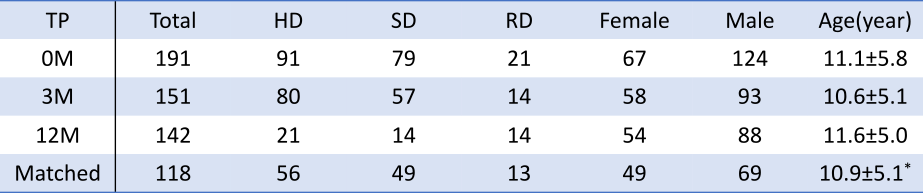
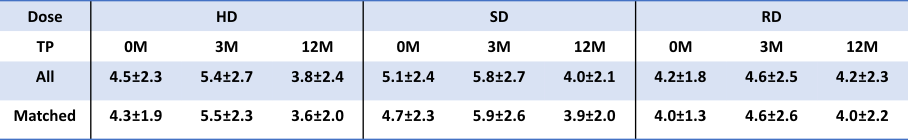
Table 2. PVS ratio (mean ± STD) in ‰ for different time point (TP) and radiation doses.