3173
Simulation of a dynamic saturation CEST technique using MR fingerprinting for quantitative amide proton transfer imaging at 3 T1Vanderbilt University Institute of Imaging Science, Vanderbilt University Medical Center, Nashville, TN, United States, 2Department of Radiology and Radiological Sciences, Vanderbilt University Medical Center, Nashville, TN, United States
Synopsis
Keywords: CEST & MT, MR Fingerprinting
Conventionally, quantitative CEST imaging requires steady-state acquisitions so that the obtained signals can be fitted to simple analytical models, which takes a long scan time. Recently, transient-state techniques such as MR fingerprinting were developed to shorten the scan time. This study evaluates the potential of using a new pulse-by-pulse modulation of the saturation power acquisition in conjunction with an MRF reconstruction and fitting approach, termed dynamic saturation CEST, for quantitative APT imaging. Based on signal simulations, sensitivity analysis, and image simulations, we find it is plausible to estimate amide and macromolecular pool concentration, as well as water R1.Introduction
Amide proton transfer (APT) is an important application of chemical exchange saturation transfer (CEST) imaging for detecting mobile proteins/peptides and pH with enhanced detection sensitivity. Separate quantification of the amide concentration or its exchange rate is critical for improving its specificity in either protein imaging or pH imaging. However, quantitative CEST imaging usually requires a long scan time. MR fingerprinting (MRF)1–3 and MR-multitasking4 have been used to accelerate CEST sequences. However, these sequences have focused on long pulse trains at constant saturation before altering the saturation power/frequency, rather than the highly dynamic approaches used in MRF relaxometry5. This simulation study evaluated the use of a dynamic saturation CEST (dsCEST) technique with a saturation power modulated pulse-by-pulse for quantitative APT imaging.Methods
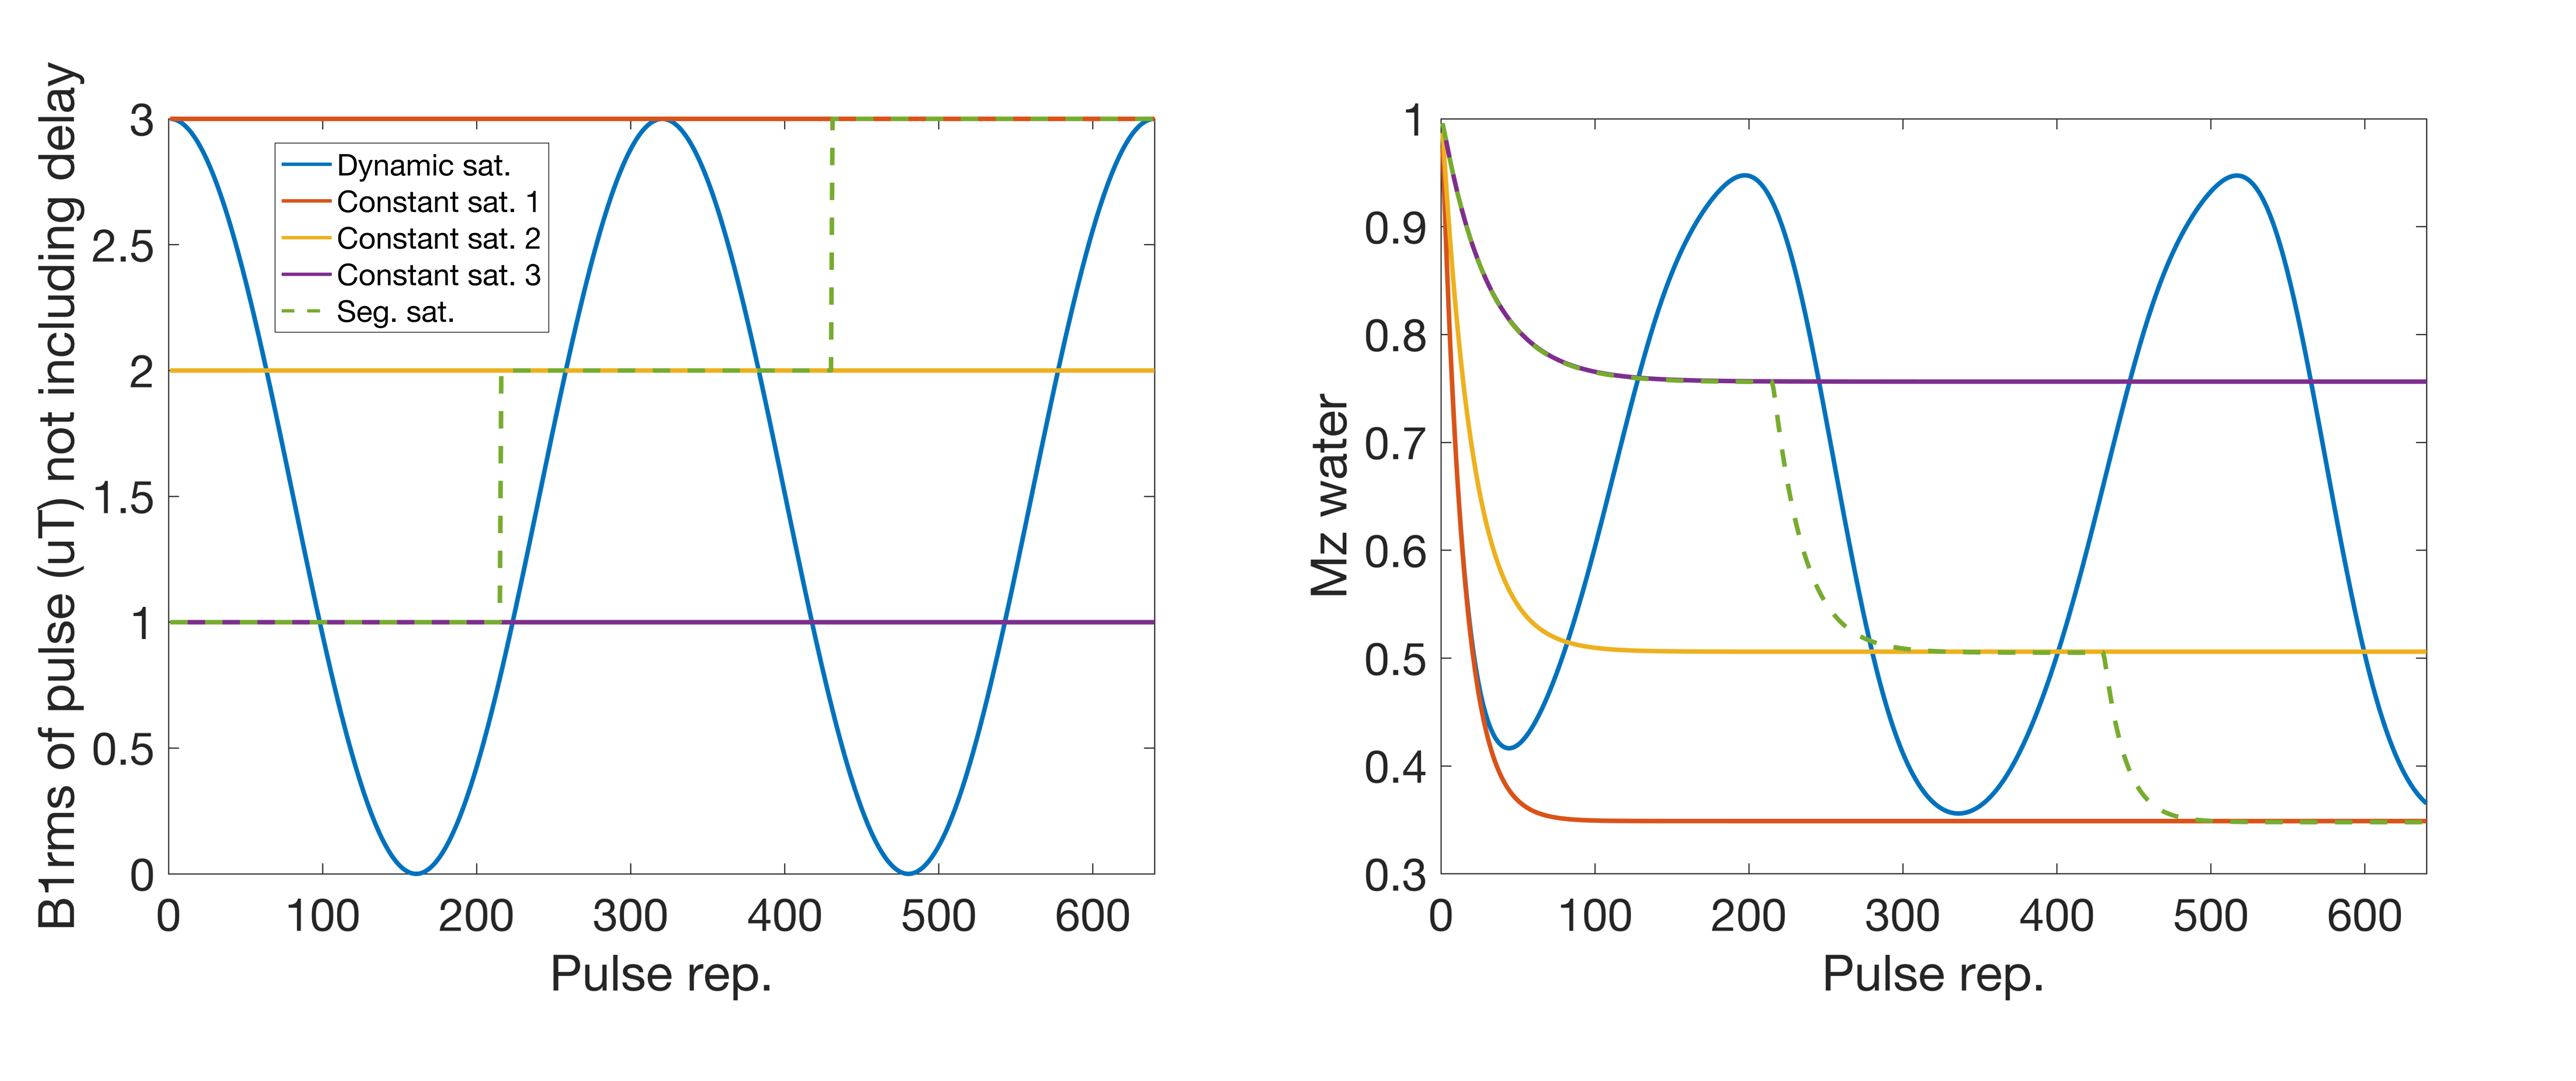
We evaluated dsCEST parameter quantitation relative to constant saturation, dsCEST signal sensitivity to model parameters and vice-versa, and parameter estimates of simulated dsCEST 2D images. In this study we used total saturation times (~19 s) that are longer than the time to reach steady-state saturation (~2.5 s).We simulated the CEST signals at a single frequency offset of +3.5 ppm for a dynamic saturation, three constant saturations and one step-wise segmented saturation of different powers (Fig. 1). The simulations were performed with 4-pool Bloch-McConnell equations (amide at 3.5ppm, amine at 2ppm, water and semi-solid macromolecular component at 0ppm) executed for 640 saturation pulse repetitions. The RF saturation pulse time was 15 ms using a gaussian pulse and had 15 ms interpulse delay (during which image acquisition can occur). The dynamic saturation used a squared sinusoid shape, peaking at B1rms = 3.0 uT (Fig. 1).
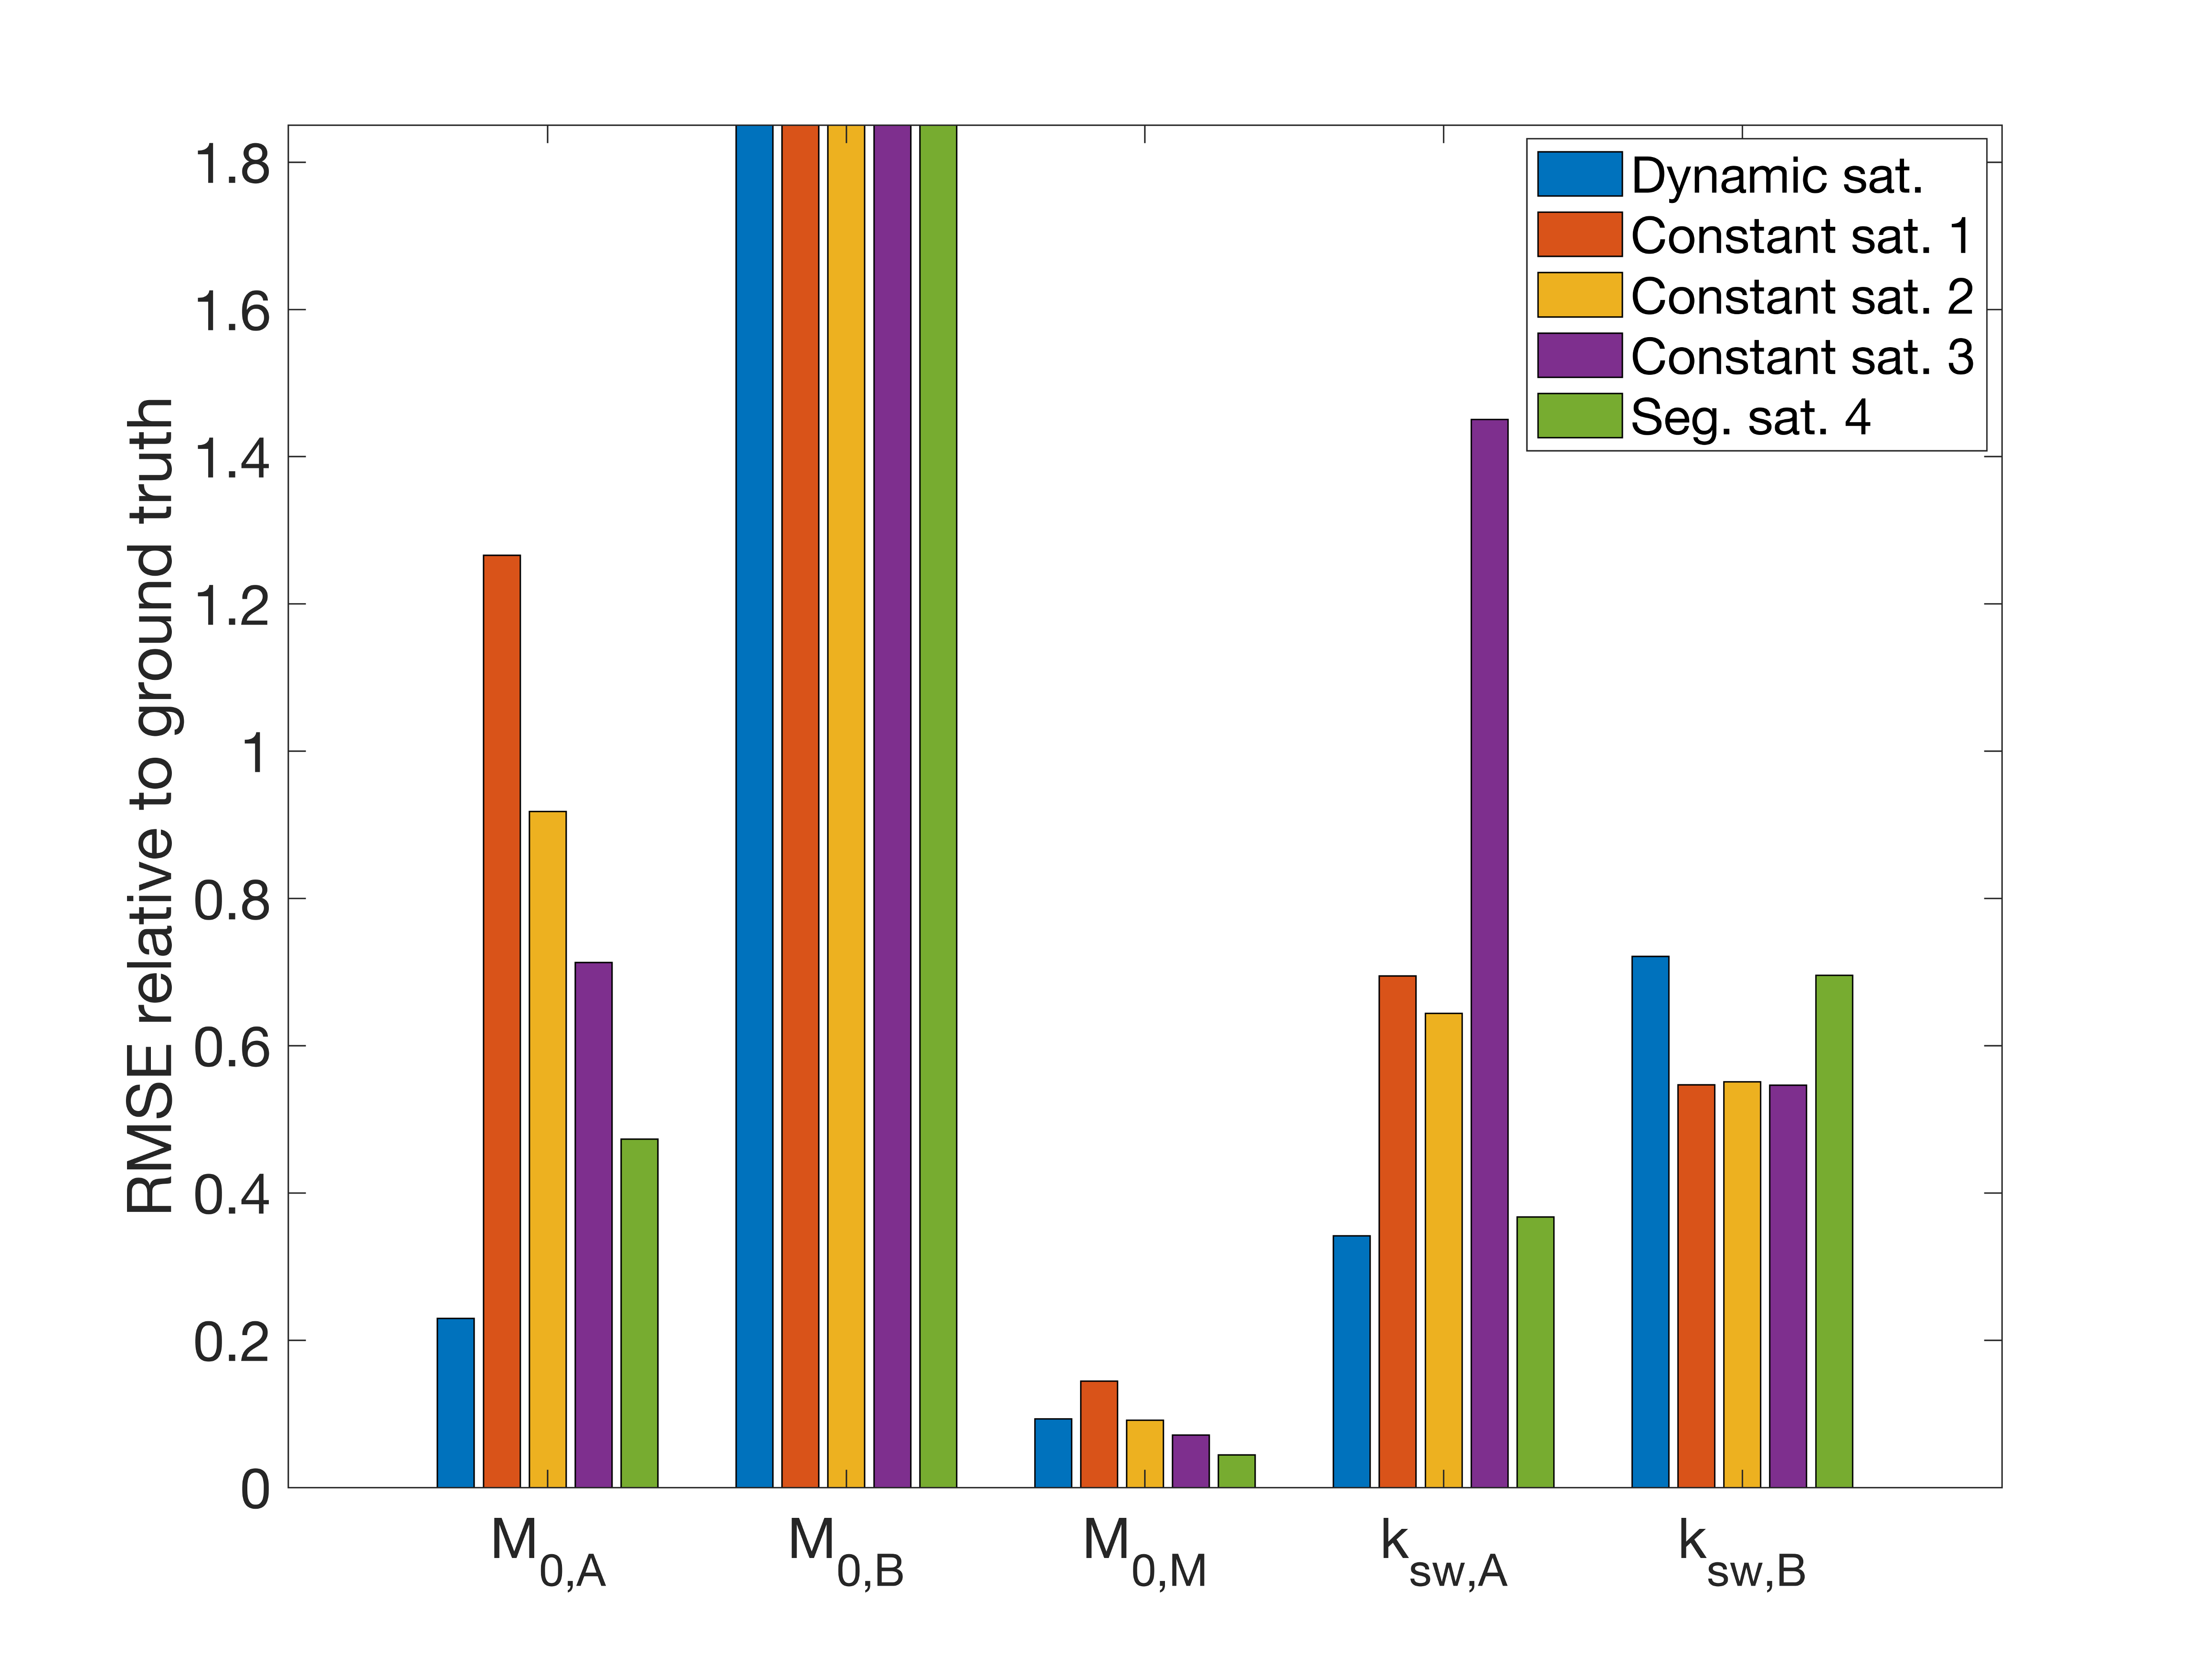
A Monte-Carlo simulation was used to determine the relative RMSE for the concentration estimates (relative to water) of the solutes (amide M0,A = 1.5e-3, amine M0,B = 3e-4) and macromolecular pools (M0,M = 0.1), as well as the exchange rate estimates between the water and solute pools (ksw,A = 50 Hz, ksw,B = 500 Hz) for all saturation modes. The water T1 = 1200 ms and T2 = 50 ms, while other exchange and relaxation parameters from the model were estimated from the literature6. For each signal the same noise was added to yield a (peak) SNR = 100. A nonlinear constrained fit was used to estimate the concentration and exchange rates.
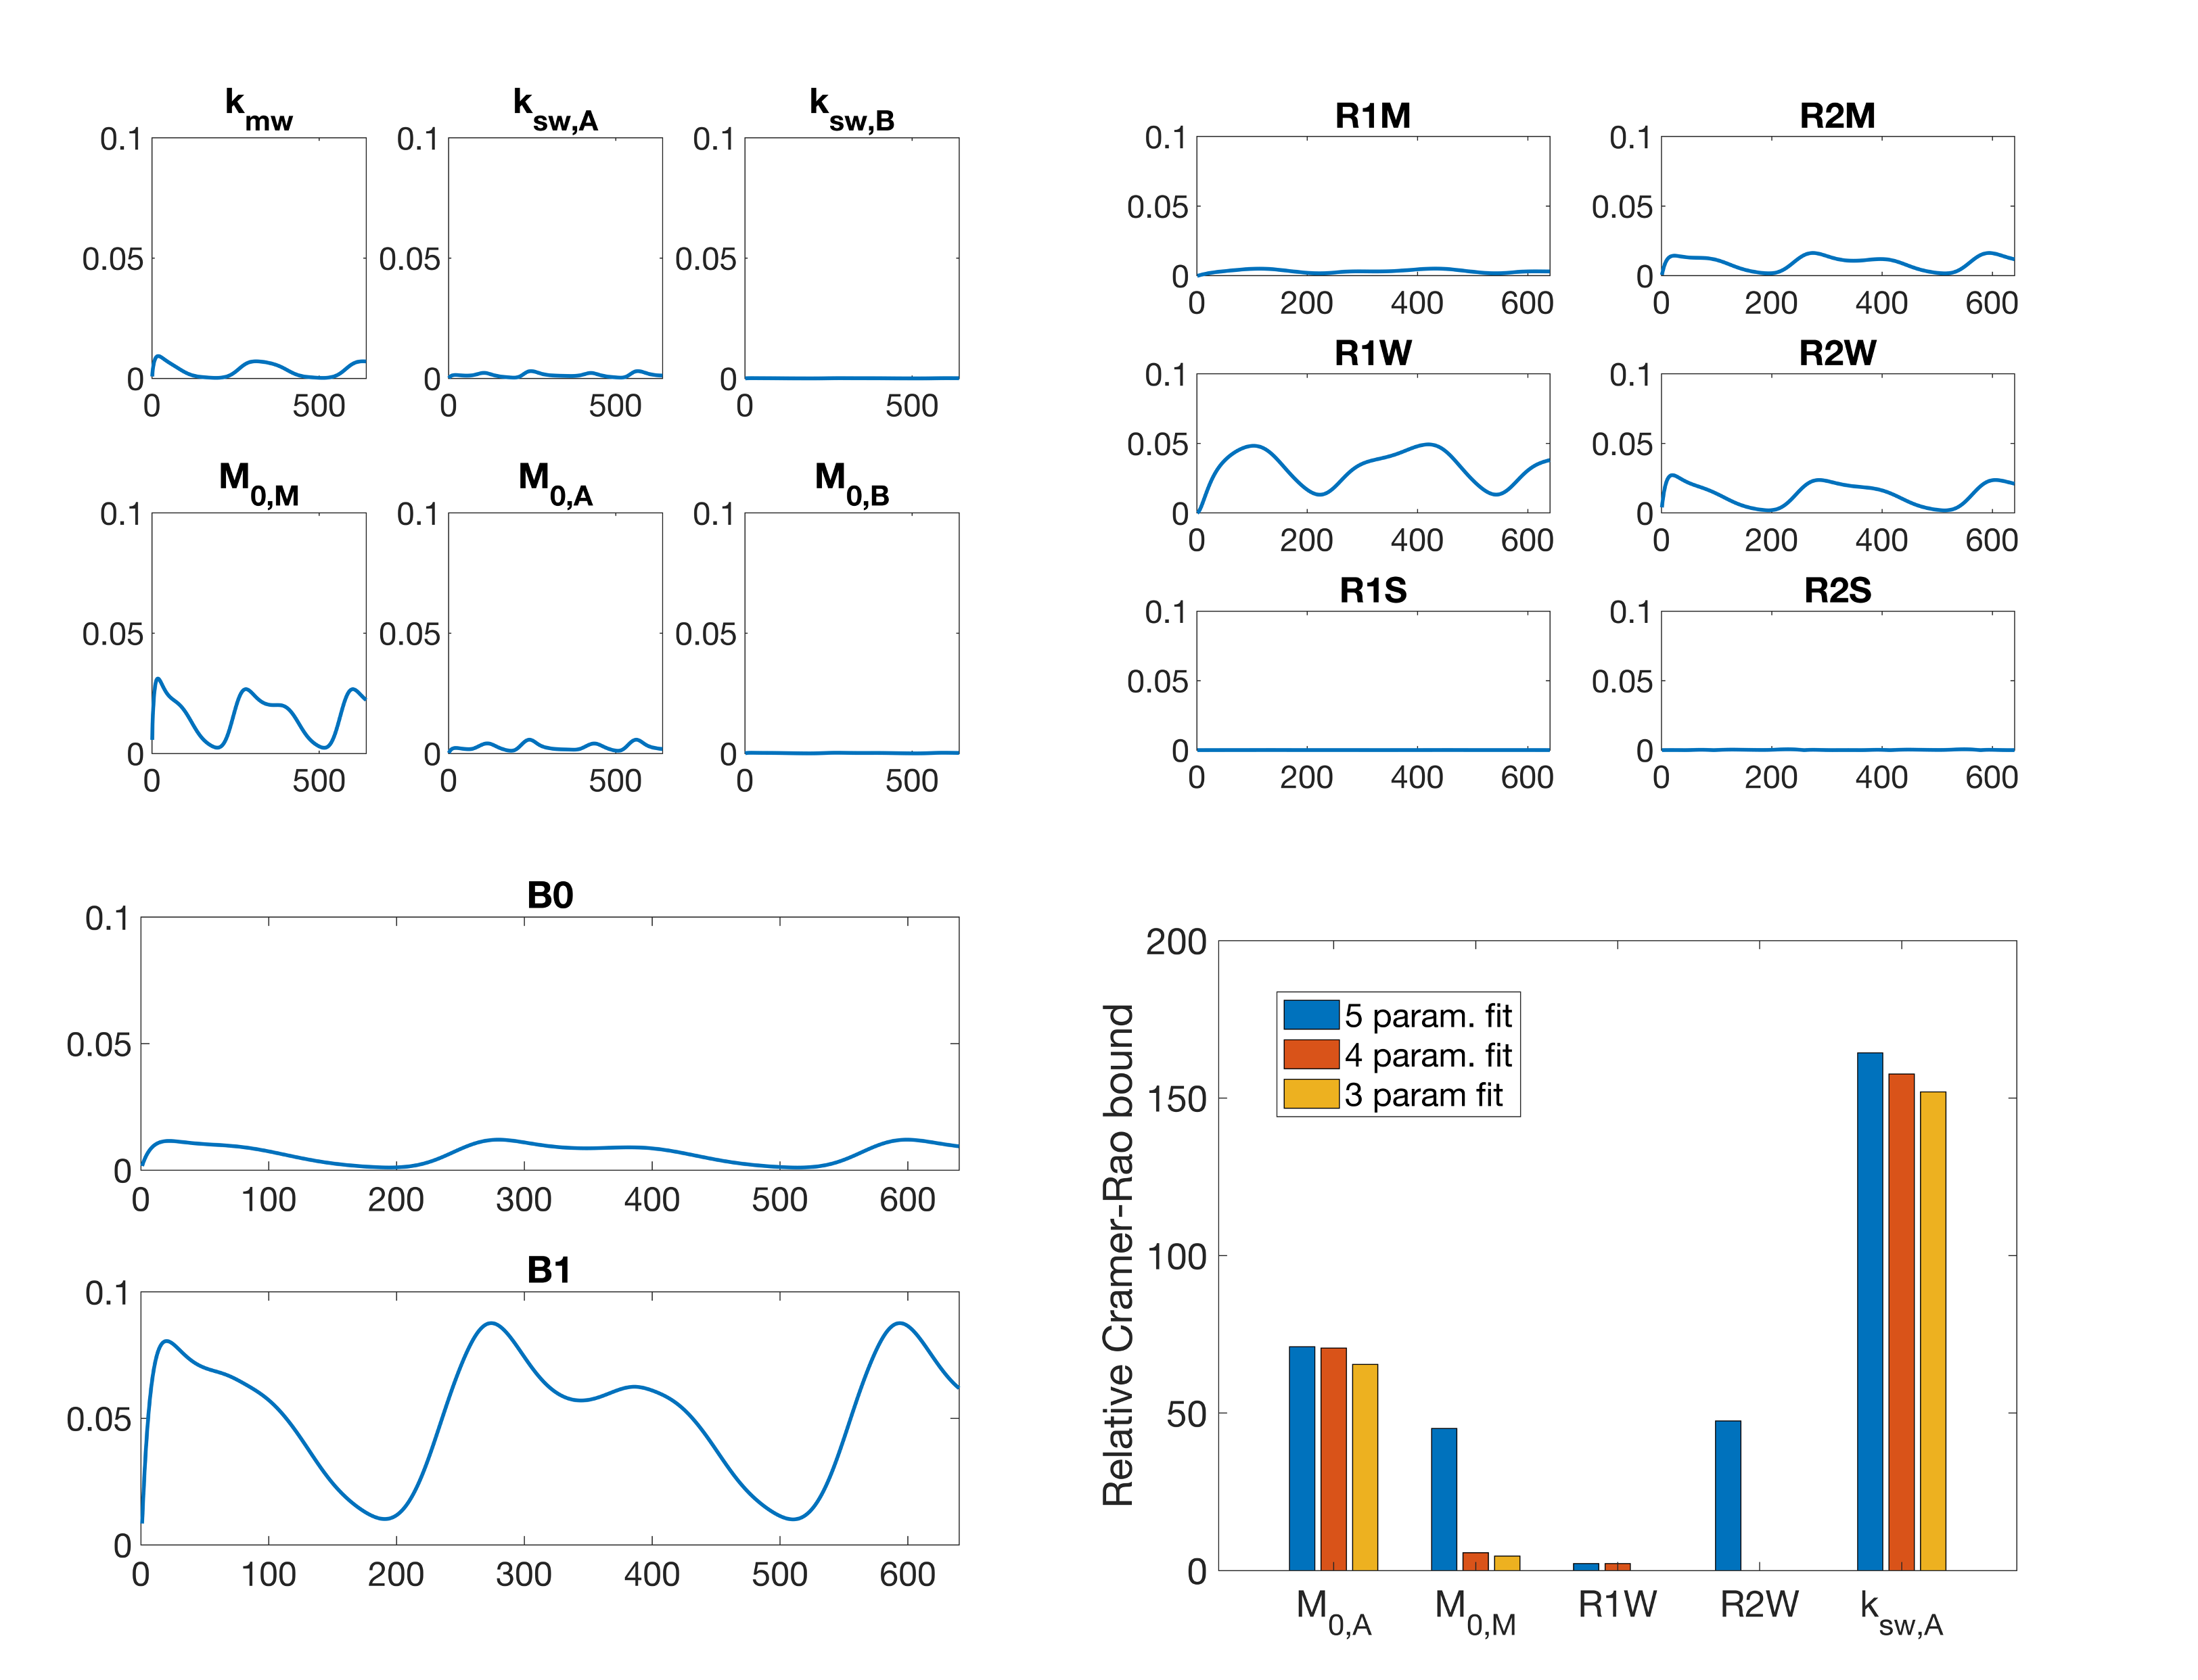
We evaluated the signal sensitivity to parameter changes and the relative Cramer-Rao bounds (CRB) for parameters that could be estimated. For each of the exchange rate, concentration, and relaxation parameters in the model, as well as B0 offset and B1+ saturation scaling, the values were increased by 20% (20 Hz in the case of B0) and the signal difference was recorded to yield a visual indicator of the signal sensitivity to each parameter. Based on the results of signal sensitivity and literature values, the CRB scaled relative to the ground truth was computed for a three- to five-parameter fit.
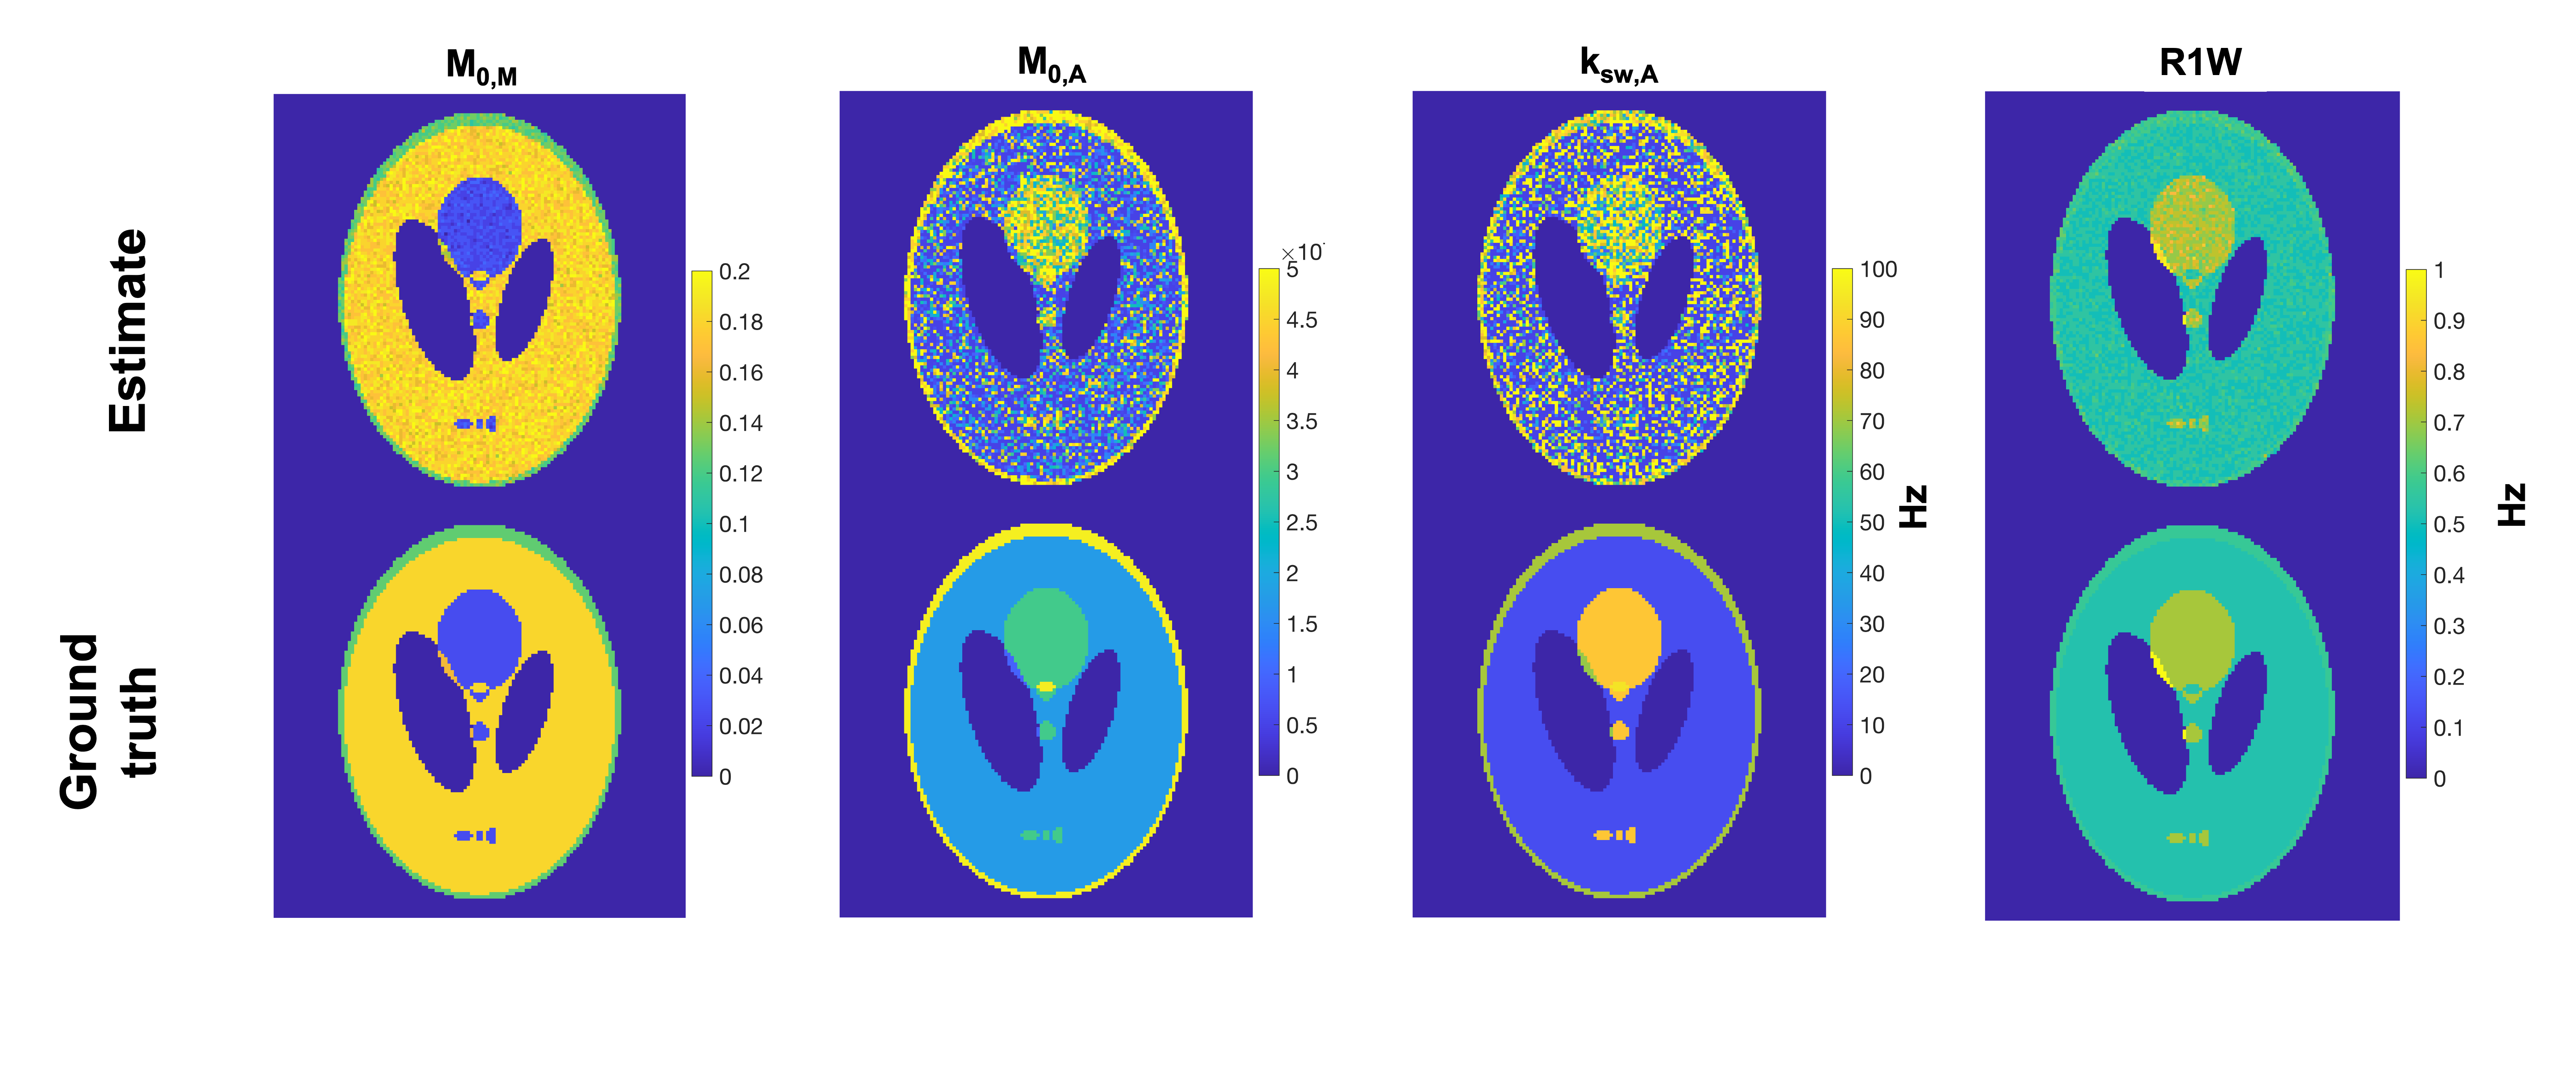
A simulated, undersampeld dsCEST image set using a digital Shepp-Logan phantom of uniform intensity was generated using random M0,M, M0,A, ksw,A, R1 of water (R1W) parameters to be fit (following the sensitivity analysis). The image acquisition was similar to that used in MR multitasking CEST4, using a 6-excitation (FA = 5°) SPGR acquisition after each saturation pulse, but using the dsCEST schedule in Fig. 1. With Cartesian sampling, the center k-space line then 5 random phase encodes were acquired after each saturation pulse. Complex noise was added to k-space for SNR = 30 dB.
The images were reconstructed using a low-rank MR fingerprinting approach7 and time-compressed images were fit against a compressed dictionary of modeled dsCEST signals. The B0, B1+, and R2W maps were applied as constraint maps during fitting and other parameters were drawn from the literature.
Results
The RMSE relative to the ground truth values from the fitting of the dsCEST and other saturation modes can be seen in Fig. 2. The dsCEST estimate errors of M0,A and ksw,A (amide) were about half of those from the constant saturation, but slightly greater in ksw,B (amine) and similar in M0,M (macromolecular). The segmented saturation had the second lowest RMSE of M0,A. All methods had very large errors in M0,B estimation.The sensitivity of the dsCEST signals to the 4-pool parameters and CRB analysis can be seen in Fig. 3. While the intermediate-exchanging amine is known to bias APT estimation, the dsCEST signal was not very sensitive to small changes in it. The optimal parameters to fit were M0,A, ksw,A, M0,M, and R1W. The estimation of R2W increased estimation uncertainty.
The parameter estimates from the image simulation in Fig. 4 show that estimation of M0,A, M0,M, and R1W were similar to ground truth, but ksw,A was too sensitive to noise to be estimated using the current reconstruction/estimation approach.
Discussion and Conclusion
The dsCEST approach pushes the dynamic aspects of current CEST MRF approaches to greater extremes by varying the saturation pulse power at each repetition. Simulations suggest that estimation of macomolecular- and amide-pool concentration with water R1 is viable. However, further work is needed to prove this in experimental and in vivo conditions as well as to improve the estimation of amide exchange rate.Acknowledgements
NIH R01 EB029443References
1. Zhou Z, Han P, Zhou B, Christodoulou AG, Shaw JL, Deng Z, Li D. Chemical exchange saturation transfer fingerprinting for exchange rate quantification. Magnetic Resonance in Medicine. 2018;80(4):1352–1363.
2. Cohen O, Yu VY, Tringale KR, Young RJ, Perlman O, Farrar CT, Otazo R. CEST MR Fingerprinting (CEST-MRF) for Brain Tumor Quantification Using EPI Readout and Deep Learning Reconstruction. Magnetic Resonance in Medicine. 2022;(January):1–18.
3. Perlman O, Farrar CT, Heo HY. MR fingerprinting for semisolid magnetization transfer and chemical exchange saturation transfer quantification. NMR in Biomedicine. 2022;(February):1–22.
4. Han P, Cheema K, Lee H, Zhou Z, Cao T, Ma S, Wang N, Han H, Christodoulou AG, Li D. Whole‐brain steady‐state CEST at 3 T using MR Multitasking. Magnetic Resonance in Medicine. 2021;(June):1–9.
5. Ma D, Gulani V, Seiberlich N, Liu K, Sunshine JL, Duerk JL, Griswold MA. Magnetic resonance fingerprinting. Nature. 2013;495(7440):187–92.
6. Zhang XY, Wang F, Li H, Xu J, Gochberg DF, Gore JC, Zu Z. Accuracy in the quantification of chemical exchange saturation transfer (CEST) and relayed nuclear Overhauser enhancement (rNOE) saturation transfer effects. NMR in Biomedicine. 2017;30(7):1–14.
7. Zhao B, Setsompop K, Adalsteinsson E, Gagoski B, Ye H, Ma D, Jiang Y, Ellen Grant P, Griswold MA, Wald LL. Improved magnetic resonance fingerprinting reconstruction with low-rank and subspace modeling. Magnetic Resonance in Medicine. 2018;79(2):933–942.
Figures