3170
Early-stage mapping of macromolecular tissue content in the brain of APPNL-F mouse model using nuclear Overhauser enhanced (NOE) MRI1Bioengineering, University of Pennsylvania, Philadelphia, PA, United States, 2Radiology, University of Pennsylvania, Philadelphia, PA, United States
Synopsis
Keywords: CEST & MT, Alzheimer's Disease
This study utilizes nuclear Overhauser effect (NOE) MRI to map early-stage changes in macromolecular brain content of an APPNL-F model of Alzheimer's disease. NOEMTR and rNOE are the quantitative metrics used to assess lipids and proteins in major regions of the mouse brain. Following ROI analysis, there is a statistically significant decrease in NOEMTR contrast between wild-type and AD mice in the hippocampus, with rNOE showing a similar trend with a strong suggestion of statistical significance. Overall, this study shows that NOE MRI can be used to successfully detect changes in the macromolecular content of mouse brain tissue through NOEMTR.Introduction
Alzheimer’s disease (AD) is the leading cause of dementia in adults aged 65 and older, with an estimated 5.8 million people (2019) living with AD across all ages1. Despite the large prevalence of AD in the population, there is a lack of robust diagnostic tools to detect early-onset AD and its progression. Structural MRI has been used to detect synaptic and neuronal loss but provides information on later-stages of the pathology2,3, while the rise of machine learning- and deep learning-based solutions shows promising results but has limited clinical translation due to the large amount of data needed to train the models and necessary model optimization by field experts4-6. Simple, yet informative, techniques for assessing changes in structural and macromolecular content are CEST and NOE MRI7,8. This study uses nuclear Overhauser enhanced (NOE) MRI9 to probe changes in lipid and protein content of APPNL-F knock-in mice that exhibit clinical AD symptoms such as synaptic loss and amyloid beta (Aβ) plaque build-up. The post-processing pipelines involve the construction of NOEMTR maps and relayed-NOE maps from multi-pool fitting to determine contributions to the observed changes in these AD transgenic mice.Methods
This study was performed using 6- to 9-month-old C57BL/6J (wild-type (WT), n = 5) mice and APPNL-F knock-in (AD, n = 5) mice under a protocol approved by the IACUC committee of the University of Pennsylvania. To perform the MRI experiments, the mouse was anesthetized using 1.5% isoflurane and its head was secured in a conical restrainer. The mouse was then placed in a 20 mm diameter 1H transceiver volume coil (m2m Imaging), which was subsequently placed in a 9.4T horizontal bore magnet interfaced with an Avance III console (Bruker BioSpin, Germany). A localizer for mouse positioning and T1 and T2-weighted anatomical images were acquired for voxel placement, localized shimming, and post-processing registration/segmentation. For NOE MRI acquisitions, a WASSR10 image was acquired followed by an unsaturated image (GRE readout; TE = 4.0 ms, FA = 10°, Tsat = 3.0 s, offset = ± 300 ppm). A full z-spectrum was acquired for the saturated images with 174 offsets variably spaced as follows: 0-6ppm (step-size(ss):0.1ppm), 6-10ppm(ss:0.5ppm), 10-20ppm (ss:1ppm), and 20-100ppm (ss:10 ppm) and saturation power of 1.0µT (all acquisition parameters same as unsaturated image). NOEMTR images were calculated using the following equation:$$NOE_{MTR} = \frac{S_{-300ppm} - S_{-3.5ppm}}{S_{-300ppm}}$$
where S-3.5ppm and S-300ppm represent the signal intensities of an image voxel at offsets of -3.5 and -300ppm, respectively. Furthermore, the Z-spectra for each voxel was fitted using a multi-pool Lorentzian fitting method with five pools and initial parameter estimates based on Zaiss et. al11. An automated ROI analysis for hippocampal, thalamus/hypothalamus, and cortex regions was conducted to measure mean NOEMTR and NOE amplitude values. Statistical tests were performed with a significance level of p<0.05 to determine changes in regions between WT and AD groups.
Results
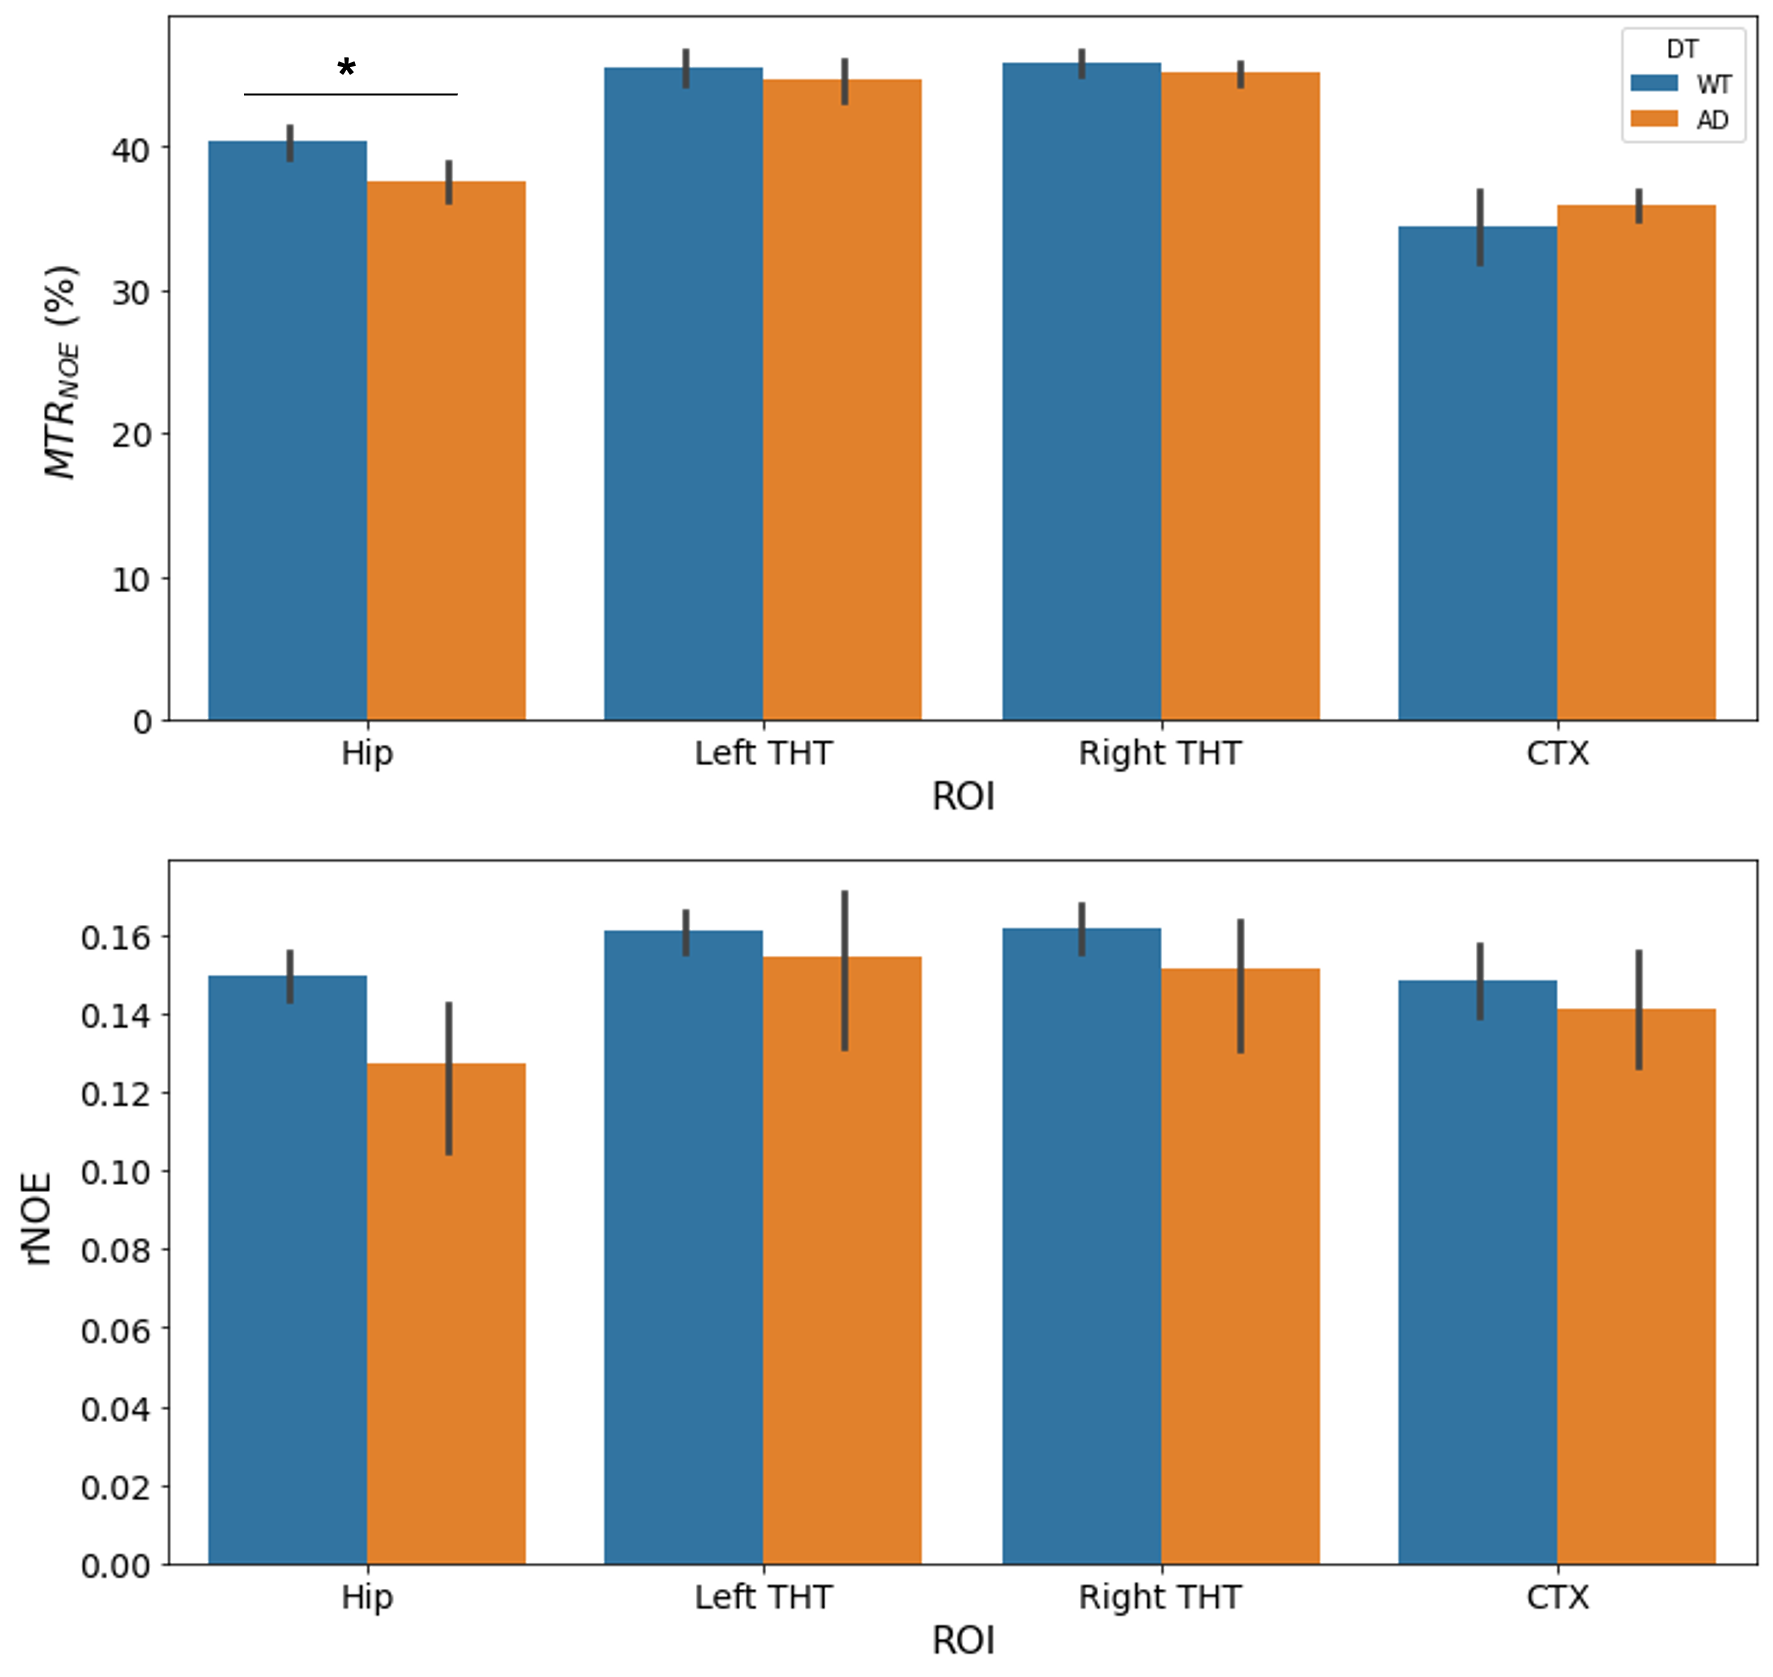
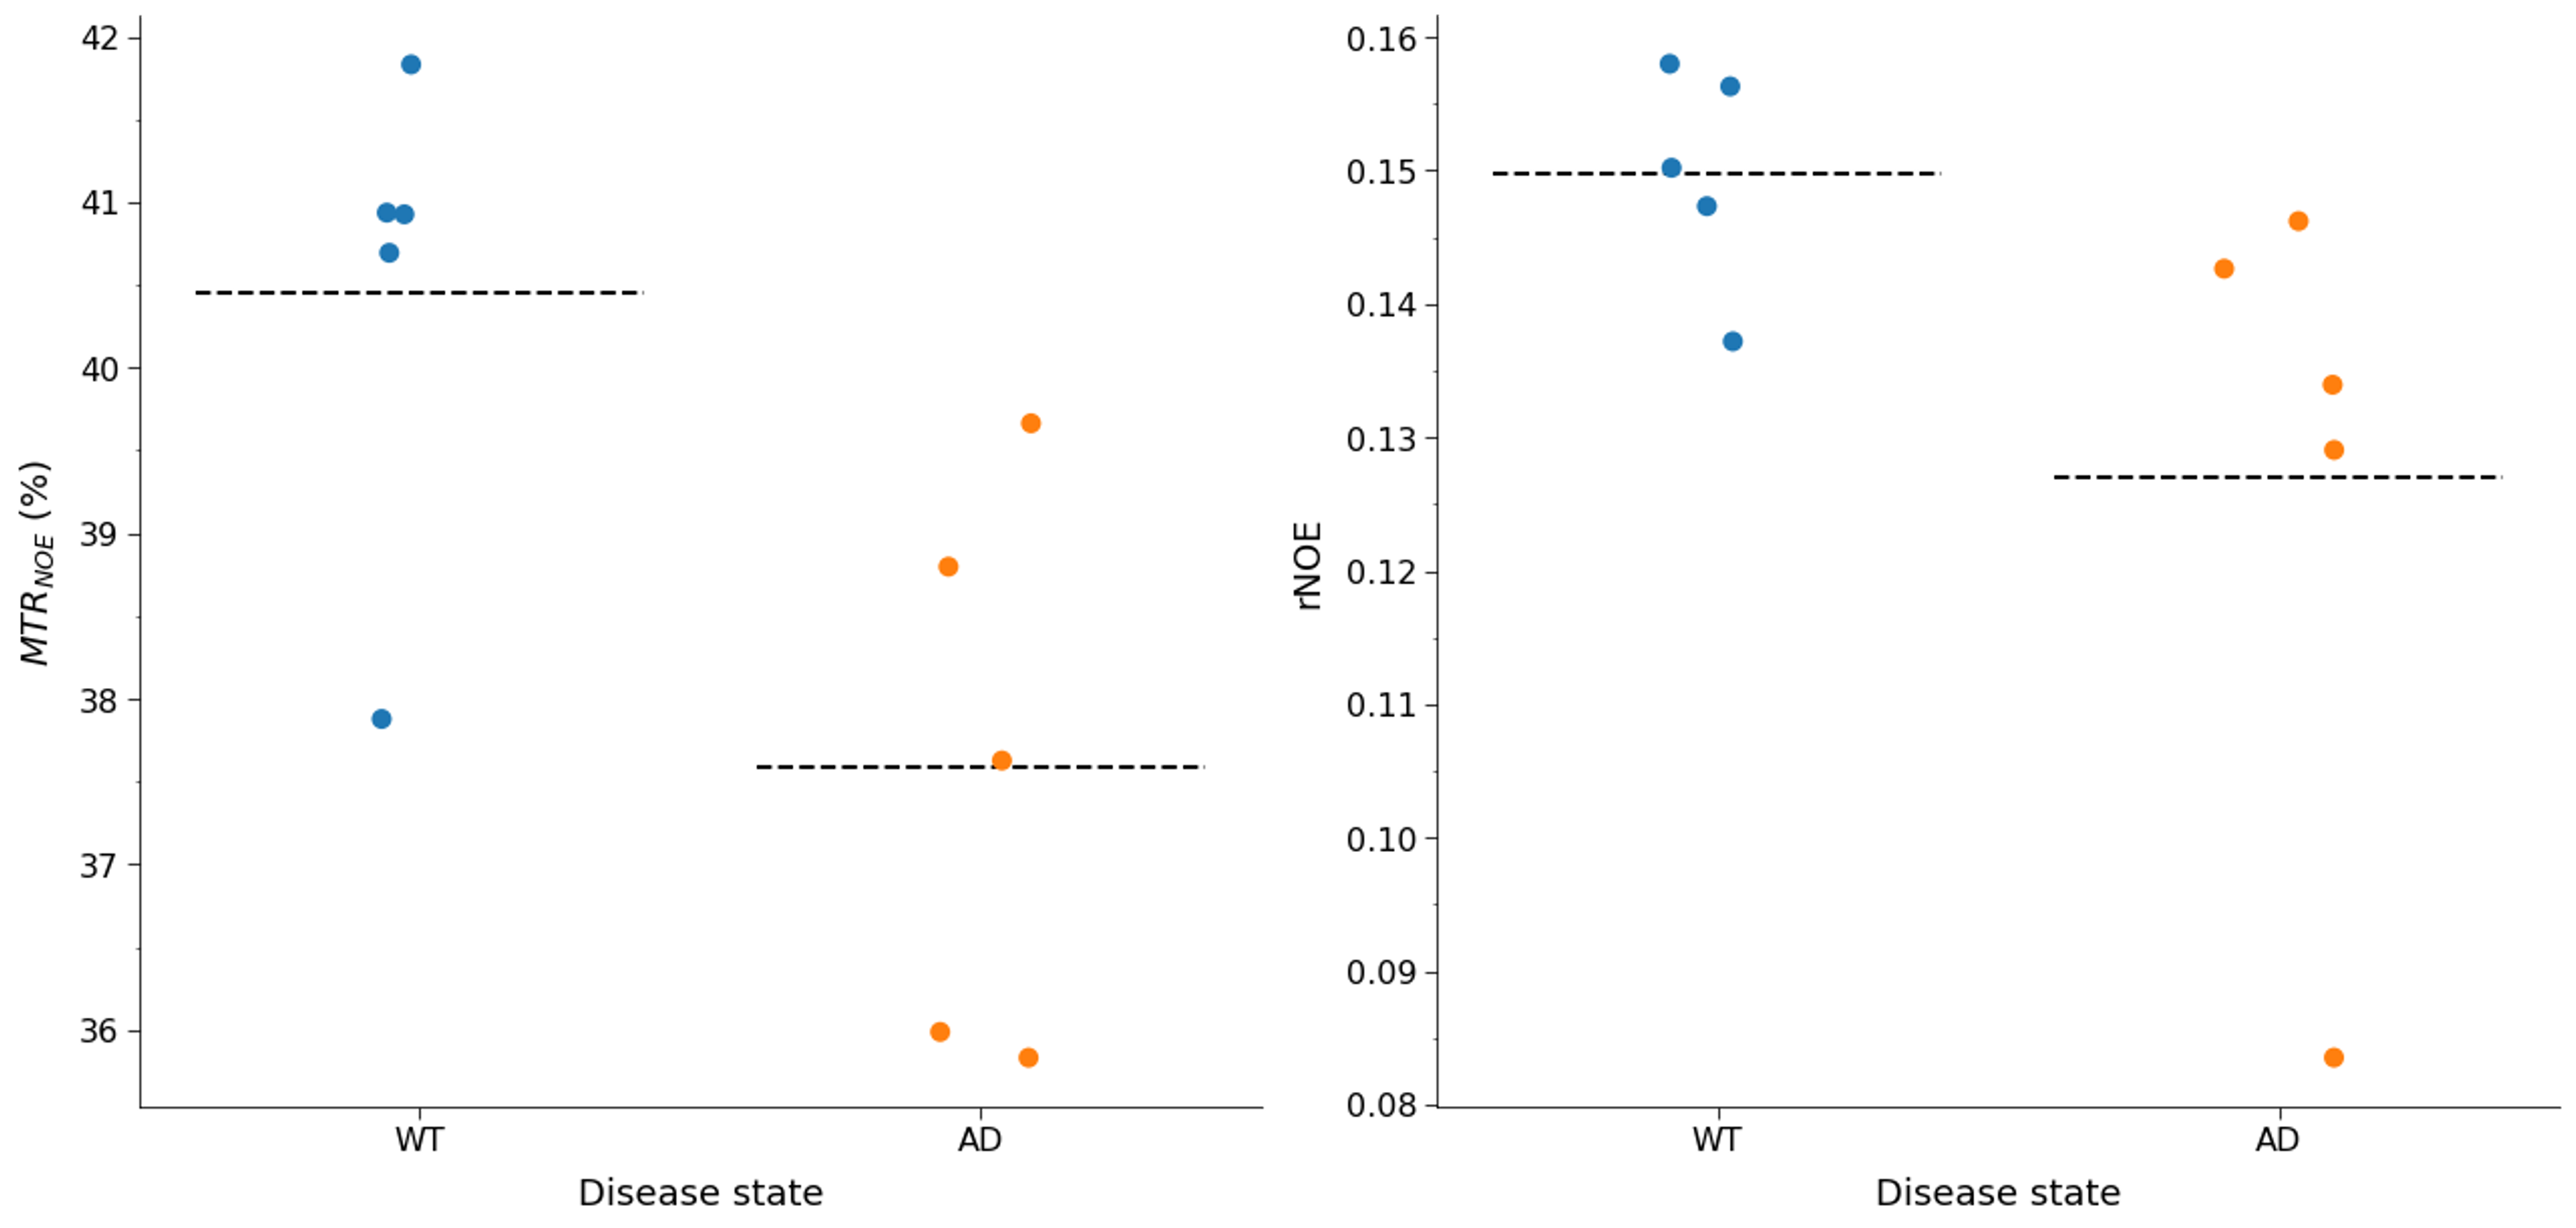
The mean NOEMTR and NOE amplitude values for each ROI are presented in Figure 1. There was a significant reduction in MTR values (p = 0.02) of the hippocampal region between WT and AD groups, with values of 40.5±1.5% and 37.6±1.7%, respectively. In addition, the NOE amplitude values of the hippocampal region between WT and AD groups strongly suggest there is a similar trend, but a statistical significance (p = 0.09) is not achieved. For all other regions, there was no statistical significance in MTR or amplitude values between groups.Discussion
The decrease in NOEMTR contrast in the AD group suggests that there is a change in the lipid and protein tissue content in the hippocampus of mice under this pathology. This agrees with previously reported findings from lipid analyses on the hippocampus of APP transgenic mice, which show a significant decrease in cholesterol esters, sphingomyelin, and diacylglycerols(DAGs) - all fatty acids comprising myelin sheaths and responsible for myelin synthesis12. To identify contributions to the NOEMTR contrast, the results from the multi-pool fitting analysis were used, and the suggestion of a statistical difference in the NOE amplitudes between both groups suggests that the contrast observed might be from protein aggregates (i.e., amyloid-beta (Aβ))13 as well. Given the reported phenotypic characteristics of APPNL-F models at 6 – 9 months, there is Aβ formation in the cortex and hippocampus followed by reduced synaptophysin and synaptic loss14. Based on the NOEMTR values, which has contributing effects of NOE and MT, this suggests that there is a build-up of Aβ plaques along with myelin degeneration.Conclusion
Overall, this study shows that NOEMTR can be used as a quantitative metric to assess macromolecular content in the brain. In addition, this study showed a change in the macromolecular content in the hippocampal region of transgenic AD mice as detected by NOEMTR. Furthermore, multi-pool fitting of Z-spectra showed no regional differences between WT and AD mice, suggesting that NOEMTR may be a sufficient metric to detect changes in brain tissue content, leading to shorter scan times and facile post-processing pipelines. The use of multi-pool Lorentzian fitting should not be discounted, however, as it can extract information from different pools in the brain and aid in determining the origins of the observed changes.Acknowledgements
“Research reported in this publication was supportedby the National Institute of Biomedical Imaging andBioengineering of the National Institutes of Healthunder award Number P41EB029460.”
“Research reported in this publication was supportedby the National Institute of Aging of the NationalInstitutes of Health under Award NumberR01AG063869.”
References
1. Alzheimer, Association, sciencestaff, & alzorg. (2019). 2019 Alzheimer’s disease facts and figures. Alzheimer’s & Dementia, 15(3), 321–387. https://doi.org/10.1016/J.JALZ.2019.01.010
2. Vemuri, P., & Jack, C. R. (2010). Role of structural MRI in Alzheimer’s disease. Alzheimer’s Research and Therapy, 2(4), 1–10. https://doi.org/10.1186/ALZRT47/TABLES/3
3. Tondelli, M., Wilcock, G. K., Nichelli, P., de Jager, C. A., Jenkinson, M., & Zamboni, G. (2012). Structural MRI changes detectable up to ten years before clinical Alzheimer’s disease. Neurobiology of Aging, 33(4), 825.e25-825.e36. https://doi.org/10.1016/J.NEUROBIOLAGING.2011.05.018
4. Wolz, R., Julkunen, V., Koikkalainen, J., Niskanen, E., Zhang, D. P., Rueckert, D., Soininen, H., & Lötjönen, J. (2011). Multi-Method Analysis of MRI Images in Early Diagnostics of Alzheimer’s Disease. PLOS ONE, 6(10), e25446. https://doi.org/10.1371/JOURNAL.PONE.0025446
5. Bron, E. E., Klein, S., Papma, J. M., Jiskoot, L. C., Venkatraghavan, V., Linders, J., Aalten, P., de Deyn, P. P., Biessels, G. J., Claassen, J. A. H. R., Middelkoop, H. A. M., Smits, M., Niessen, W. J., van Swieten, J. C., van der Flier, W. M., Ramakers, I. H. G. B., & van der Lugt, A. (2021). Cross-cohort generalizability of deep and conventional machine learning for MRI-based diagnosis and prediction of Alzheimer’s disease. NeuroImage: Clinical, 31, 102712. https://doi.org/10.1016/J.NICL.2021.102712
6. Diogo, V. S., Ferreira, H. A., & Prata, D. (2022). Early diagnosis of Alzheimer’s disease using machine learning: a multi-diagnostic, generalizable approach. Alzheimer’s Research and Therapy, 14(1), 1–21. https://doi.org/10.1186/S13195-022-01047-Y/FIGURES/4
7. Wu, B., Warnock, G., Zaiss, M., Lin, C., Chen, M., Zhou, Z., Mu, L., Nanz, D., Tuura, R., & Delso, G. (2016). An overview of CEST MRI for non-MR physicists. EJNMMI Physics, 3(1), 1–21. https://doi.org/10.1186/S40658-016-0155-2/TABLES/2
8. Jones, K. M., Pollard, A. C., Pagel, M. D., Pagel, M., Jones, K., & Pollard, A. (2018). Clinical applications of chemical exchange saturation transfer (CEST) MRI. Journal of Magnetic Resonance Imaging, 47(1), 11–27. https://doi.org/10.1002/JMRI.25838
9. Zhou, Y., Bie, C., van Zijl, P. C. M., & Yadav, N. N. (2022). The relayed nuclear Overhauser effect in magnetization transfer and chemical exchange saturation transfer MRI. NMR in Biomedicine, e4778. https://doi.org/10.1002/NBM.4778
10. Kim, M., Gillen, J., Landman, B. A., Zhou, J., & van Zijl, P. C. M. (2009). WAter Saturation Shift Referencing (WASSR) for chemical exchange saturation transfer experiments. Magnetic Resonance in Medicine : Official Journal of the Society of Magnetic Resonance in Medicine / Society of Magnetic Resonance in Medicine, 61(6), 1441. https://doi.org/10.1002/MRM.21873
11. Zaiss, M., Schmitt, B., & Bachert, P. (2011). Quantitative separation of CEST effect from magnetization transfer and spillover effects by Lorentzian-line-fit analysis of z-spectra. Journal of Magnetic Resonance (San Diego, Calif. : 1997), 211(2), 149–155. https://doi.org/10.1016/J.JMR.2011.05.001
12. Díaz, M., Fabelo, N., Casañas-Sánchez, V., Marin, R., Gómez, T., Quinto-Alemany, D., & Pérez, J. A. (2016). Hippocampal Lipid Homeostasis in APP/PS1 Mice is Modulated by a Complex Interplay Between Dietary DHA and Estrogens: Relevance for Alzheimer’s Disease. Journal of Alzheimer’s Disease, 49(2), 459–481. https://doi.org/10.3233/JAD-150470
13. Chen, L., Wei, Z., Chan, K. W. Y., Cai, S., Liu, G., Lu, H., Wong, P. C., van Zijl, P. C. M., Li, T., & Xu, J. (2019). Protein aggregation linked to Alzheimer’s disease revealed by saturation transfer MRI. NeuroImage, 188, 380–390. https://doi.org/10.1016/J.NEUROIMAGE.2018.12.018
14. Nilsson, P., Saito, T., & Saido, T. C. (2014). New mouse model of Alzheimer’s. ACS Chemical Neuroscience, 5(7), 499–502. https://doi.org/10.1021/CN500105P/ASSET/IMAGES/LARGE/CN-2014-00105P_0002.JPEG
Figures