3169
No denoising, no diamonds? - In silico analysis of denoising methods for CEST MR imaging1University Dusseldorf, Medical Faculty, Department of Diagnostic and Interventional Radiology, Düsseldorf, Germany, Düsseldorf, Germany
Synopsis
Keywords: CEST & MT, In Silico
CEST imaging requires a high SNR to detect low metabolite concentrations, especially at clinical used magnetic field strength (3 Tesla). In recent years, various approaches have been used to denoise CEST data. Our study investigated the performance of different denoising algorithms using 1000 synthetic CEST MR data. Our results showed that PCA produced the best denoising results for CEST MR imaging in a simulation study.Introduction
Chemical exchange and saturation transfer (CEST) imaging provides information about solutes at low concentrations [1,2]. However, like other biosensitive MR techniques, CEST imaging requires a high signal-to-noise ratio (SNR) to detect low CEST effects with MTRasym values below 5%. Therefore, large field strengths are required to detect metabolites of the lowest concentrations. However, there is a clinical interest in CEST imaging for clinical field strengths. The use of averaging or acquiring many frequencies with a small step size allows noise suppression but increases measurement time. Therefore, several noise reduction algorithms have been developed in recent years. However, to our knowledge, no study has quantitatively investigated different algorithms and filter sizes for CEST imaging. Therefore, our study aimed to examine the potential of (1) principal component analysis (PCA), (2) nonlocal mean filtering (NLM), and (3) Block matching combined with 3D filtering (BM3D) for CEST imaging. While the PCA method, based on classification into signal-related and noise-related components over all pixels and offset frequencies, provides noise reduction, the NLM and BM3D approaches are based on filtering using the surrounding pixels. BM3D extends NLM and consists of two cascades, a hard thresholding stage (step 1) and a Wiener filtering stage (step 2), in which 2D blocks are grouped into 3D data arrays and then transformed by collaborative filtering and aggregation.Methods
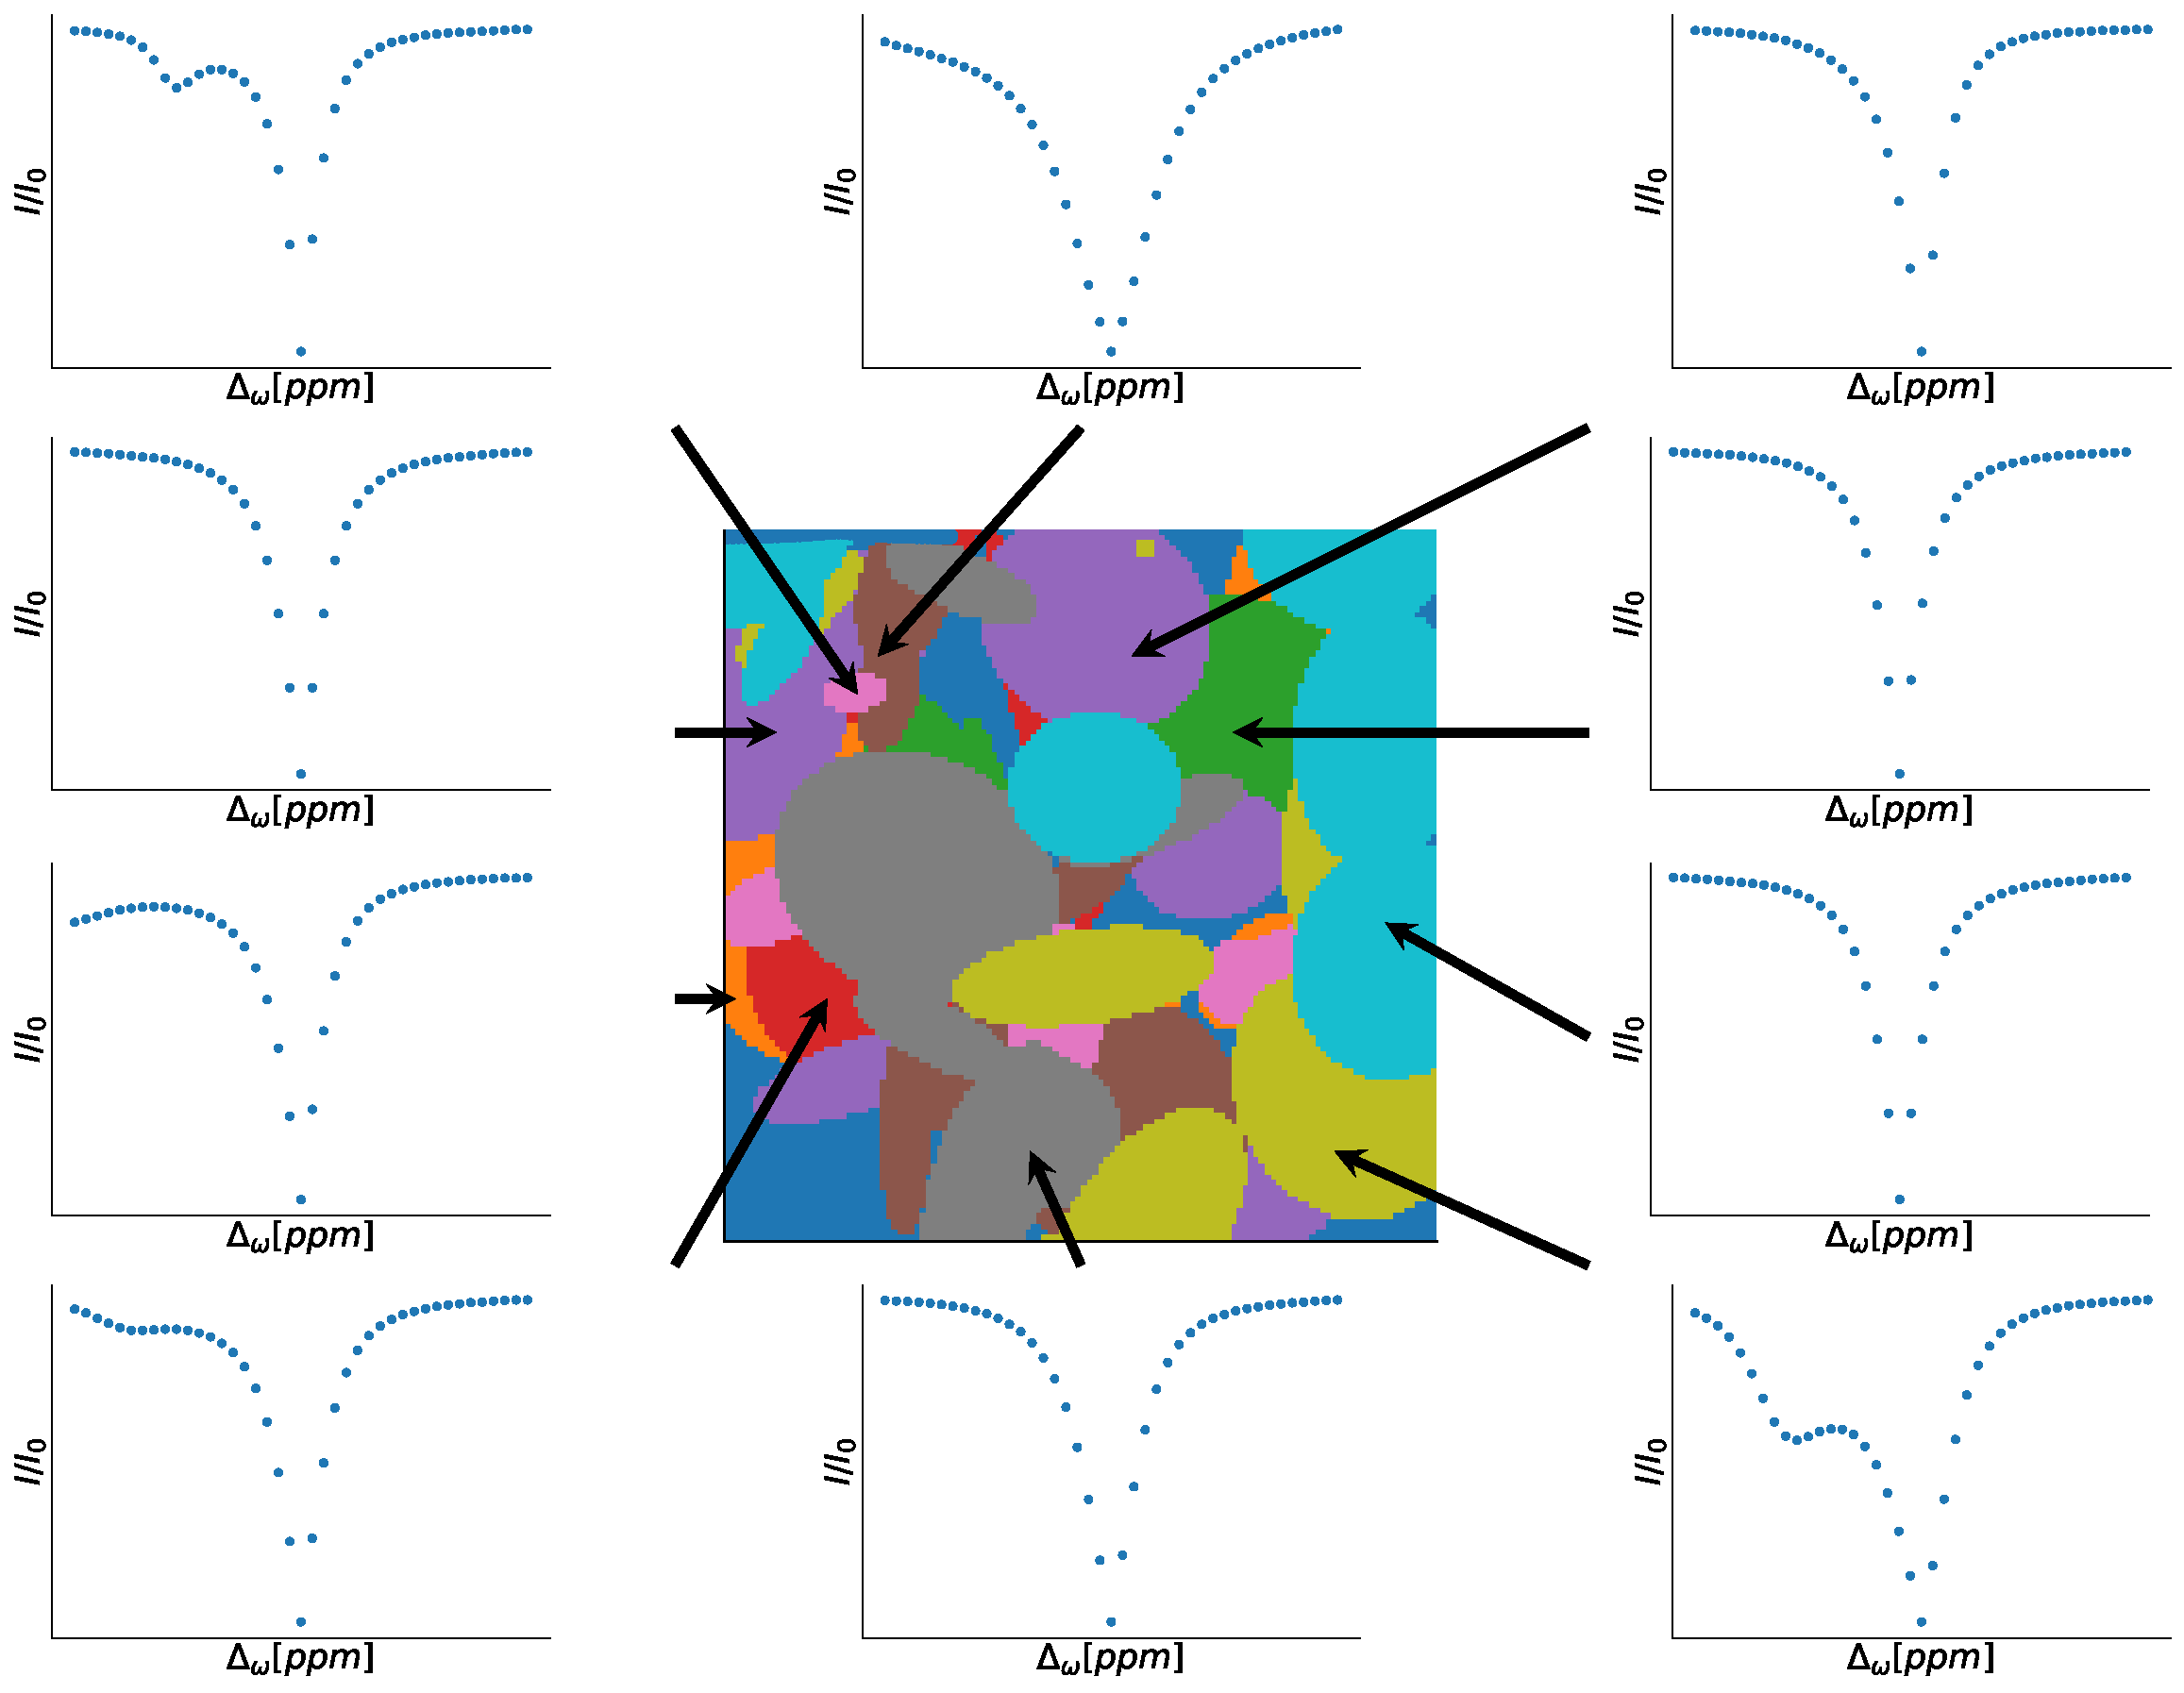
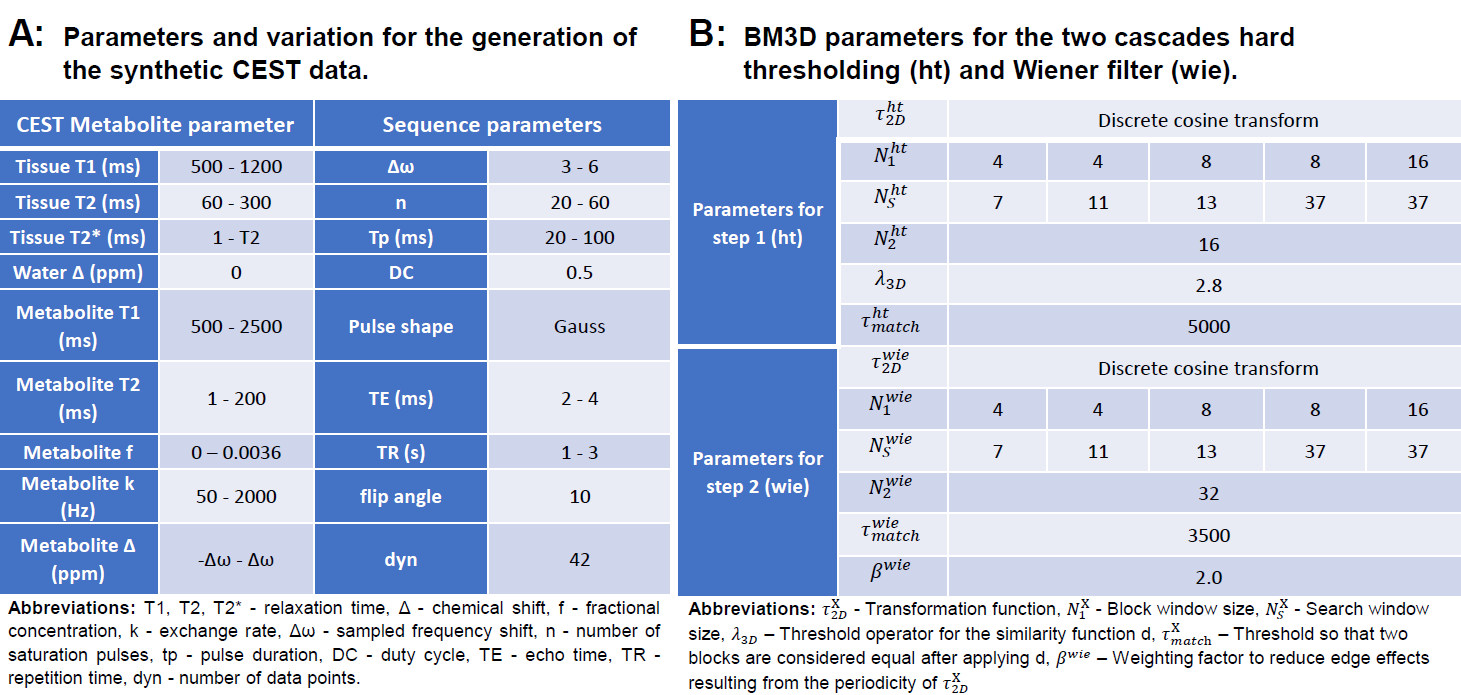
First, 1000 random phantoms were created, each with ten different regions (Figure 1) and 128 x 128 pixels. Then, pool-specific parameters such as exchange rates (k), T1 and T2 relaxation times, and chemical shifts were randomly assigned to each region in the phantom (Figure 2A), and assuming a two-pool system (tissue pool and metabolite pool), Z-spectra were calculated (Figure 1) for a field strength of 3 Tesla. The 2D Fourier transform and white noise (sigma = 0.05 and 0.1) were used to add noise to the Z spectra. Finally, we denoised each phantom and noise level separately with 12 different denoising methods. For the PCA method, we tested the "Median,” "Nelson", and "Malinowski" criteria, analogous to the study of Breitling et al., to determine the optimal number of principal components [2]. For the NML method, we varied the search window sizes (3x3, 5x5, 7x7, 11x11 pixels). For the BM3D method, the parameters were analogous to the optimization of Dabov et al., where we varied both the 2D block size (N1ht) and the search window size (NSht) (Figure 2B) [3]. To evaluate the different configurations in terms of their denoising performance, we determined the peak signal-to-noise ratio (PSNR) across all voxels and offset frequencies. We created MTRasym maps to visualize denoising performance for a metric commonly used in clinical studies.Results
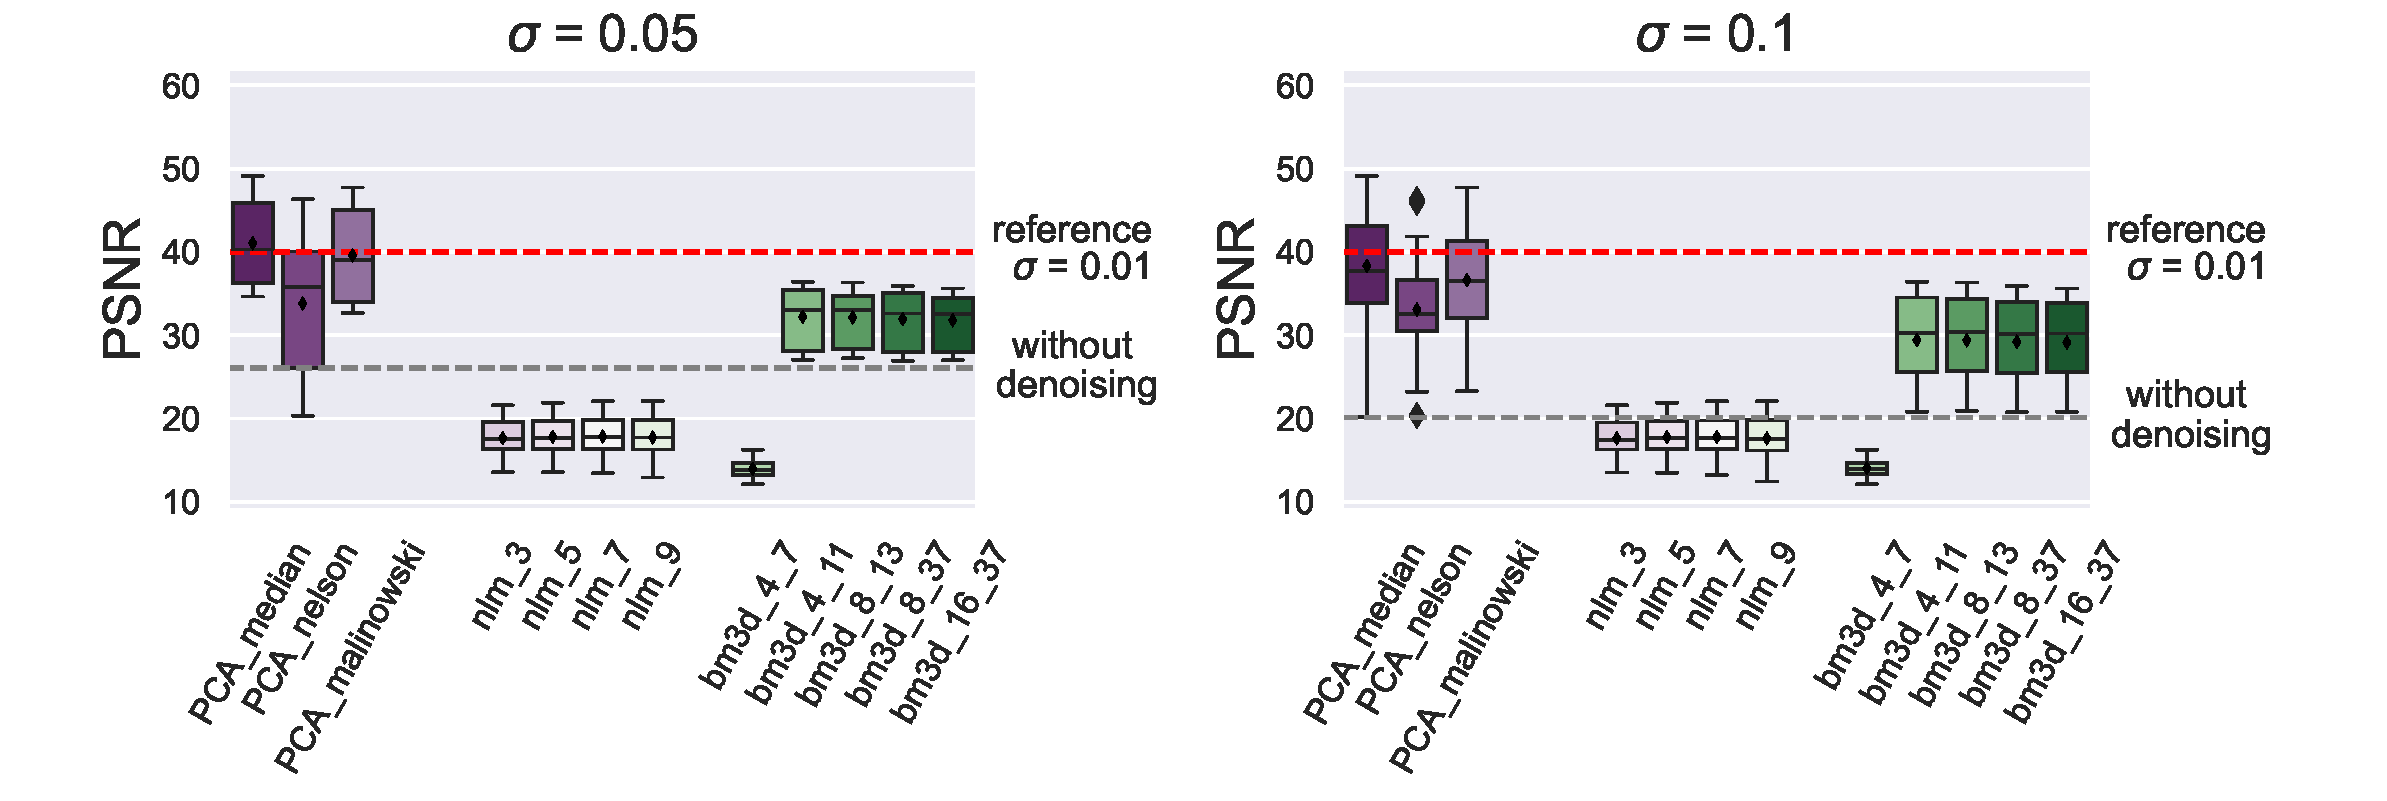
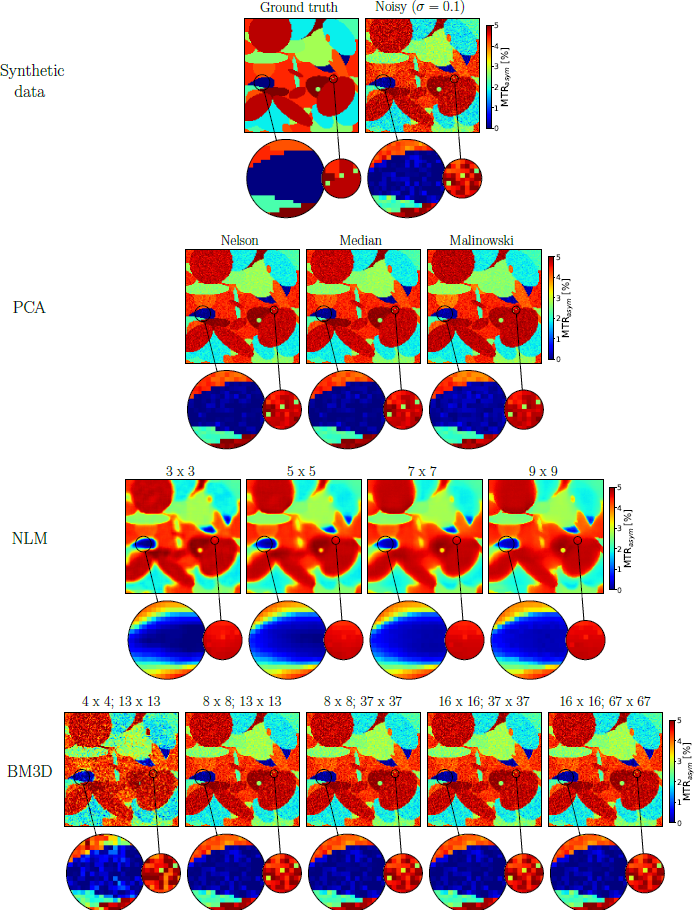
For the PSNR values as a function of noise level, we found that both the PCA and the BM3D cascade filter resulted in a substantial reduction of noise (Figure 3). The “Median” and “Malinowski“ criteria consistently provided the highest PSNR values at all noise levels. In contrast, the NLM method improved PSNR values only at high noise levels, regardless of search window size. However, it is interesting to note that although the NLM method provided the most homogeneous denoised images, the signal differences between different pool regions resulted in smoothing borders (Figure 4, left zoom) and the disappearance of small areas (Figure 4, right zoom). In comparison, BM3D, especially with large search windows, and the PCA method provide less homogeneous results, but the signal of different regions is not averaged. As a result, even small areas could be denoised.Discussion
For the PSNR values as a function of noise level, we found that both the PCA and the BM3D cascade filter resulted in a substantial reduction of noise (Figure 3). The “Median” and “Malinowski“ criteria consistently provided the highest PSNR values at all noise levels. In contrast, the NLM method improved PSNR values only at high noise levels, regardless of search window size. However, it is interesting to note that although the NLM method provided the most homogeneous denoised images, the signal differences between different pool regions resulted in smoothing borders (Figure 4, left zoom) and the disappearance of small areas (Figure 4, right zoom). In comparison, BM3D, especially with large search windows, and the PCA method provide less homogeneous results, but the signal of different regions is not averaged. As a result, even small areas could be denoised.Conclusion
The main finding of our study is that denoising methods can contribute significantly to increasing SNR and thus to more accurate detection of CEST effects. In particular, the PCA method proved suitable for CEST-MR in this context.Funding Statement
Patrik Jan Gallinnis was supported by the Jürgen Manchot Foundation.Acknowledgements
No acknowledgement found.References
[1] Radke KL, Wilms LM, Frenken M, et al. Lorentzian-Corrected Apparent Exchange-Dependent Relaxation (LAREX) Ω-Plot Analysis-An Adaptation for qCEST in a Multi-Pool System: Comprehensive In Silico, In Situ, and In Vivo Studies. Int J Mol Sci. 2022 Jun 22;23(13):6920. doi: 10.3390/ijms23136920
[2] Breitling J, Deshmane A, Goerke S, et al. Adaptive denoising for chemical exchange saturation transfer MR imaging, NMR in Biomedicine 2019; doi: 10.1002/nbm.4133
[3] Dabov K, Foi A, Katkovnik V, et al. Image Denoising by Sparse 3-D Transform-Domain Collaborative Filtering; IEEE Transactions of image processing, VOL. 16; NO. 8, 2007: doi: 10.1109/TIP.2007.901238
[4] Akbey, S, Ehses, P, Stirnberg, R, Zaiss, M, Stöcker, T. Whole-brain snapshot CEST imaging at 7 T using 3D-EPI. Magn Reson Med. 2019; 82: 1741– 1752. https://doi.org/10.1002/mrm.27866
Figures