3167
Can pH can be a marker of hypoxia? Role of MRI CEST pH imaging in differentiating hypoxic from non-hypoxic tumors.1Russell H. Morgan Department of Radiology and Radiological Science, Johns Hopkins University School of Medicine, Baltimore, MD, United States, 2F.M. Kirby Research Center for Functional Brain Imaging, Kennedy Krieger Institute, Baltimore, MD, United States, 3James Buchanan Brady Urological Institute and Department of Urology, Johns Hopkins University School of Medicine, Baltimore, MD, United States
Synopsis
Keywords: CEST & MT, CEST & MT, CEST MRI, hypoxia, acidosis, pH, Iopamidol, breast cancer, HIF-1 alpha
Acidosis and hypoxia play a key role in developing metastasis and chemoresistance in tumors. pH measurement can be used as indicator of hypoxia and can provide insights into the metastatic potential of tumors. This study have explored chemical exchange-dependent saturation transfer (CEST) MRI based pH imaging to differentiate between two types of breast tumor models differing in their Hypoxia Inducible Factor-1α (mediator for hypoxia related adaptations in tumors) expression. Tumor acidification was observed in both with lower average extracellular pH (pHe = 6.1) in tumors with intact HIF-1α expression compared to those with HIF-1α silenced group (pHe = 6.2).
Introduction
Acidosis and hypoxia are two features of the tumor microenvironment that result in immune evasion, aggressiveness and resistance to therapy. Tumor acidity is generally considered to be a result of the metabolic shift caused due to stabilization of hypoxia inducible factors (HIFs) and further transcriptional activation of target genes by HIFs leading to accumulation of extracellular lactic acid.1 Hypoxia inducible factor-1α also plays a major role in inducing the transcriptional activation of several pathways including angiogenesis, metabolism, proliferation, metastasis, and differentiation involved in adapting the tumor microenvironment to therapy.2 While a number of studies have explored hypoxia, acidosis is emerging as a marker for cancer proliferation, metastasis, aggressiveness and resistance. Recently chemical exchange saturation transfer (CEST) MRI imaging has been established as superior to other MRI technologies for measuring tissue pH due to its capabilities of signal amplification and multiplexed detection3-5. In this study, using genetically engineered MDA-MB-231 breast cancer cells to stably downregulate HIF-1α (231- HIF-1α shRNA), we investigated CEST MRI based pH mapping as a tool to detect changes in HIF expression in a xenograft mouse model.Methods
Two groups of murine breast tumor models were used for the study by inoculating ~2 million 231-HIF-1α shRNA or an empty vector expressing (231-EV) MDA-MB-231 cell line in the mammary fat pad of female SCID mice. These cells lines have been characterized previously for HIF expression using western blotting. CEST contrast MR pH imaging was conducted on an 11.7 T Bruker horizontal bore animal scanner using an eight-channel mouse body phased-array receive coil with tumor sizes between 200-300 mm3. Z-spectra were acquired using a single-shot RARE sequence with centric encoding, parameters: TR/TE=6.5s/3.5 ms preceded by a ω1=3.6 µT Tsat=4 s saturation pulse and a fat-suppression module. A series of 61 MR frequencies were acquired in the frequency offset range ±10 ppm. We used an acquisition matrix of 64x64 reconstructed to 128x128 for a field of view of 3x3cm2 with a slice thickness=1.5mm. MR CEST images were repeated eight times, once before and seven times after intravenous injection of Iopamidol contrast agent (dose = 4 g iodine/kg bw). Total scan time=48 min. For pH mapping, post-injection magnetization transfer ratio (MTR) values at 4.3 and 5.5 ppm were quantified at 30 min post-injection. Pre-injection MTR maps were then subtracted from the post-injection MTR images to remove endogenous CEST signals. Tumor pH values were obtained by calculating the concentration-independent saturation transfer ratio RST=(1-MTR4.3ppm)×MTR5.5ppm/((1-MTR4.3ppm)×MTR5.5ppm) and using a pH calibration with MTR values of 25 mM Iopamidol in PBS followed by titration to pH values of 5.8, 6.1, 6.4, 6.7, 7.0 and 7.3.Results
Western blots of 231-EV and 231-HIF-1α shRNA cells exposed to 4 hours of true hypoxia confirmed absence of hypoxia induced HIF-1α expression in knockdown cells (Figure 1). Figure 2 shows the pH dependence of two amide protons of Iopamidol resonating at 4.3 and 5.5 ppm. As observed from MTRasym vs. pH plots, the CEST effect is markedly pH-dependent for both pools of exchangeable protons, with minimum values at pH=5.8 and with a continuous increase up to pH=7.3 for the amide proton set at 4.3 ppm, whereas for the amide proton set at 5.5 ppm, the MTRasym reaches the highest values at lower pH values. At pH<6.1, the 5.5 ppm peak dominates over 4.3 ppm while additional 0.8 and 1.8 ppm peaks were present over these ranges. Figures 3a-f shows T2-weighted anatomical images (a, d), CEST pH maps overlaid over anatomical images (b, e) and pH histograms (c, f) for the two types of tumors. Both breast cancer models showed a marked extracellular acidification with average extracellular pH (pHe) values of 6.1 and 6.2 for MDA-MB-231 and MDA-MB-231 HIF-1α shRNA tumors, respectively with n=3 mice per group.Discussion
Acidosis is a critical, primarily hypoxia driven, environmental change seen in solid tumors that contributes to poor therapeutic outcomes.4 In this study we have evaluated the potential of CEST MRI based pH mapping as a tool to identify changes in HIF-1α expression using the clinically approved contrast agent Iopamidol. The preliminary results obtained from CEST pH mapping shows that tumors expressing HIF-1α are more acidic (pHe=6.1) than the HIF silenced group (pHe=6.2), suggesting that the technique may be useful for identifying the tumors with aggressive and resistance phenotype and for planning therapeutic strategies to target the hypoxic regions based on pH maps.Conclusion
Our preliminary study shows that CEST MRI-based pH imaging of tumors may be a valuable tool for predicting the hypoxic nature and identifying tumors with aggressive phenotype.Acknowledgements
This work is supported by NIH grant R01EB030376 and P41EB024495.References
1. Corbet C, Feron O. Tumour acidosis: from the passenger to the driver's seat. Nat Rev Cancer. 2017 Oct;17(10):577-593. doi: 10.1038/nrc.2017.77. Epub 2017 Sep 15. PMID: 28912578.
2. B Philip, K Ito, R Moreno-Sanchez, SJ Ralph. HIF expression and the role of hypoxic microenvironments within primary tumours as protective sites driving cancer stem cell renewal and metastatic progression. Carcinogenesis, 34 (2013), pp. 1699-1707.
3. Hashim, A. I., Zhang, X., Wojtkowiak, J. W., Martinez, G. V. & Gillies, R. J. Imaging pH and metastasis. NMR Biomed. 24, 582–591 (2011)
4. Anemone, A., Consolino, L., Conti, L. et al. Tumour acidosis evaluated in vivo by MRI-CEST pH imaging reveals breast cancer metastatic potential. Br J Cancer 124, 207–216 (2021).
5. Stabinska J, Singh A, Haney NM, Li Y, Sedaghat F, Kates M, McMahon MT. Noninvasive assessment of renal dynamics and pH in a unilateral ureter obstruction model using DCE MR-CEST urography. Magn Reson Med. 2023 Jan;89(1):343-355. doi: 10.1002/mrm.29436. Epub 2022 Sep 11. PMID: 36089805.
Figures
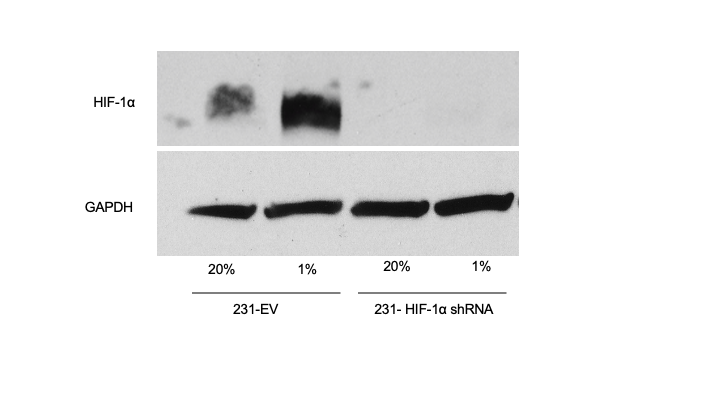
Figure 1: 100μg of total protein from 231-EV and 231- HIF-1α grown under normoxic condition (20% oxygen) or exposed to true hypoxia (1% oxygen) for 4 hours. Lysate was resolved by SDS page and protein transferred to nitrocellulose membrane. The membrane was probed with monoclonal antibody against HIF-1α (top row). Immunoblot against Glyceraldehyde 3-phosphate dehydrogenase (GAPDH) (bottom row) was performed to show equal loading.
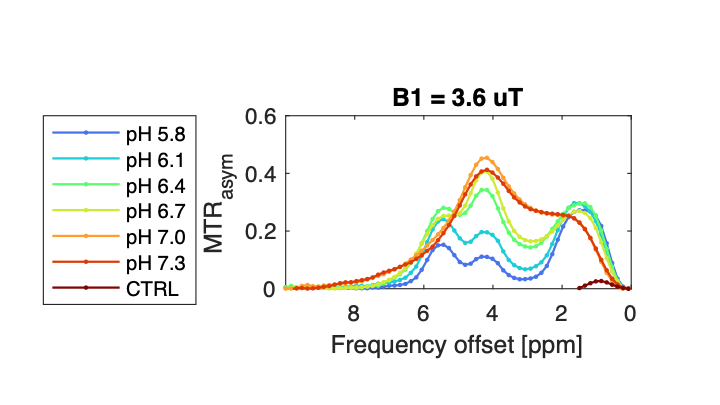
Figure 2: MTRasym vs. pH plot for two sets of amide protons of Iopamidol resonating at 4.3 and 5.5 ppm at a saturation ω1 = 3.6 μT.
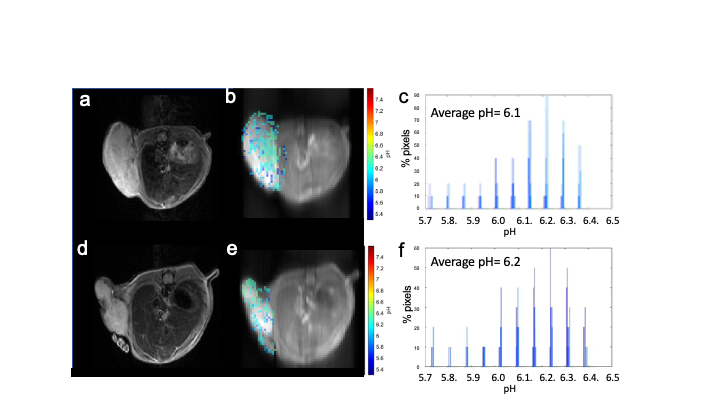
Figure 3: T2-weighted images, CEST pH maps and pH histograms of two tumor models. (a) and (d) T2-weighted images of 231-EV and 231-HIF-1α shRNA tumors, respectively; (b) and (e) CEST pH maps of 231-EV and 231-HIF-1α shRNA tumors, respectively; (c) and (f) pH histograms from 231-EV and 231 HIF-1α shRNA tumors, respectively.