3164
CEST Mapping from Undersampled Z-spectra in the Brain Using Deep Learning1Cedars Sinai Medical Center, Los Angeles, CA, United States, 2Bioengineering, University of California, Los Angeles (UCLA), Los Angeles, CA, United States
Synopsis
Keywords: CEST & MT, Machine Learning/Artificial Intelligence, CEST, frequency offsets, Fisher Information gain
Chemical exchange saturation transfer (CEST) imaging uses radio frequency pulses at different frequency offsets to generate CEST maps. In this work, we used deep learning to calculate CEST maps from steady-state CEST (ss-CEST) images at undersampled frequency offsets, reducing the total scan time by a factor of 3.5. The Z-spectrum was undersampled by selecting the top 15 frequency offsets from Fisher information gain analysis. Fitting results from the proposed method were compared with those from multi-pool fitting with fully sampled Z-spectrum. We showed that it is feasible to reconstruct CEST maps from undersampled, field uncorrected ss-CEST images.Introduction
Images acquired at different frequency offsets are needed to generate CEST maps, prolonging the imaging time. One potential way to reduce the total scan time is by sampling at fewer frequency offsets. Previous works reduced the number of frequency offsets by an overall factor of 1.5 using deep learning and asymmetry analysis [1][2]. Further reduction in the scan time is desirable for routine clinical applications. In this work, we present a method to reduce the total scan time using a neural network and Fisher Information gain analysis to reduce the number of frequency offsets by a factor of 3.5 without requiring specialized image reconstruction. In addition, our neural network directly reconstructs CEST maps from prospectively undersampled, B0 uncorrected steady-state CEST (ss-CEST) data, bypassing the WASSR B0 correction step and reducing the time of traditional physics-based model fitting.Methods
Data collection:The dataset consisted of nine healthy volunteers who underwent MRI scans on a 3T MR system (MAGNETOM Vida, Siemens Healthcare, Erlangen, Germany) with a 1Tx/16Rx-channel head/neck coil. ss-CEST images were acquired at 15 frequency offsets from 100 ppm upfield to 100 ppm downfield (scan time: 1 minute 41 seconds). We also obtained the fully sampled Z-spectrum for comparison at 53 offsets (scan time: 5 minutes 54 seconds/ slice). Three slices were scanned in each volunteer. In total, 27 slices were used for training and testing the neural network. Please see table 1 for detailed imaging parameters.
Network inputs and labels:
Z-spectrum undersampling was designed by selecting the top 15 (of 53) frequency offsets with maximum Fisher information for a typical CEST signal (maximum acceleration). Images were collected by prospectively undersampling the Z-spectrum at these 15 frequency offsets, leading to a 3.5x scan time acceleration. Undersampled, B0-uncorrected Z-spectra at each voxel were fed directly into the neural network as inputs. PCA based denoising [3] was used to denoise the fully-sampled CEST images. WASSR correction was used for B0 correction. After the B0 correction, a multi-pool Lorentzian fitting model was used to generate the CEST maps. Those CEST maps, fitted from fully-sampled data were used as ground truth labels for the supervised neural network training [Fig 1].
Network architecture:
The neural network model was constructed as a U-NET structure with ReLU activation function. L2 loss was used as the loss function. The model was trained for 500 epochs, with a learning rate of 5e-4 and the ADAM optimizer. For training, validation and testing, a 65-15-20 split was used to effectively train the neural network, and slice-wise Leave One Out cross-validation was used to prevent overfitting.
Data analysis:
Root mean squared error (RMSE), structural similarity index (SSIM), peak signal-to-noise ratio (PSNR) and Pearson correlation coefficient were used as quantitative metrics to evaluate the image quality. The paired two-sided T-test was used to evaluate compare the neural network’s performance with the multi-pool fitting model when undersampling is introduced.
Results
Figure 2 shows representative undersampled CEST maps from the proposed method and from multi-pool fitting. The neural network is able to generate a CEST map (Fig. 2B) more faithful to the fully-sampled reference (Fig. 2A) with less noise. The neural network generates CEST maps with lower mean squared error and higher PSNR than the multi-pool fitting model (Table 2).Discussion and Conclusion
Direct multi-pool fitting with undersampled Z-spectra is ill-conditioned and hence results in CEST maps with poor image quality. The proposed neural network is able to generate higher-quality CEST maps from undersampled Z-spectra. Note that the input CEST images were without B0 correction, the WASSR pre scan is not needed for pre-processing, which will significantly save the total scan time. In conclusion, the proposed network can generate CEST maps using CEST images prospectively undersampled to 15 out of 53 frequency offsets, reducing the total scan time by a factor of 3.5. Further validations are needed in patient studies.Acknowledgements
This work was supported in part by NIH R01 EB028146, R01 AR066517, and R01 HL156818.References
[1] Li Y, Xie D, Cember A, et al. Accelerating glucest imaging using Deep Learning for B 0 correction. Magnetic Resonance in Medicine 2020;84:1724–1733. doi: 10.1002/mrm.28289.
[2] Huang J, Lai JH, Tse KH, Cheng GW, Liu Y, Chen Z, Han X, Chen L, Xu J, Chan KW. Deep neural network based CEST and AREX processing: Application in imaging a model of alzheimer’s disease at 3 T. Magnetic Resonance in Medicine 2021;87:1529–1545. doi: 10.1002/mrm.29044.
[3] Breitling J, Deshmane A, Goerke S, Korzowski A, Herz K, Ladd ME, Scheffler K, Bachert P, Zaiss M. Adaptive denoising for Chemical Exchange Saturation Transfer Mr Imaging. NMR in Biomedicine 2019;32. doi: 10.1002/nbm.4133.
Figures
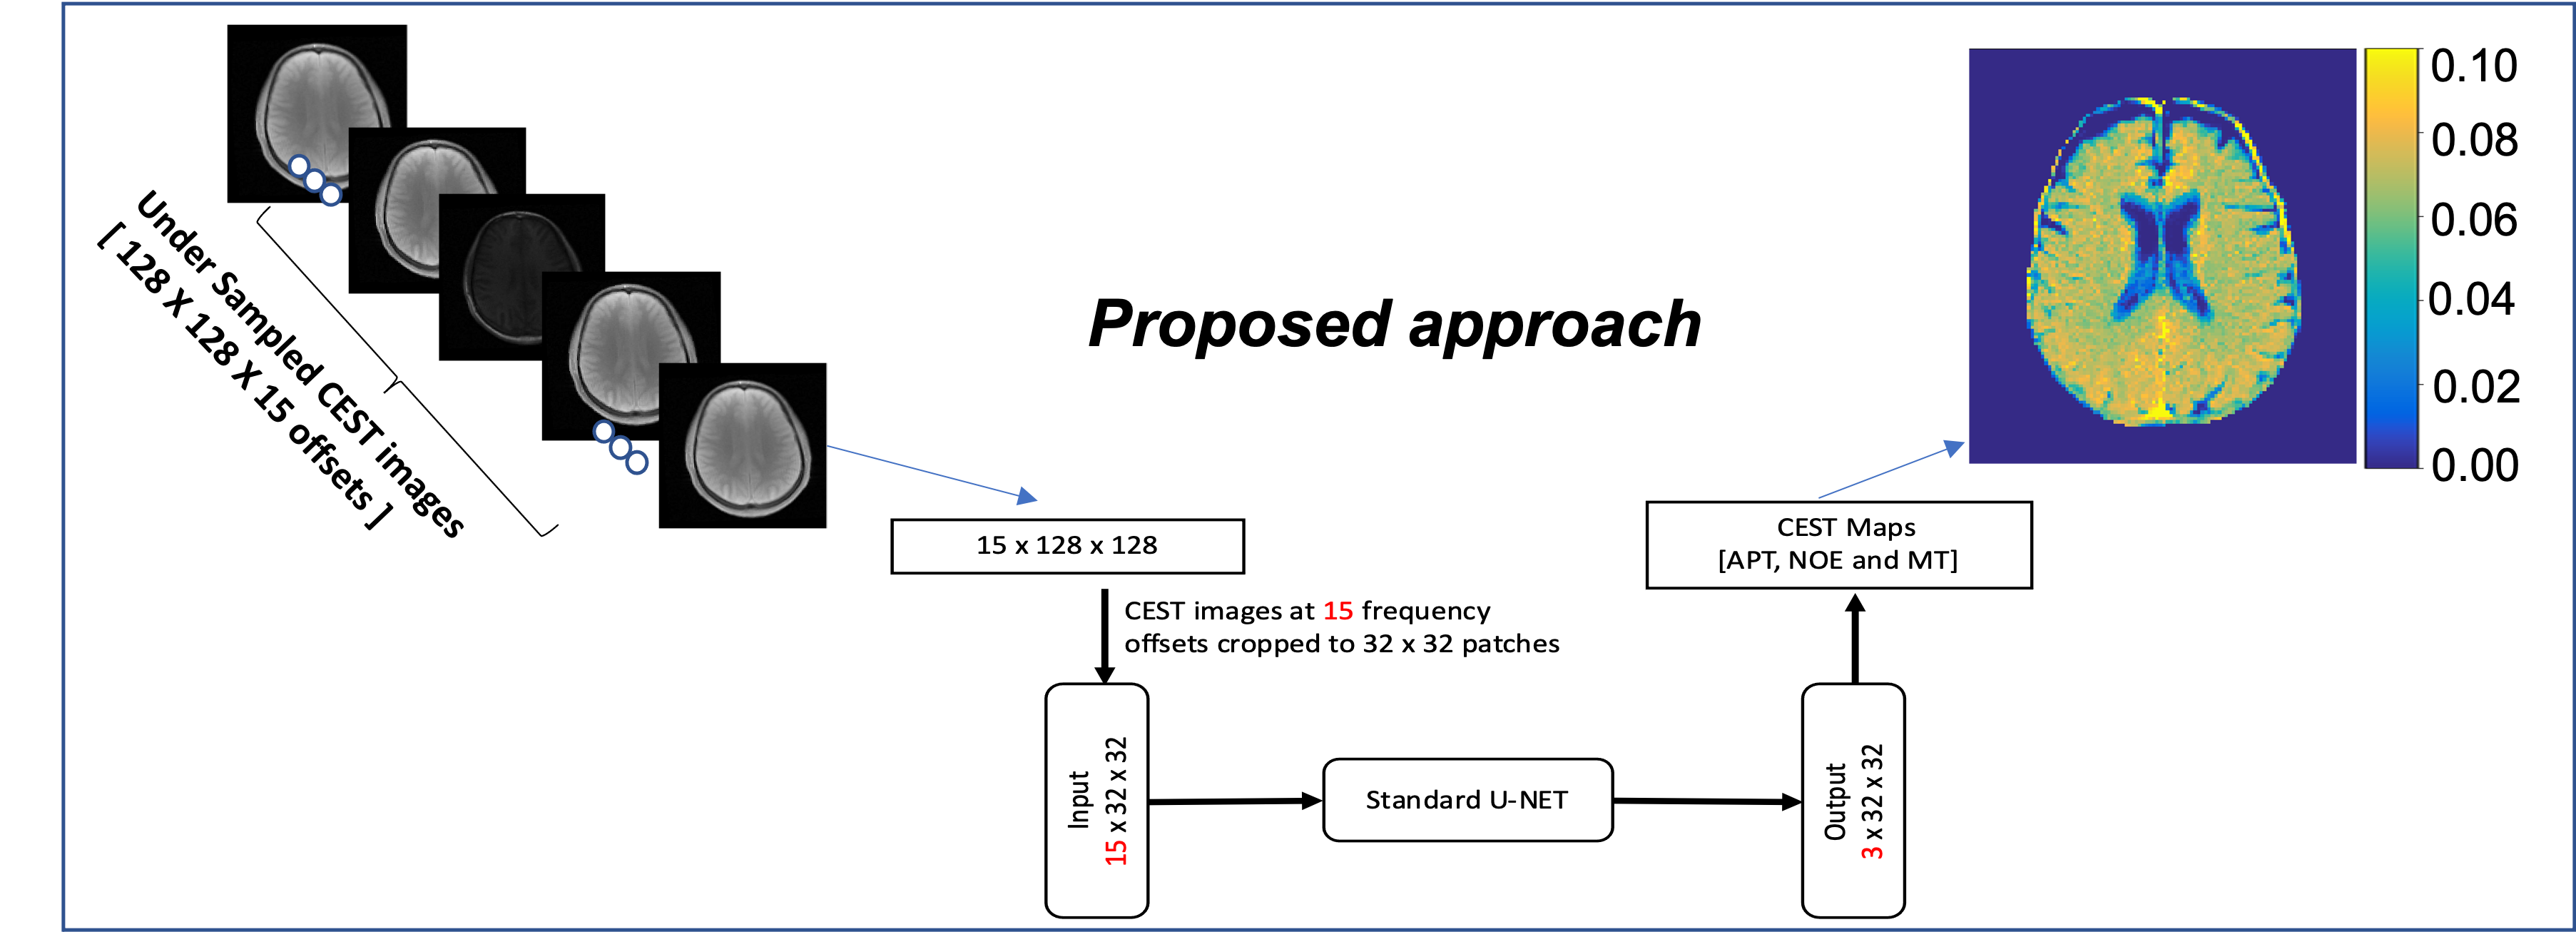
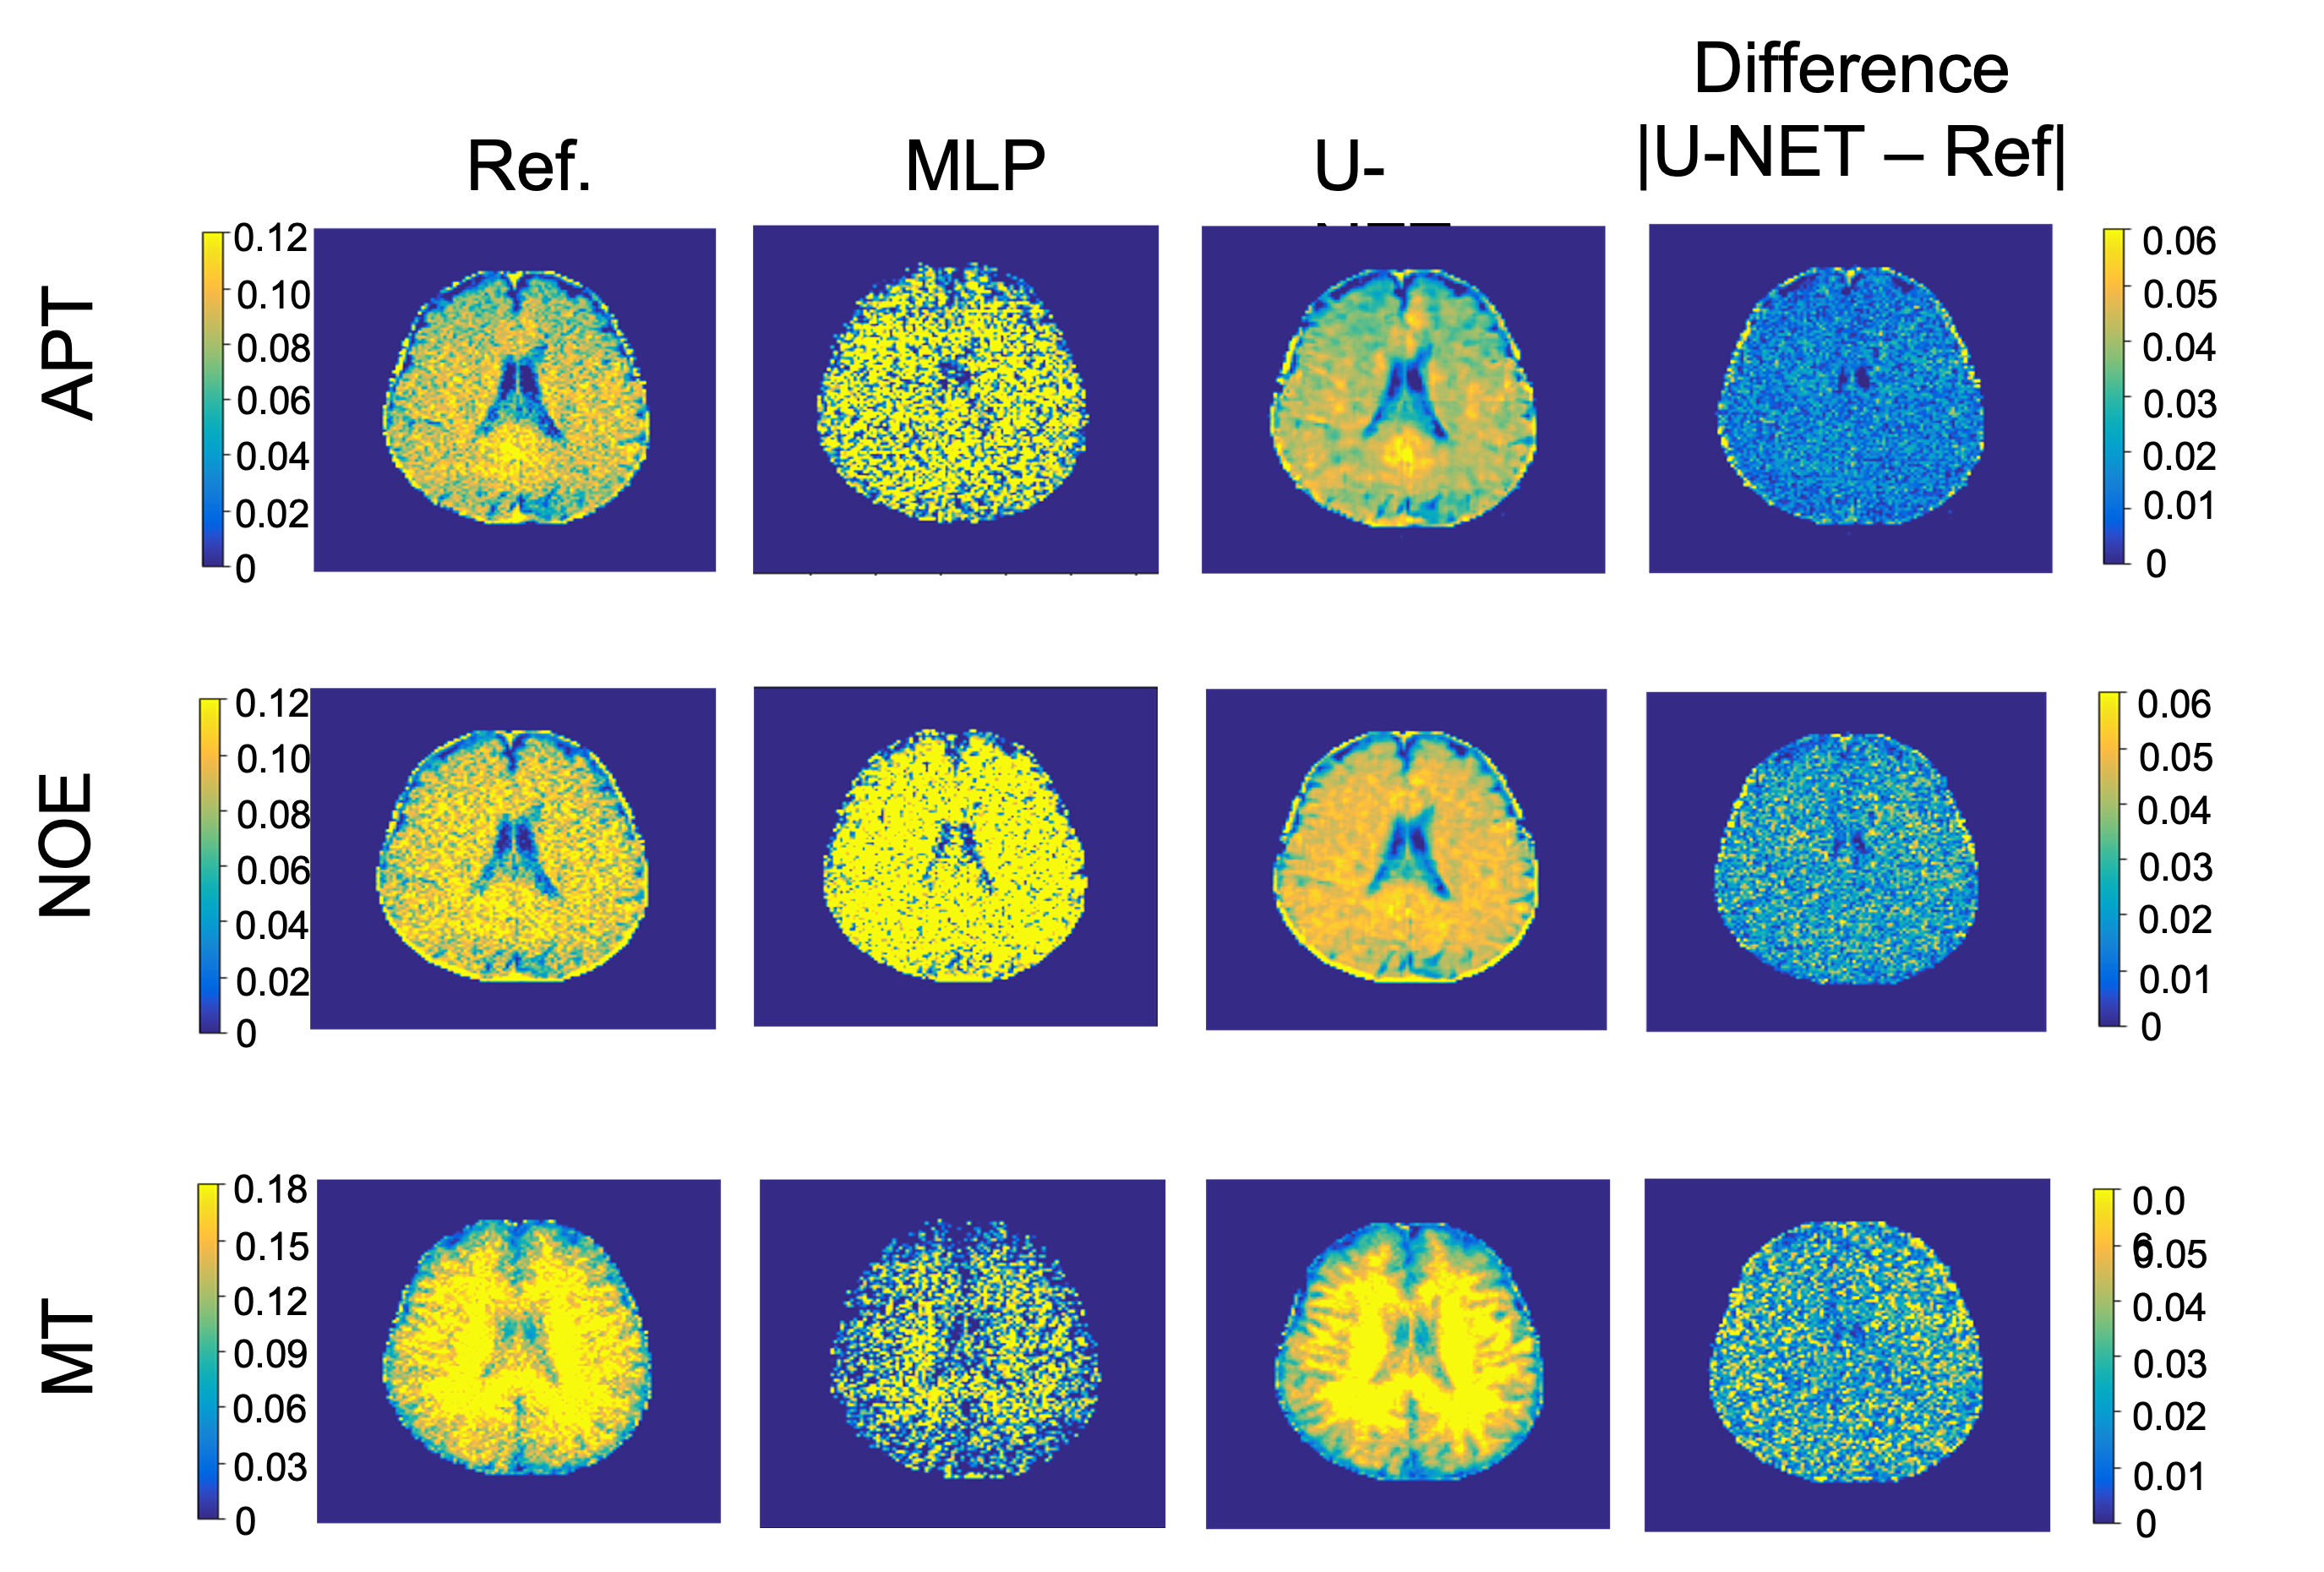
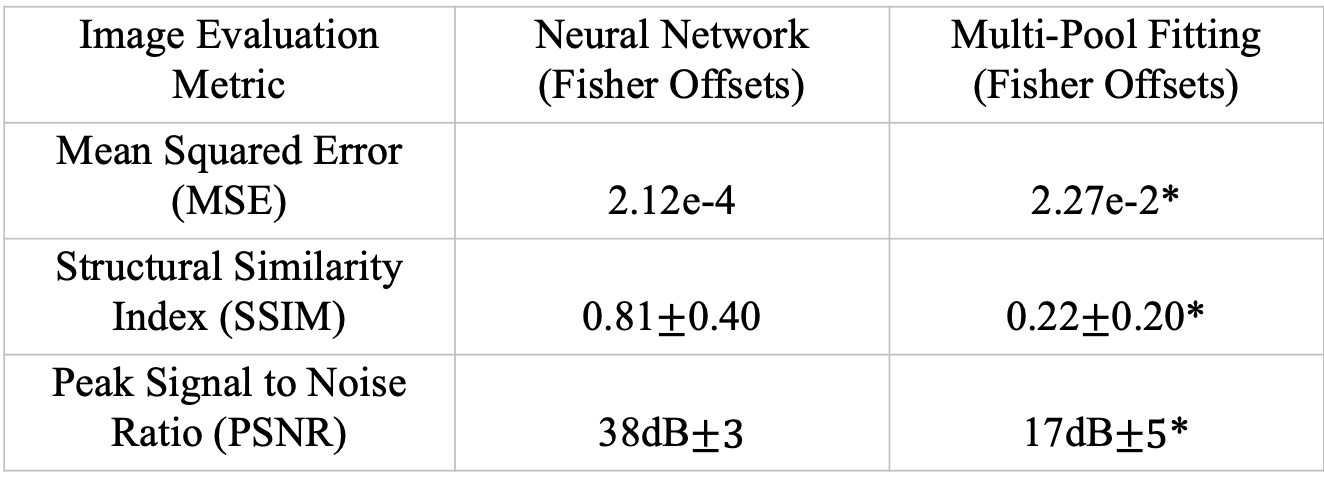
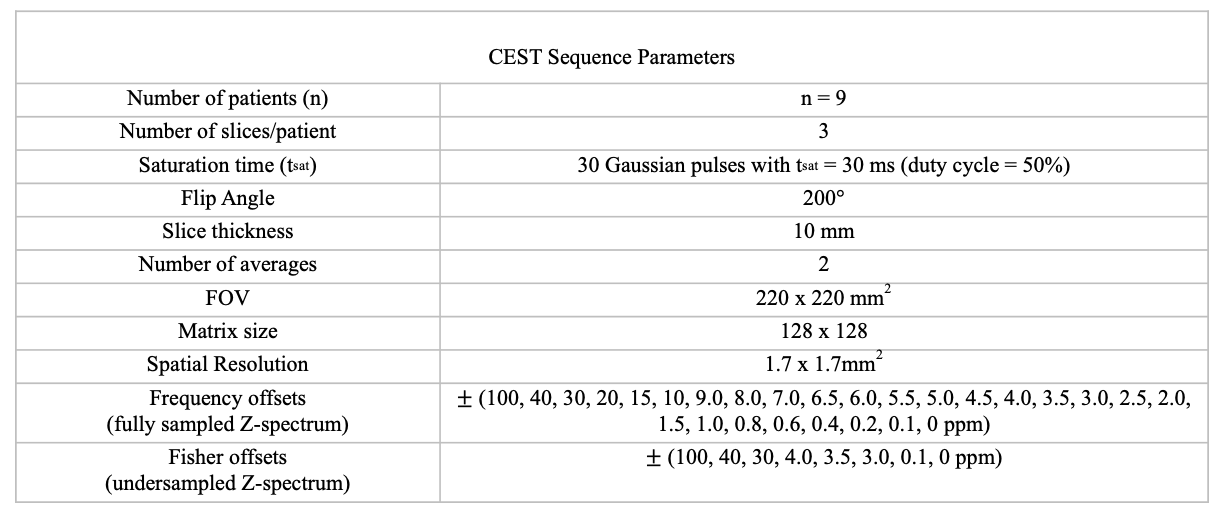
Table 2: Quantitative Image metrics for CEST Maps in the testing dataset. As seen, the neural network based reconstruction of the undersampled Z-spectrum (Fisher offsets) generates the most accurate image.
* value(s) are statistically significant than the CEST maps generated using Neural network (trained on Fisher offsets).