3161
Simultaneous mapping of glycogen and phosphocreatine in human skeletal muscle by saturation transfer MRI1Shenzhen Institute of Advanced Technology, Chinese Academy of Sciences, Shenzhen, China, 2Department of Information Science and Technology, Northwest University, Xi’an, China, 3F.M. Kirby Research Center for Functional Brain Imaging, Kennedy Krieger Institute, Baltimore, MD, United States, 4The Russell H. Morgan Department of Radiology, The Johns Hopkins University School of Medicine, Baltimore, MD, United States
Synopsis
Keywords: CEST & MT, Metabolism
Glycogen and phosphocreatine (PCr) are essential metabolites for maintaining cellular ATP levels. Recent reports show the possibility of PCr mapping in skeletal muscle using CEST MRI but glycogen levels measured using this approach have been inconclusive. Here we report the high-resolution mapping of glycogen and PCr in human skeletal muscle based on relayed nuclear Overhauser effects (glycoNOE) and CEST, respectively. Results at 5T show homogeneous distributions of glycogen and PCr in the calf at levels corresponding to biopsy. Exciting possible applications include localized studies of cellular energetics and noninvasive in situ evaluation of exercise and muscle metabolism in humans.Introduction
Glycogen and phosphocreatine (PCr) are critical for maintaining cellular ATP levels during aerobic and anaerobic exercise. 13C MRS and 31P MRS have been the primary methods for measuring glycogen1-3 and PCr4-6 , respectively, in situ for human studies. However, despite excellent specificity, MRS has low sensitivity and thus cannot generate high-resolution maps. Several groups have recently shown that CEST MRI can map creatine (Cr)7 and PCr8 in human muscle, but glycogen studies have been inconclusive. Recently, a glycogen imaging approach via the relayed nuclear Overhauser effect (rNOE) mechanism (glycoNOE) in saturation transfer (ST) experiments was proposed9 and successfully used to map mouse liver glycogen.10 Here, we report the high-resolution simultaneous mapping of glycogen and PCr in human skeletal muscle at 5T.Materials and Methods
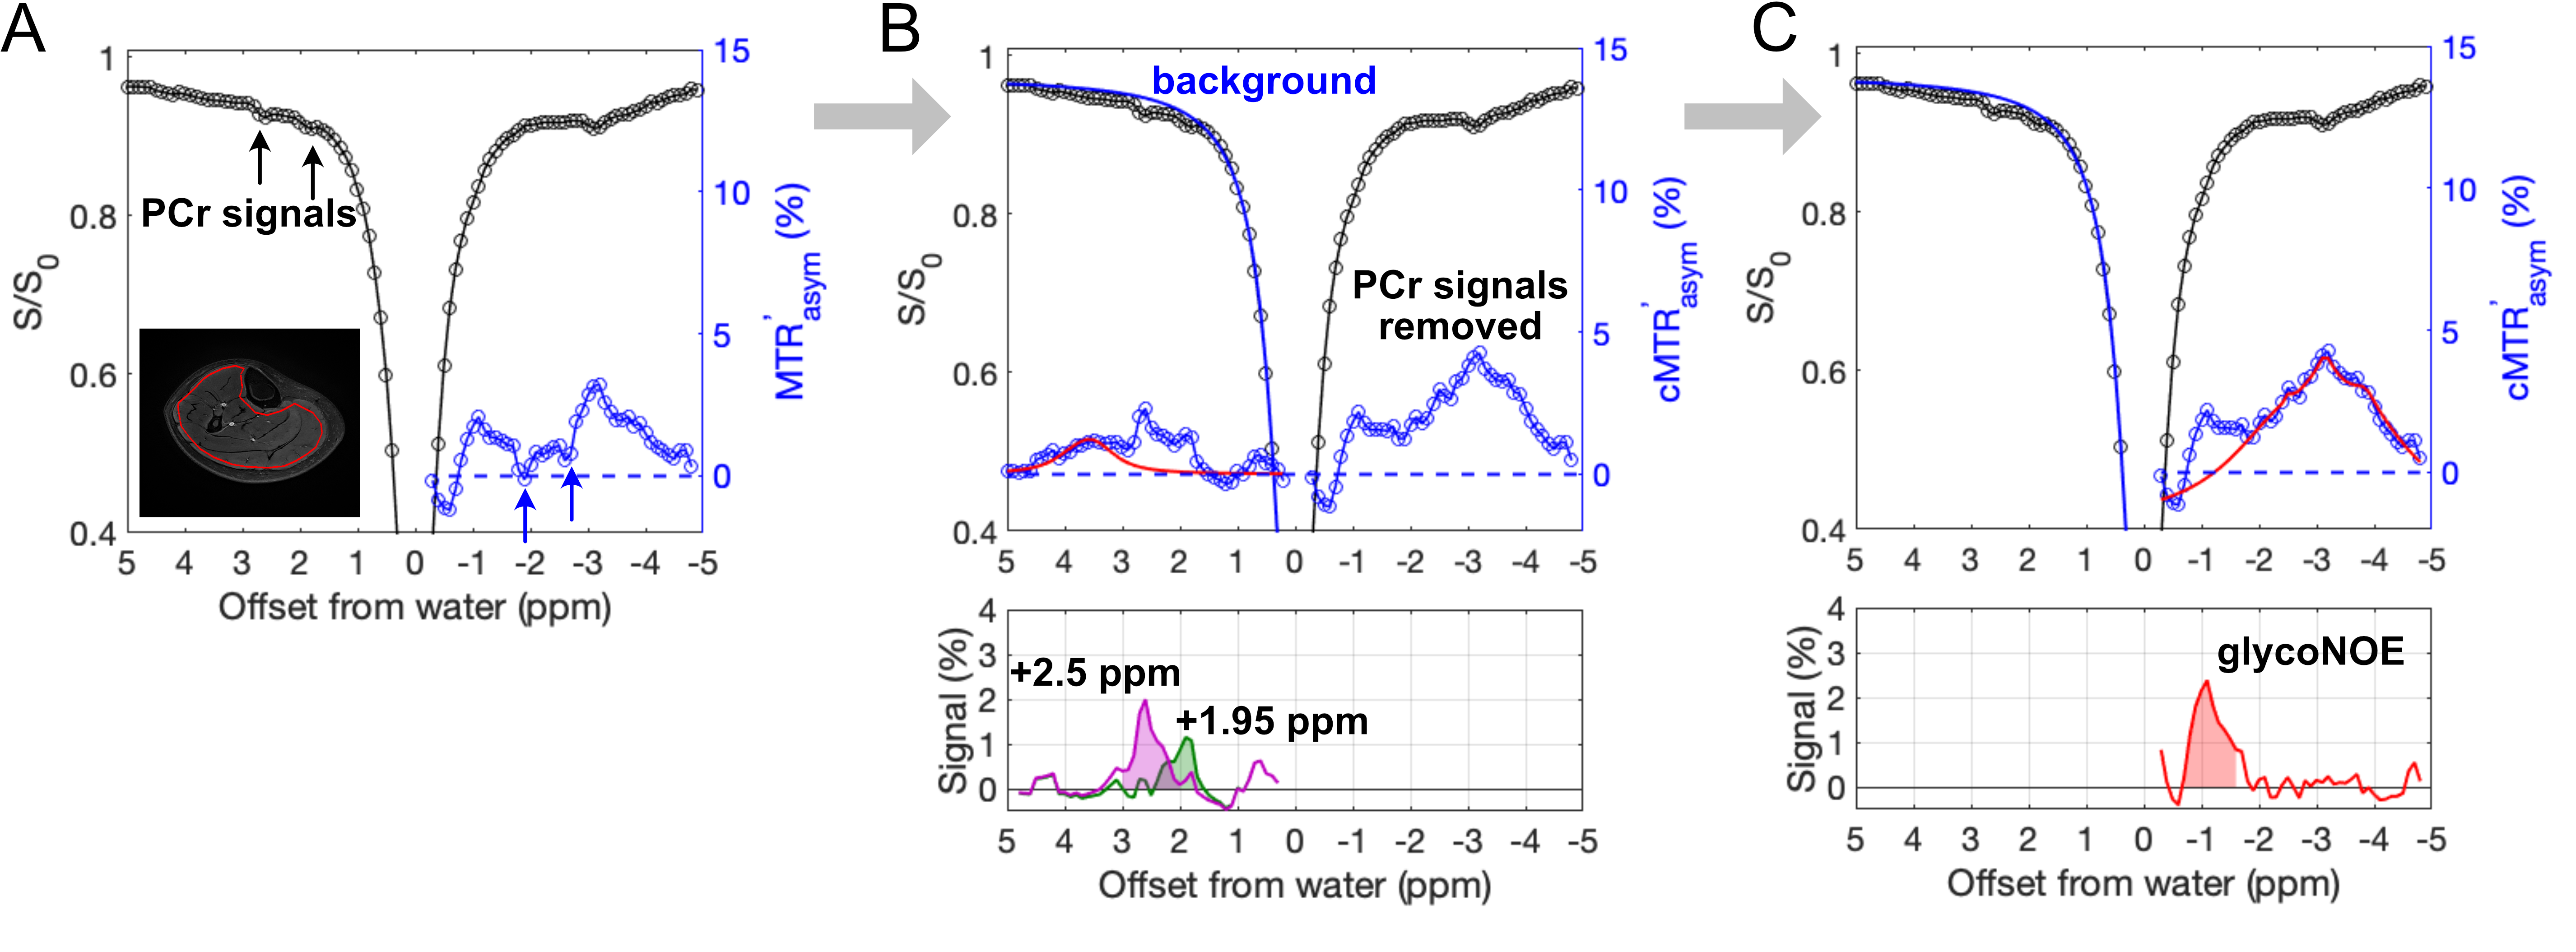
Various concentrations of rabbit liver glycogen, PCr, and Cr were dissolved in phosphate buffered saline (PBS), pH of 7.3, 37°C to calibrate the signal to concentration relationship. Human studies were performed on five male healthy subjects according to institutional guidelines. All participants signed informed consent. All MRI experiments were conducted using a Jupiter 5T human scanner (United Imaging Healthcare, Shanghai, China). Each saturation experiment used 3s CW saturation followed by single-shot FSE readout; multiple Z-spectra were acquired with varied B1. B1 maps were acquired with DREAM sequence.11B0 shifts of Z-spectra were corrected by WASSR method.12 B1 inhomogeneity was compensated by the Z-spectrum based B1-correction method.13 As the glycoNOE signal at -1 ppm was not directly visible in the Z-spectrum of muscle, we hypothesized that the signal was shadowed by the direct water saturation (DS) background. As a first attempt to visualize glycoNOE, a negative MT asymmetry ratio spectrum ($$$MTR'_{asym}$$$, Figure 1A) was computed:
$$$MTR'_{asym}(\triangle\omega)=-MTR_{asym}=\frac{S(+\triangle\omega)}{S(-\triangle\omega)}$$$ [1]
where MTRasym(Δω) is the MT asymmetry ratio spectrum; S(Δω) is the water intensity after pre-saturation at the offset frequency Δω from the water resonance. The -1 ppm peak is visible in the spectrum, however, it may be contaminated by PCr peaks at +1.95 ppm and +2.5 ppm. In addition, the broad background is asymmetric due to contributions from the guanidinium protons of CrCEST and hydroxyl protons of glycoCEST, which are small at the low B1 (0.2 µT). To avoid PCr contamination of the rNOE, we utilized a two-step multi-pool Lorentzian fitting strategy to extract glycoNOE, +1.95 ppm, and +2.5 ppm signals (Figures 1B, C). Firstly, the contamination was removed by estimating the background of the low-field part of Z-spectrum (Background(+Δω)) using a multi-pool Lorentzian fitting, providing the +1.95 ppm and +2.5 ppm signals. Under the assumption of symmetric broad background, a corrected ($$$cMTR'_{asym}$$$) for the up-field Z-spectrum could then be calculated using this background estimate. The resulting $$$cMTR'_{asym}$$$ spectrum was then fitted with multi-pool Lorentzian fitting. The glycoNOE, +1.95 ppm, and +2.5 ppm signals were finally estimated using the integral of the peaks.
Results
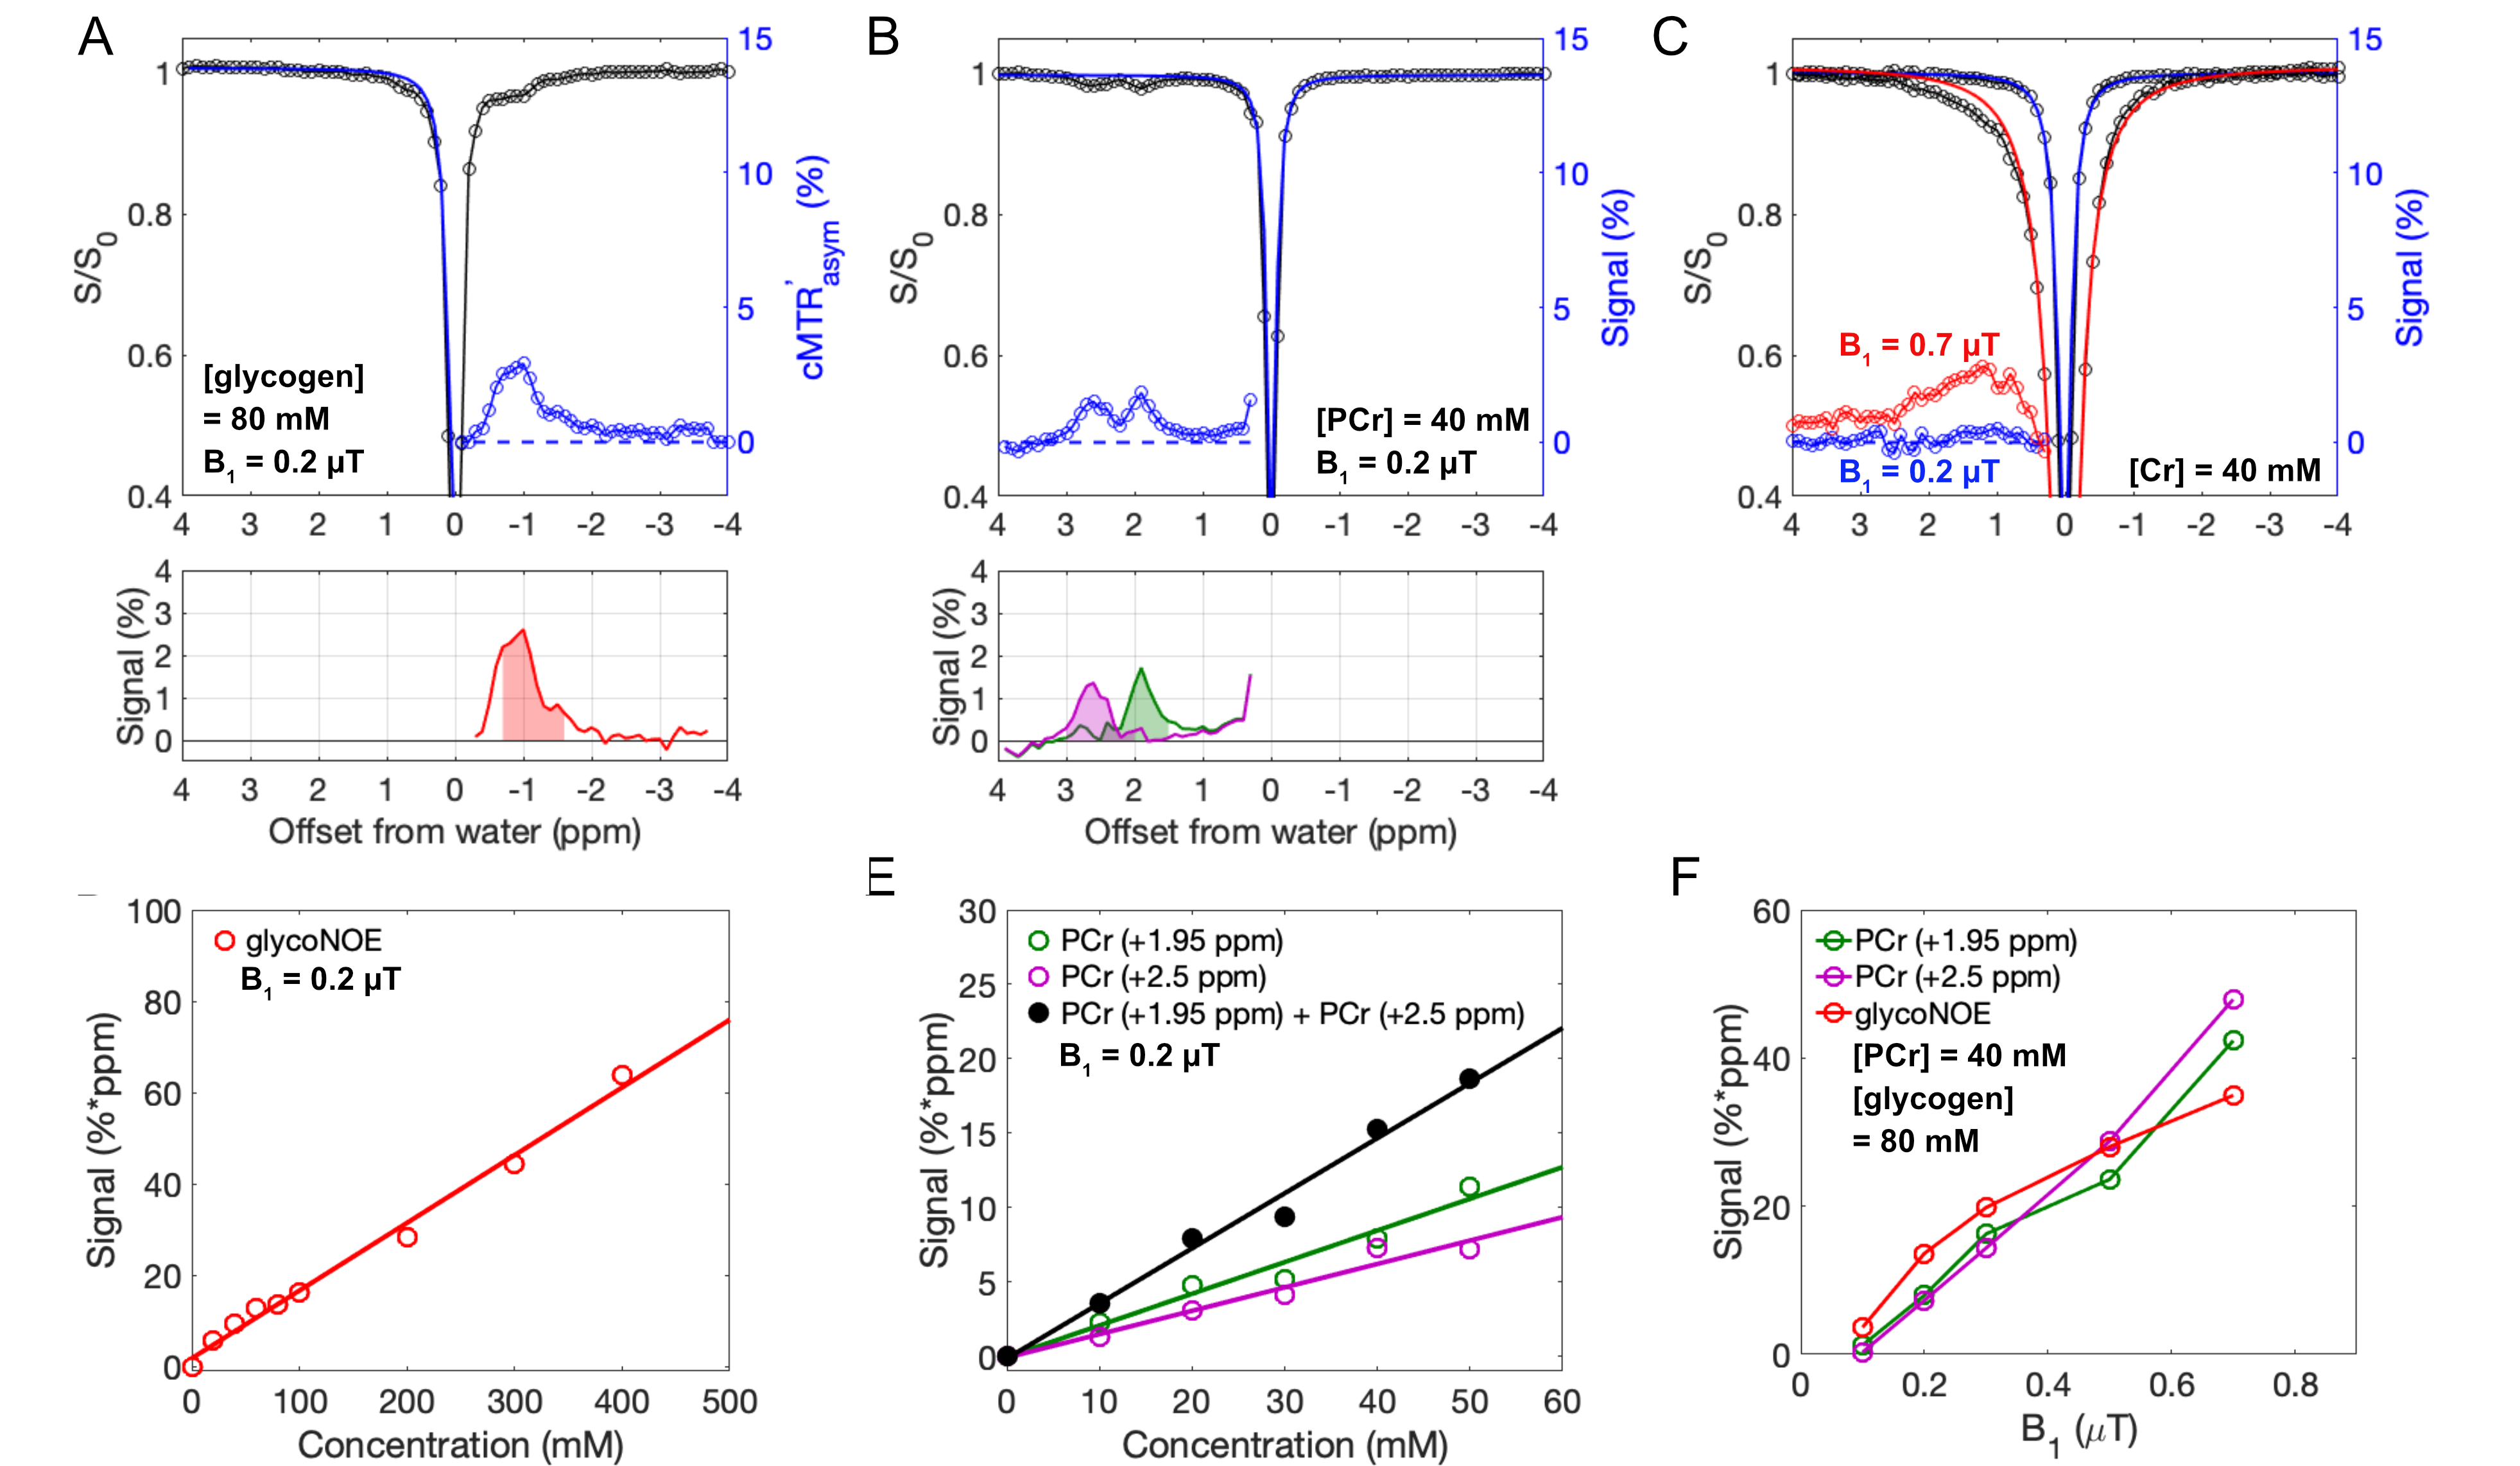
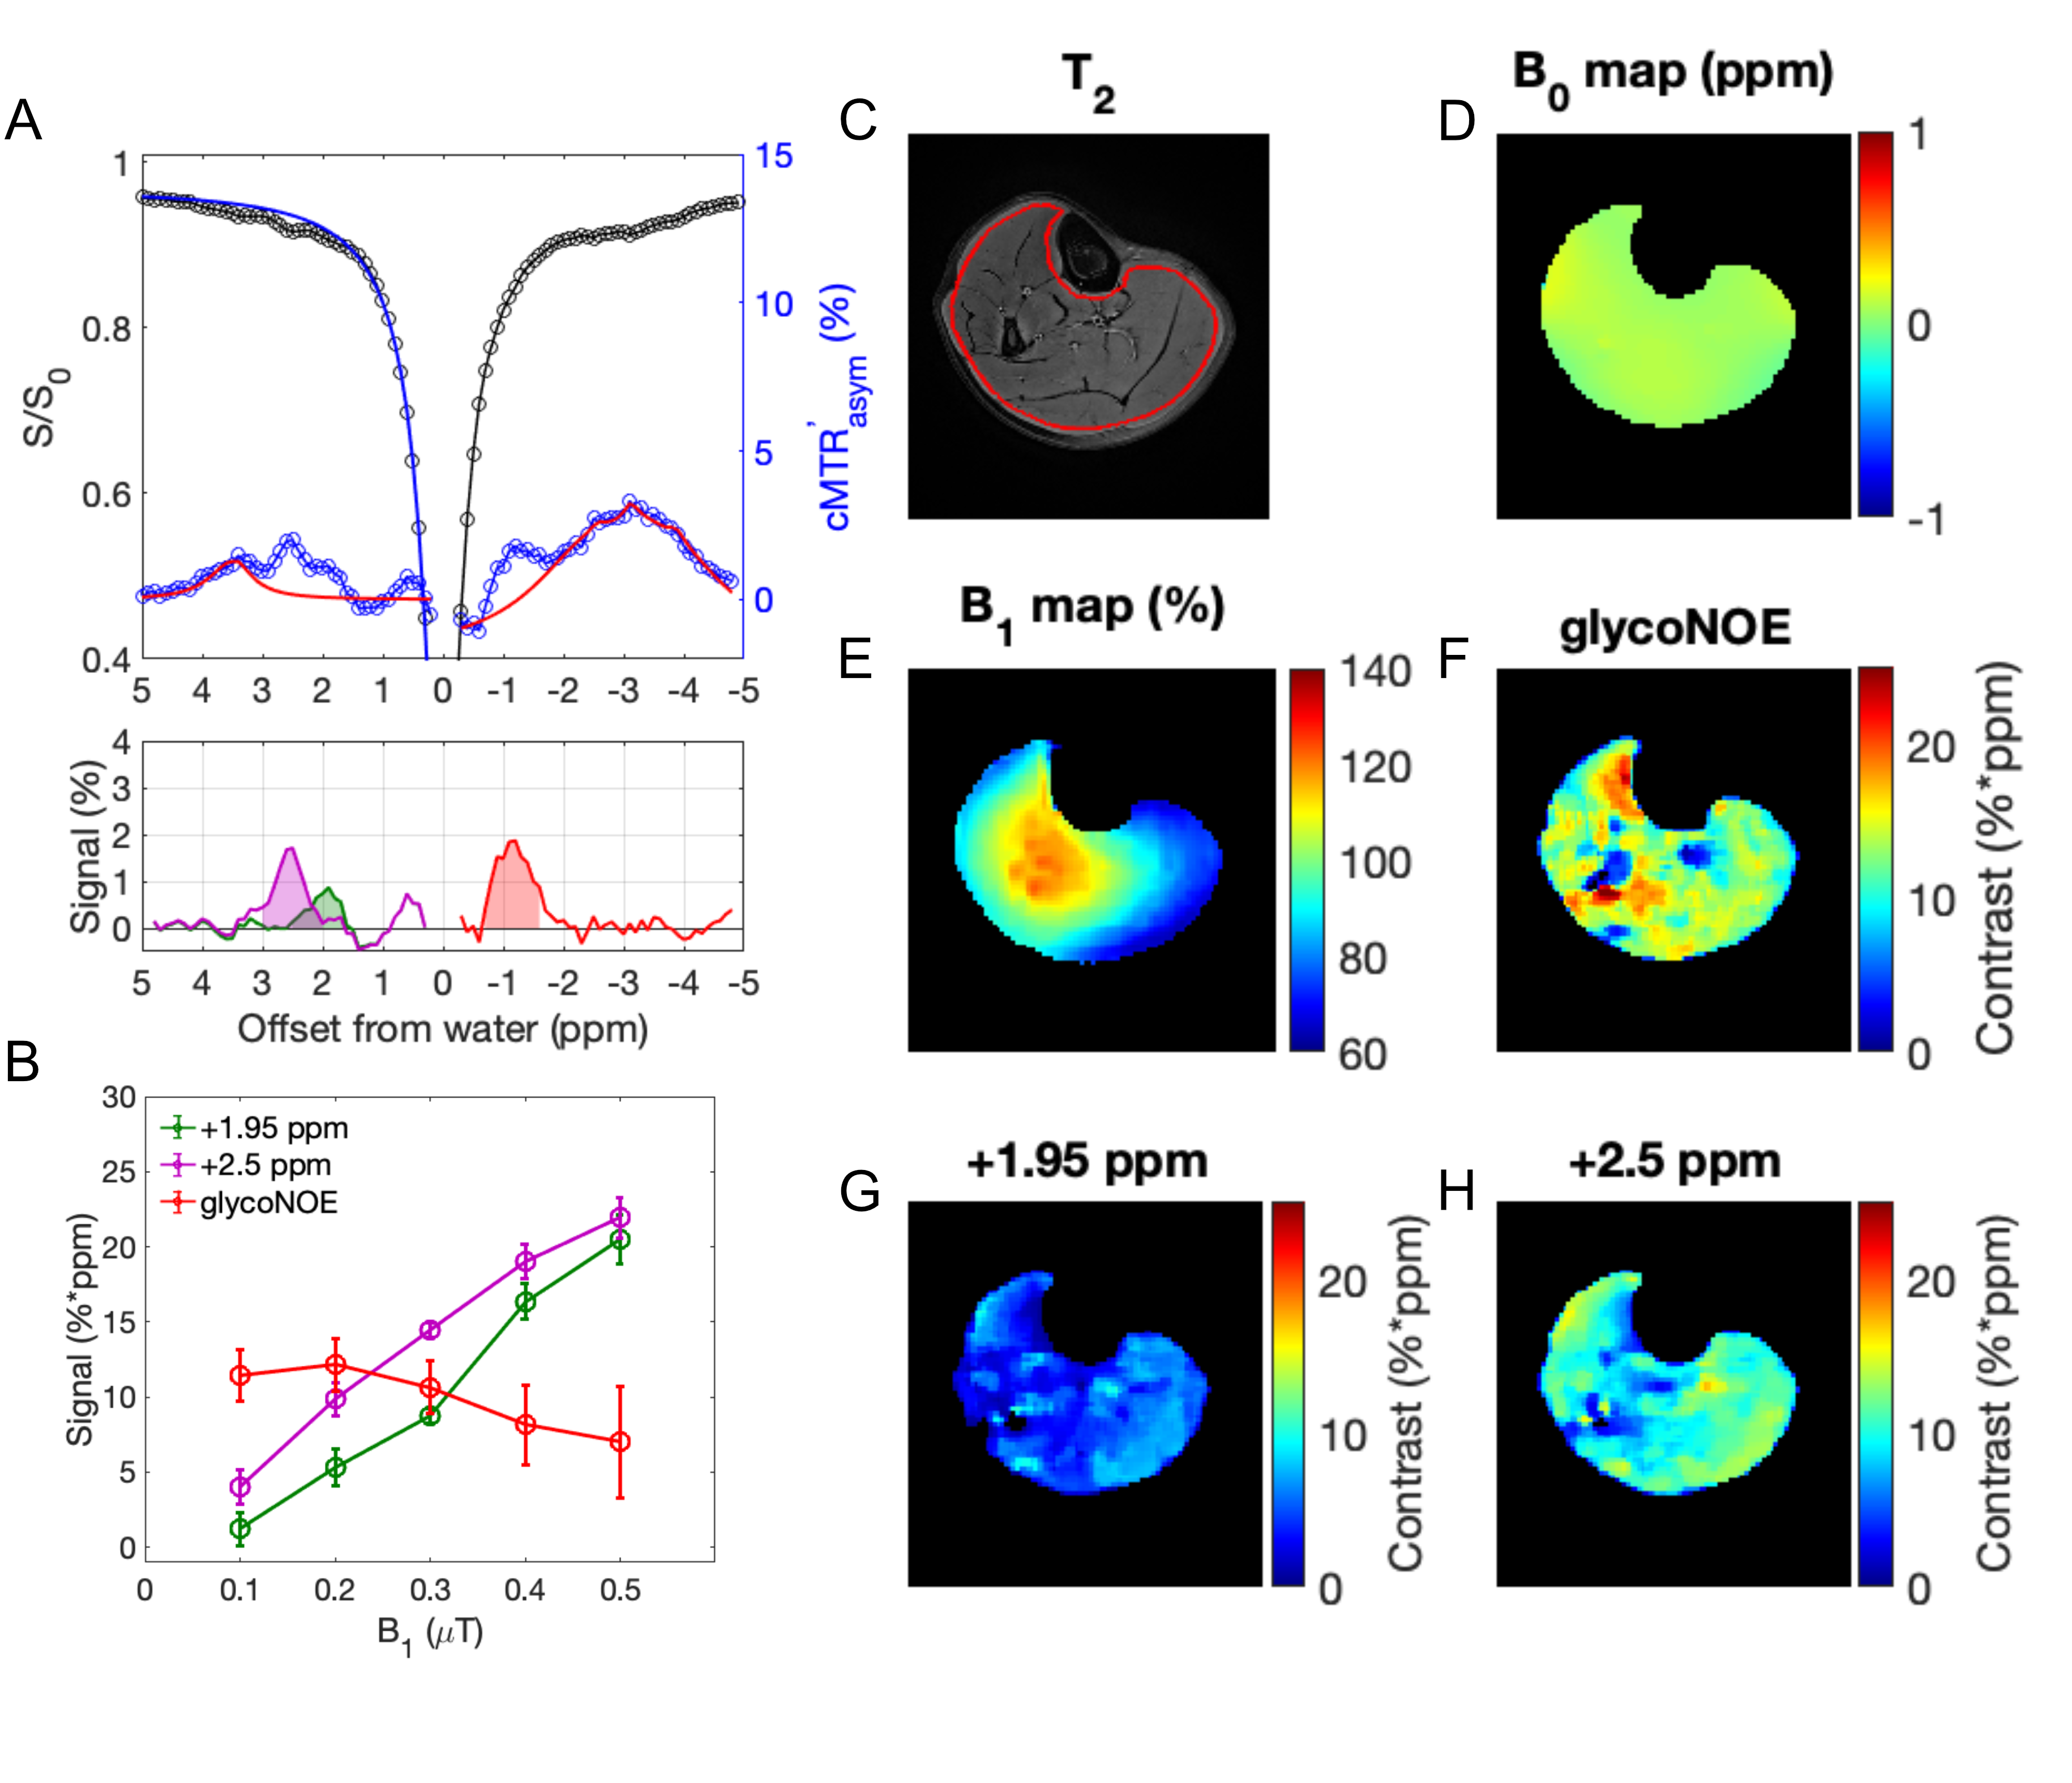
In vitro experiments (Figure 2) show that Z-spectra at low B1 can detect glycogen at -1 ppm (glycoNOE)10, and PCr at +1.95 ppm and +2.5 ppm8,15. Cr presents a broad peak in the background around +1.5 to +2.5 ppm in the Z-spectrum, due to intermediate to fast exchange.16 The -OH protons of glycogen17 are in fast exchange and may contribute to the broad background at positive offsets, but not much at B1 = 0.2 µT. The integrals of the glycoNOE and PCr peaks were linearly correlated with the molecular concentrations over the studied range. These data were used to calibrate in vivo concentrations.ST MRI experiments were performed on skeletal muscle from five volunteers (Figure 3). Within the measured B1 range, the PCr CEST peaks8,15 continued to rise with increasing B1, while the glycoNOE peaked at B1 = 0.2 µT and then decreased with increasing B1, attributed to background interference. An example of simultaneous imaging of these signals in skeletal muscle under B1 = 0.2 mT is shown in Figures 3F-H, presenting relatively homogeneous distributions. The averaged signals (B1 = 0.2 µT) of five subjects for glycoNOE, +1.95, and +2.5 ppm peaks were 12 ± 2 %*ppm, 5 ± 1 %*ppm, and 10 ± 1 %*ppm, respectively. Using the in vitro calibrations, this corresponds to 71 ± 10 mM glycogen, 41 ± 6 mM PCr, respectively.
Discussion
We demonstrated the simultaneous imaging of glycogen and PCr in human skeletal muscle. Using the in vitro data as calibration, the glycogen and PCr concentrations in skeletal muscle measured were 71 ± 10 mM and 41 ± 6 mM, respectively. These values are in good agreement with previously reported human muscle glycogen concentrations of 60 to 110 mM from 13C MRS 1,18-20 and biopsy4, and PCr concentrations of 27 to 40 mM from 31P MRS6 and biopsy6.We estimate that the glycoNOE approach is at least ten thousand times more sensitive than the traditional nature abundance 13C MRS in probing the total glycogen pool in human. Only 1.1% (nature abundance) of glycogen C1 (single position) is detectable in 13C MRS, while 100% of four aliphatic protons (H3, H5, H2+H4-1) are detected with the enhancement of two orders of magnitude relative to proton MRS.10 Detecting a 1H also gives a four times sensitivity gain over a 13C detection (considering their gyromagnetic ratios).Acknowledgements
This research was supported by National Natural Science Foundation of China (82171904), Key Laboratory for Magnetic Resonance and Multimodality Imaging of Guangdong Province (2020B1212060051), and Key Technology and Equipment R&D Program of Major Science and Technology Infrastructure of Shenzhen ( 202100102 and 202100104).References
1. Price TB, Rothman DL, Taylor R, Avison MJ, Shulman GI, Shulman RG. Human muscle glycogen resynthesis after exercise: insulin-dependent and -independent phases. J Appl Phycol. 1994;76:104-111.
2. Rothman DL, Magnusson I, Katz LD, Shulman RG, Shulman GI. Quantitation of hepatic glycogenolysis and gluconeogenesis in fasting humans with 13C NMR. Science. 1991;254:573-576.
3. Price TB, Rothman DL, Avison MJ, Buonamico P, Shulman RG. 13C-NMR measurements of muscle glycogen during low-intensity exercise. J Appl Phycol. 1991;70:1836-1844.
4. Arnold DL, Matthews PM, Radda GK. metabolic recovery after exercise and the assessment of mitochondrial function in Vivo in human skeletal muscle by means of 31P NMR. Magn Reson Med. 1984;1:307-315.
5. Kemp GJ, Radda GK. Quantitative interpretation of bioenergetic data from 31P and 1H magnetic resonance spectroscopic studies of skeletal muscle: an analytical review. Magn Reson Q. 1994;10:43-63.
6. Kemp GJ, Meyerspeer M, Moser E. Absolute quantification of phosphorus metabolite concentrations in human muscle in vivo by 31P MRS: a quantitative review. NMR Biomed. 2007;20:555-565.
7. Kogan F, Haris M, Singh A, et al. Method for high-resolution imaging of creatine in vivo using chemical exchange saturation transfer. Magn Reson Med. 2014;71:164-172.
8. Chen L, Schär M, Chan KWY, et al. In vivo imaging of phosphocreatine with artificial neural networks. Nat Commun. 2020;11:1072.
9. Zhou Y, van Zijl PCM, Xu J, Yadav NN. Mechanism and quantitative assessment of saturation transfer for water-based detection of the aliphatic protons in carbohydrate polymers. Magn Reson Med. 2021;85:1643-1654.
10. Zhou Y, van Zijl PCM, Xu X, et al. Magnetic resonance imaging of glycogen using its magnetic coupling with water. Proc Natl Acad Sci USA. 2020;117:3144-3149.
11. Nehrke K, Börnert P. DREAM—a novel approach for robust, ultrafast, multislice B1 mapping. Magn Reson Med. 2012;68:1517-1526.
12. Kim M, Gillen J, Landman BA, Zhou J, Van Zijl PC. Water saturation shift referencing (WASSR) for chemical exchange saturation transfer (CEST) experiments. Magn Reson Med. 2009;61:1441-1450.
13. Windschuh J, Zaiss M, Meissner J-E, et al. Correction of B1-inhomogeneities for relaxation-compensated CEST imaging at 7 T. NMR Biomed. 2015;28:529-537.
14. Zhou J, Payen JF, Wilson DA, Traystman RJ, van Zijl PC. Using the amide proton signals of intracellular proteins and peptides to detect pH effects in MRI. Nat Med. 2003;9:1085-1090.
15. Chen L, Barker PB, Weiss RG, van Zijl PCM, Xu J. Creatine and phosphocreatine mapping of mouse skeletal muscle by a polynomial and Lorentzian line-shape fitting CEST method. Magn Reson Med. 2019;81:69-78.
16. Xu J, Chung JJ, Jin T. Chemical exchange saturation transfer imaging of creatine, phosphocreatine, and protein arginine residue in tissues. NMR Biomed. 2022;n/a:e4671.
17. van Zijl PCM, Jones CK, Ren J, Malloy CR, Sherry AD. MRI detection of glycogen in vivo by using chemical exchange saturation transfer imaging (glycoCEST). Proceedings of the National Academy of Sciences. 2007;104:4359-4364.
18. Taylor R, Price TB, Rothman DL, Shulman RG, Shulman GI. Validation of 13C NMR measurement of human skeletal muscle glycogen by direct biochemical assay of needle biopsy samples. Magn Reson Med. 1992;27:13-20.
19. Goforth HW, Laurent D, Prusaczyk WK, Schneider KE, Petersen KF, Shulman GI. Effects of depletion exercise and light training on muscle glycogen supercompensation in men. Am J Physiol Endocrinol Metab. 2003;285:E1304-E1311.
20. Heinicke K, Dimitrov IE, Romain N, et al. Reproducibility and Absolute Quantification of Muscle Glycogen in Patients with Glycogen Storage Disease by 13C NMR Spectroscopy at 7 Tesla. PLOS ONE. 2014;9:e108706.
Figures