3160
Comparison of pH-weighted and conventional MRI signal in ischemic stroke1Department of Radiology, University of Pittsburgh, Pittsburgh, PA, United States, 2Department of Urology, University of Pittsburgh, Pittsburgh, PA, United States, 3Department of Neurobiology, University of Pittsburgh, Pittsburgh, PA, United States, 4Department of Neurology, University of Pittsburgh, Pittsburgh, PA, United States, 5Department of Biostatistics, University of Pittsburgh, Pittsburgh, PA, United States
Synopsis
Keywords: CEST & MT, Stroke, APT, Penumbra
The sensitivity of APT MRI in the evaluation of ischemic tissue status was evaluated in stroke rat brains and compared with conventional MRI methods. APT can detect the different levels of tissue acidosis in the ischemic core, penumbra, and oligemia regions. Additionally, APT can also differentiate the severity of tissue acidosis associated with different blood glycemic levels. Our results indicate that APT MRI is a sensitive pH-weighted imaging marker with great potential for the evaluation of the ischemic tissue status and prediction of the stroke outcome.Introduction
Amide-proton-transfer (APT), a variant of the CEST MRI technique, has been applied in many stroke studies to offer pH-weighted information complementary to conventional MRI such as diffusion, blood flow, and relaxation time mapping techniques 1-4. However, it is still unclear whether APT-MRI can differentiate between various levels of acidosis in ischemic tissue, including the ischemic core, penumbra, and oligemia regions, respectively, or very severe acidosis associated with hyperglycemia. In this work, the APT signal was measured in different regions of ischemic tissue, and compared with conventional MRI.Methods
MRI Acquisition:Rats underwent middle cerebral artery occlusion (MCAO) and were imaged at 9.4 T 5. In 11 rats, APT, ADC, CBF, and quantitative T1 and T2 maps were measured repeatedly with ~0.5 h step from 0.5-1 h to 4-5 h after the occlusion. In 7 other rats, severe acidosis was induced by injecting 1.5 g/kg of glucose 10 minutes before MCAO and APT, ADC, T1, and T2 maps were measured at ~1 h after the occlusion. APT maps were acquired using a 3-point method with 4 s of continuous wave saturation of 1 µT at 3.0, 3.6, and 4.2 ppm 5, whereas the ADC, CBF, T1, and T2 maps were obtained by conventional methods 6.
Data Analysis:
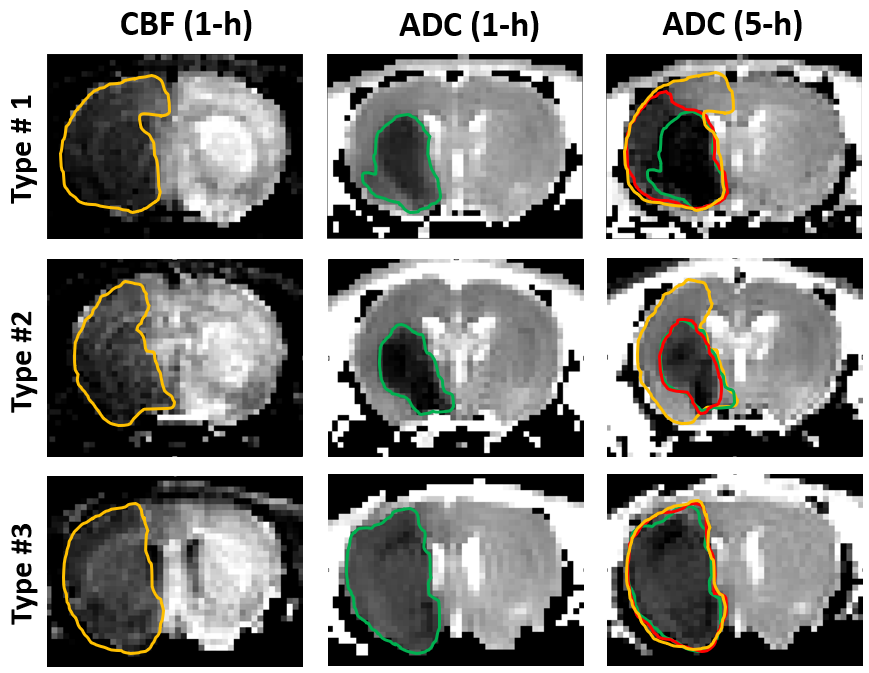
Ischemic lesions were segmented into three regions based on the tissue outcome determined by the CBF deficit at 1 h, and the ADC deficit at 1 h and 5 h. Three distinct patterns were observed from the 11 normoglycemic MCAO rats (Fig. 1): in type #1 (n=6), there are large areas of oligemia, penumbra, and core. In type #2 (n=3), there are large areas of oligemia and core, but minimal penumbra. In type #3 (n=2), both the oligemia and the penumbra are minimal, and the ischemic tissue is mostly the core. Correspondingly, the ADC, APT, T1 and T2 values were obtained from the penumbra (n=6), oligemia (n=9), and core (n=11) regions and the contralateral regions to determine their relative ratio (e.g., rADC, rAPT). Because the maps for each animal were not acquired at the same time points, the data in these ischemic regions were calculated by linear extrapolation to the time of stroke onset in 0.5-h steps. In MCAO rats with hyperglycemia, the images were only acquired at 1 h, and the data were obtained from the ADC-defined core region (n=7). For each of the four parameters (rADC, rT1, rT2, and rAPT), the differences between the overall trends for penumbra and oligemia regions were tested at two-sided significance level of 0.0125. For parameters with significantly different trends, the values at individual time points were compared using Wilcoxon exact test.
Results
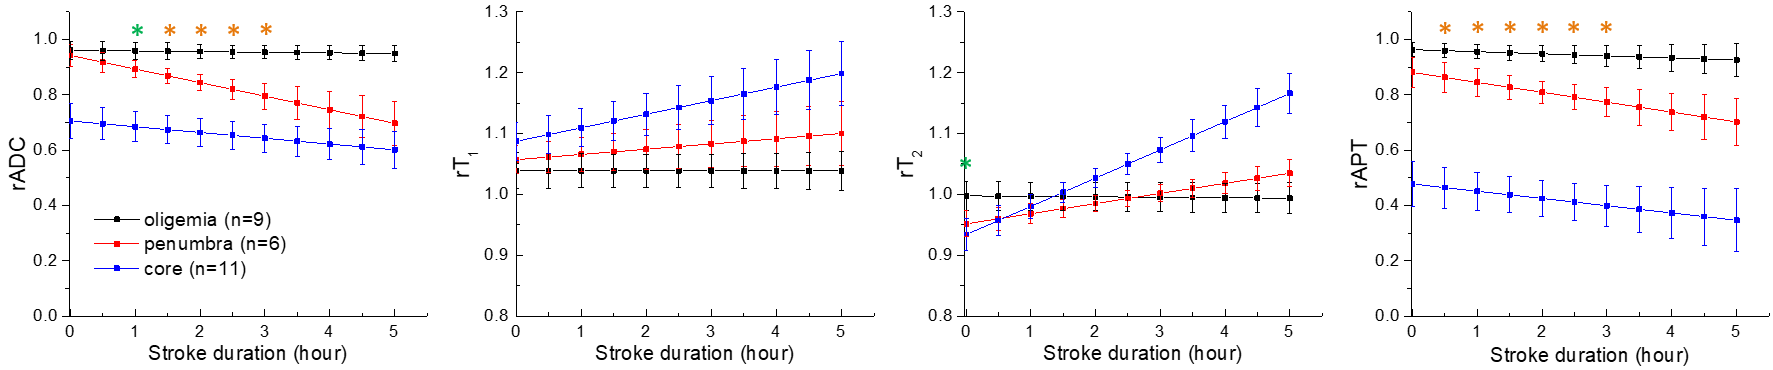
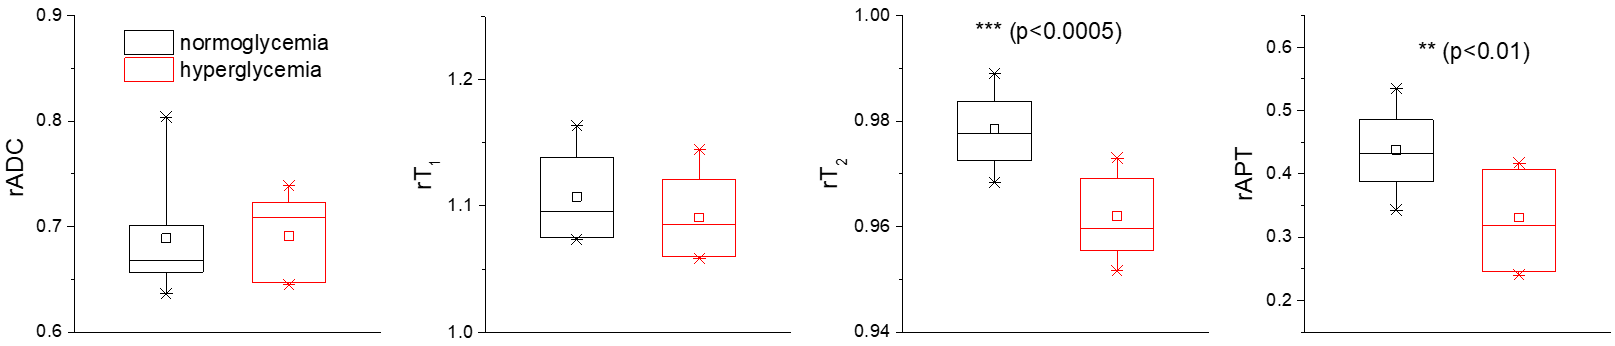
In Fig. 2A, the relative change of ADC, T1, T2, and APT were compared for the oligemia, penumbra, and core regions. Except for rT1, all parameters showed a significant difference in the time trends between the penumbra and oligemia regions (p<0.0125). In the oligemia region, at the initial time points, there is a very small decrease in ADC and APT (relative ratio <1), a small increase in T1, and a minimal change in T2, and the values are nearly independent of the stroke duration. In the core, there is a more substantial initial decrease in ADC and APT and an increase in T1, and the magnitude of changes increases with time. In contrast, rT2 decreases initially but increases gradually with time. In the penumbra, the initial change of ADC, APT, and T1 is more substantial than that of oligemia but weaker than the core with a time-trend in the same direction as for the core. The rT2 value of the penumbra is similar to that of the core initially and increases with a smaller slope than the core. The relative indices were compared between oligemia and penumbra for time points ≤ 3-h post occlusion in the acute phase. For rADC, significant differences were present starting with 1-h. For rT2, the initial significant difference disappears within the first hour. For rAPT, the differences are significant starting from 0.5-h, whereas for rT1 there were no time points with significant differences. Fig. 3 compares the relative changes of 4 indices at 1 h in the core for normoglycemic and hyperglycemic rats. The hyperglycemic group showed significantly smaller rT2 and rAPT, but not rADC and rT1. This is reasonable because both APT and T2 are sensitive to chemical exchange and thus are affected by tissue acidosis.Discussions
Among the ischemic tissues, the penumbra is an important therapeutic target, but it is difficult to differentiate from oligemia using conventional MRI. Our results showed that rAPT in penumbra and oligemia are significantly different for more time points than conventional indices. APT can also differentiate the severity of acidosis in the normoglycemic ischemic core from that of hyperglycemic MCAO which is known to be strongly correlated with worse tissue outcome 7.Conclusion
Our results indicate that APT MRI is a sensitive pH-weighted imaging marker that can differentiate between various levels of tissue acidosis in the ischemic core, penumbra, and oligemia, as well as stroke in hyperglycemic conditions. APT MRI can more precisely delineate different zones of hypo-perfused and ischemic tissue, and better predict stroke outcomes.Acknowledgements
This work is supported by NIH grant NS100703.References
1. Sun PZ, Zhou JY, Sun WY, Huang J, van Zijl PCM. Detection of the ischemic penumbra using pH-weighted MRI. J Cereb Blood Flow Metab. 2007;27(6):1129-1136.
2. Guo Y, Zhou IY, Chan S-T, et al. pH-sensitive MRI demarcates graded tissue acidification during acute stroke ― pH specificity enhancement with magnetization transfer and relaxation-normalized amide proton transfer (APT) MRI. Neuroimage. 2016;141:242-249.
3. Tietze A, Blicher J, Mikkelsen IK, et al. Assessment of ischemic penumbra in patients with hyperacute stroke using amide proton transfer (APT) chemical exchange saturation transfer (CEST) MRI. NMR Biomed. 2014;27(2):163-174.
4. Lin GS, Zhuang CY, Shen ZW, et al. APT Weighted MRI as an Effective Imaging Protocol to Predict Clinical Outcome After Acute Ischemic Stroke. Front Neurol. 2018;9.
5. Jin T, Wang P, Zong X, Kim SG. MR imaging of the amide-proton transfer effect and the pH-insensitive nuclear overhauser effect at 9.4 T. Magn Reson Med. 2013;69(3):760-770.
6. Zong X, Wang P, Kim S-G, Jin T. Sensitivity and Source of Amine-Proton Exchange and Amide-Proton Transfer Magnetic Resonance Imaging in Cerebral Ischemia. Magn Reson Med. 2014;71(1):118-132.
7. Parsons MW, Barber PA, Desmond PM, et al. Acute Hyperglycemia Adversely Affects Stroke Outcome: A Magnetic Resonance Imaging and Spectroscopy Study. Ann Neurol. 2002;52:20-28.
Figures