3159
Development of in vivo quantitative gluCEST fitting using quantitative 1H-MRS as a reference in the mouse brain1Université Paris-Saclay, CEA, CNRS, MIRCen, Laboratoire des Maladies Neurodégénératives, Fontenay-aux-roses, France
Synopsis
Keywords: CEST & MT, Modelling, Quantitative imaging
In this work, we propose to quantify glutamate with CEST imaging. We use quantitative magnetic resonance spectroscopy as a standard method to measure glutamate concentration in the mouse striatum, and build a CEST model optimized for high saturation power to properly fit glutamate concentration. The CEST estimator developed in this way allowed us to recover glutamate concentration with an average error of 0.7 mM.Introduction
Glutamate (Glu) is one of the major neurotransmitters in the brain, and alterations of Glu levels have been reported in many neurodegenerative diseases1–3. In most studies, CEST (Chemical Exchange Saturation Transfer) imaging of Glu is often used as a Glu-weighted imaging method to detect such alterations4,5. It offers very good spatial resolution, but lacks specificity, as the CEST contrast is a mix of contributions from multiple metabolites and can be impacted by physiological environment. To overcome this, quantitative CEST (qCEST) has been a promising emerging field, relying on Bloch-McConnell modeling6,7. However, while qCEST seems to perform well in vitro, in vivo qCEST studies often miss a quantitative control to assess its accuracy. Furthermore, many CEST modeling parameters, like exchange rates, remain unknown in vivo, making it difficult to reach proper qCEST estimations. In this work, we propose to use another quantitative modality, quantitative magnetic resonance spectroscopy (qMRS), to serve as a calibration in order to refine modeling for qCEST optimized for Glu.Methods
Four mice anesthetized with ~1-1.5% isofluorane were scanned in an 11.7 T Bruker scanner equipped with a cryoprobe. Acquisitions were performed in a 12.8 µL voxel of interest (VOI) centered in the striatum (Fig1.a) following first the MRS protocol, and then the gluCEST protocol. Glutamate T2 estimation and macromolecule (MM) acquisitions (using a double inversion-recovery module) were performed in preliminary experiments on the same animals.MRS measurements
Localized 1H-MR spectra were acquired with a LASER sequence8 (TE=20 ms, TR=6000 ms, 32 averages), combined with a VAPOR water suppression9 for the metabolite acquisition. Water and experimental macromolecule spectra were acquired in the same VOI (Fig2.a). To estimate Glu T2, 7 spectra were acquired at TE=[20,25,35,80,95,110,145] ms and analyzed with LCModel10, with specific MM basis-set included for each TE.
GluCEST measurements
A LASER-CEST sequence was used to acquire water signal in the same VOI as the MRS protocol. We used a saturation module of duration 10x100 ms, for 51 offsets from -5 ppm to +5 ppm. Z-spectra were acquired for different saturation power B1=[1,5,7] µT and normalized with a -20 ppm measurement.
Quantification of data
Simultaneous fit of MRS metabolite and water spectra with LCModel gave us Glu concentration relative to water10. Usual water concentrations in the brain (white matter (WM): 35.88 M, gray matter (GM): 43.3 M, CSF: 55.56 M) were used to obtain absolute concentration values. T2 and partial volume correction using WM/GM/CSF voxel segmentation (Fig1.b and c) were also included to estimate [Glu].
CEST Z-spectra were fitted by analytical Bloch-McConnell simulations8. CEST modeling included a superlorentzian description of MT pool, as well as NOE and APT/Creatine/Glutamate proton exchanging pools which were estimated from simulations to have significant impact on CEST signal (see Fig3.a). Fig 3.b indicate variable and fixed parameters used for the fit, with starting values inspired by literature11–14.
Results
1H-qMRS resultsLCModel provided a good fit of Glu (Cramèr-Rao lower-bound<2% for TE=20 ms, <5% for higher TE values). We found Glu T2=108±10 ms and water T2=29.7±0.2 ms in striatum (Fig2.b), which allowed inferring of a scaling factor for [Glu] estimation at TE=20 ms:
$$f_s=\frac{ATTH2O}{ATTGlu}=\frac{exp(-\frac{TE}{T2H2O})}{exp(-\frac{TE}{T2Glu})}=0.6229$$
On average, absolute [Glu] in the striatum was estimated to 5.8±0.4 mM (Fig2.c), which is lower compared to other studies15–17 but can be explained by the old age of the scanned mice18 (14 months).
q-gluCEST results
We first attempted to fit the CEST parameters of slow-exchanging protons (APT, creatine and NOE) at low-saturation power (B1=1 µT, Fig4.a, blue curve), obtaining results in agreement with literature11,13,14 (Fig4.b). Elevated [Cr] derived from the fit suggests that creatine might not be the only CEST contribution at 2 ppm19,20. Using these values, we then proceeded to fit glutamate parameters with a Z-spectrum at a higher saturation power (B1=5 µT, Fig4.a, orange curve), where Glu contribution is higher than other pools at 3 ppm (Fig3.a). We found very high Glu concentrations with large variability (Fig4.c): this showed that parameters derived from classical low-saturation CEST modeling might not be suitable for high-saturation q-gluCEST.
We thus instead developed a CEST model specific to glutamate, at high saturation power (5/7 µT). We simultaneously fitted both Z-spectra while constraining Glu concentration thanks to qMRS results. This allowed us to estimate exchange rates suitable for a quantitative Glu estimator, in particular Glu kex=2625±212 Hz (Fig5.a). Such kex is low compared to in vitro litterature11,12,21, but could indicate that in vivo glutamic proton exchanges are slower due to some inhibitor agents12. High amide concentrations found could also indicate the existence of a fast exchanging pool with significant impact on CEST signal at high-saturation22.
Then, exchange rates determined previously were fixed in the model and Z-spectra were fitted to determine Glu concentration. We were able to recover proper [Glu] with an average error of 0.7 mM (Fig5.b).
Conclusion
In order to overcome the weaknesses of conventional CEST modeling for Glu quantification, we successfully developed a high-B1 fitting model built with internal reference of [Glu] measured with qMRS. While this study needs to be carried on in other brain tissues (white matter), this sets the basis for quantitative gluCEST and opens the possibility of mapping glutamate concentrations in the brain with good accuracy.Acknowledgements
11.7 T scanner was funded by NeurATRIS (“Investissements d'Avenir”, ANR-11-INBS-0011).References
1. Pépin, J. et al. In vivo imaging of brain glutamate defects in a knock-in mouse model of Huntington’s disease. NeuroImage 139, 53–64 (2016).
2. Chassain, C. et al. Glutamate cycle changes in the putamen of patients with de novo Parkinson’s disease using 1H MRS. Parkinsonism Relat. Disord. 99, 65–72 (2022).
3. Fayed, N., Modrego, P. J., Rojas-Salinas, G. & Aguilar, K. Brain glutamate levels are decreased in Alzheimer’s disease: a magnetic resonance spectroscopy study. Am. J. Alzheimers Dis. Other Demen. 26, 450–456 (2011).
4. Pépin, J. et al. Complementarity of gluCEST and 1H-MRS for the study of mouse models of Huntington’s disease. NMR Biomed. 33, e4301 (2020).
5. Haris, M. et al. Imaging of glutamate neurotransmitter alterations in Alzheimer’s disease. NMR Biomed. 26, 386–391 (2013).
6. Kim, J., Wu, Y., Guo, Y., Zheng, H. & Sun, P. Z. A review of optimization and quantification techniques for chemical exchange saturation transfer MRI toward sensitive in vivo imaging: OPTIMIZATION AND QUANTIFICATION OF CEST MRI. Contrast Media Mol. Imaging 10, 163–178 (2015).
7. Zaiss, M. et al. QUESP and QUEST revisited - fast and accurate quantitative CEST experiments. Magn. Reson. Med. 79, 1708–1721 (2018).
8. Garwood, M. & DelaBarre, L. The Return of the Frequency Sweep: Designing Adiabatic Pulses for Contemporary NMR. J. Magn. Reson. 153, 155–177 (2001).
9. Tkáč, I., Starčuk, Z., Choi, I.-Y. & Gruetter, R. In vivo 1H NMR spectroscopy of rat brain at 1 ms echo time. Magn. Reson. Med. 41, 649–656 (1999).
10. Provencher, S. W. Automatic quantitation of localized in vivo 1H spectra with LCModel. NMR Biomed. 14, 260–264 (2001).
11. Khlebnikov, V., van der Kemp, W. J. M., Hoogduin, H., Klomp, D. W. J. & Prompers, J. J. Analysis of chemical exchange saturation transfer contributions from brain metabolites to the Z-spectra at various field strengths and pH. Sci. Rep. 9, 1089 (2019).
12. Wermter, F. C., Bock, C. & Dreher, W. Investigating GluCEST and its specificity for pH mapping at low temperatures. NMR Biomed. 28, 1507–1517 (2015).
13. Zhang, X.-Y. et al. Accuracy in the quantification of chemical exchange saturation transfer (CEST) and relayed nuclear Overhauser enhancement (rNOE) saturation transfer effects. NMR Biomed. 30, (2017).
14. Heo, H.-Y. et al. Quantifying Amide Proton Exchange rate and Concentration in Chemical Exchange Saturation Transfer Imaging of the Human Brain. NeuroImage 189, 202–213 (2019).
15. Chassain, C. et al. Metabolic changes detected by proton magnetic resonance spectroscopy in vivo and in vitro in a murin model of Parkinson’s disease, the MPTP-intoxicated mouse. J. Neurochem. 105, 874–882 (2008).
16. Choi, C. et al. T2 measurement and quantification of glutamate in human brain in vivo. Magn. Reson. Med. 56, 971–977 (2006).
17. Govindaraju, V., Young, K. & Maudsley, A. A. Proton NMR chemical shifts and coupling constants for brain metabolites. NMR Biomed. 13, 129–153 (2000).
18. Kaiser, L. G., Schuff, N., Cashdollar, N. & Weiner, M. W. Age-related glutamate and glutamine concentration changes in normal human brain: 1H MR spectroscopy study at 4 T. Neurobiol. Aging 26, 665–672 (2005).
19. Chen, L. et al. Investigation of the contribution of total creatine to the CEST Z-spectrum of brain using a knockout mouse model. NMR Biomed. 30, e3834 (2017).
20. Cai, K. et al. CEST signal at 2 ppm (CEST@2ppm) from Z-spectral fitting correlates with creatine distribution in brain tumor. NMR Biomed. 28, 1–8 (2015).
21. Cai, K. et al. Magnetic Resonance Imaging of Glutamate. Nat. Med. 18, 302–306 (2012).
22. Cui, J. & Zu, Z. Towards the molecular origin of glutamate CEST (GluCEST) imaging in rat brain. Magn. Reson. Med. 83, 1405–1417 (2020).
Figures
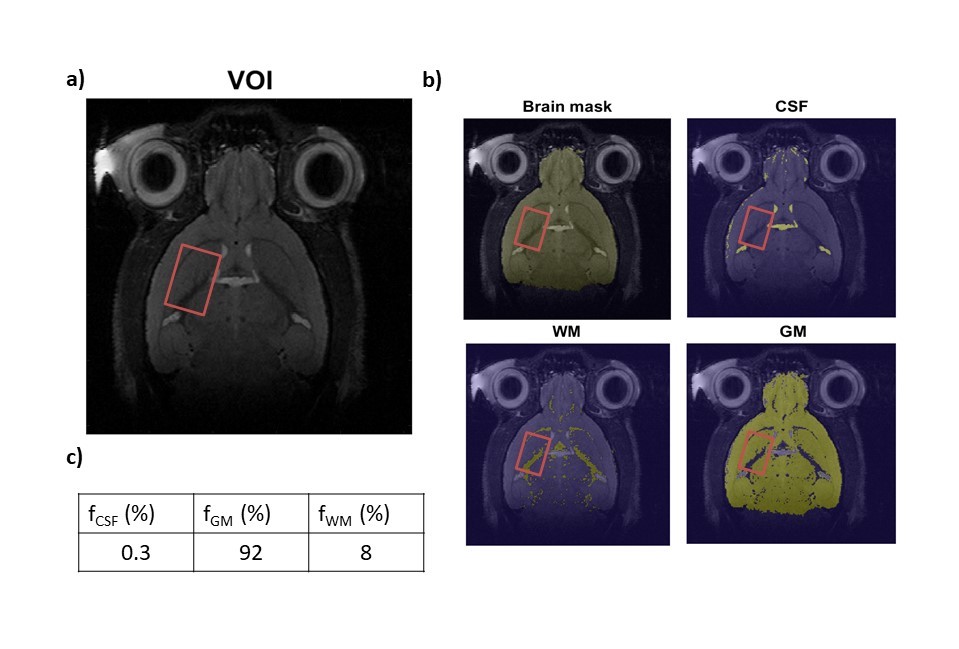
Figure 1
a) LASER voxel of interest in mouse's striatum. Voxel was 3.2x2x2 mm3 in size. b) Typical voxel segmentation using thresholding method. c) Typical fractions of brain tissues in voxel of interest.
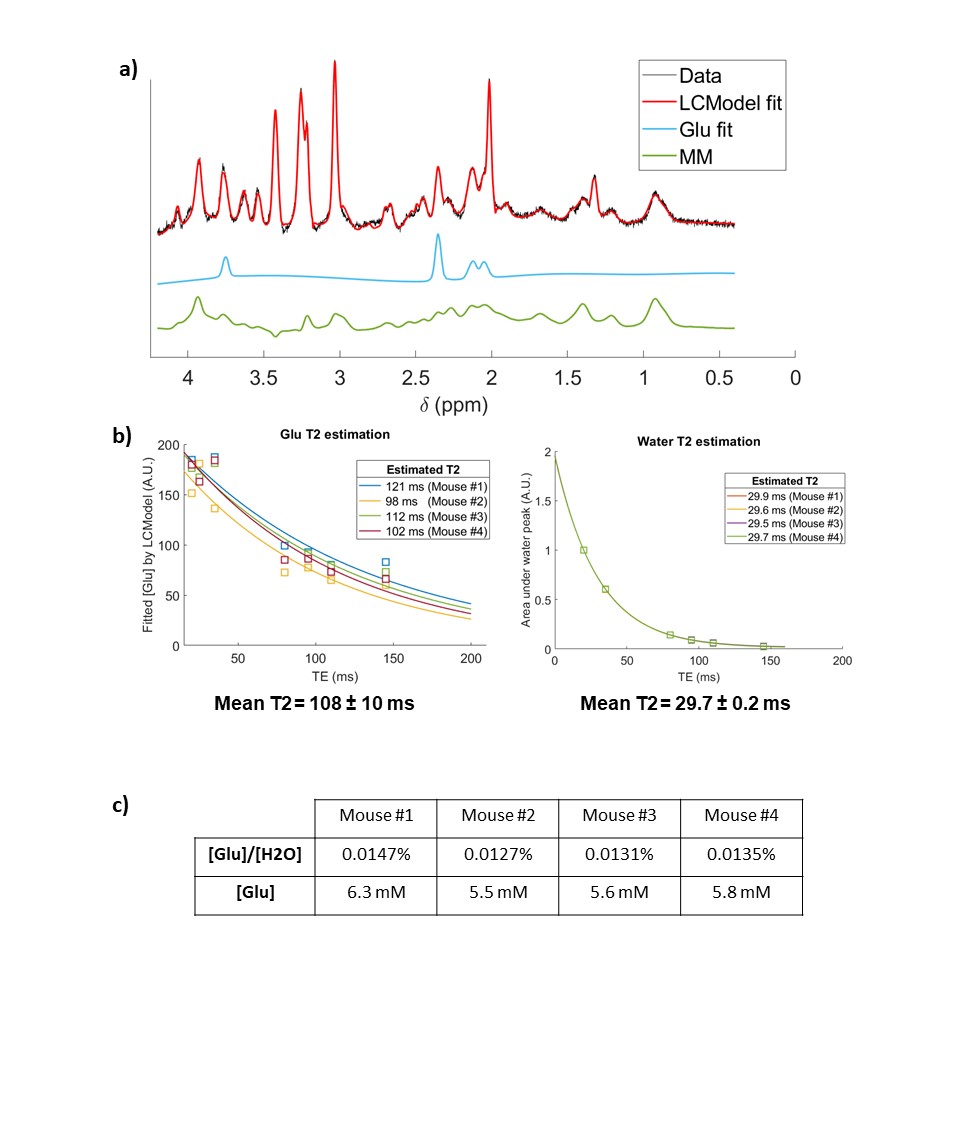
Figure 2 - qMRS results.
a) Spectra obtained at TE = 20 ms, with LCModel fit and MM basis used. b) Glu T2 fitting. On average, T2Glu = 108 ± 10 ms. c) Water T2 fitting. On average, T2H2O = 29.7 ± 0.2 ms. d) Quantitative estimations of Glu concentration by qMRS in the 4 mice.
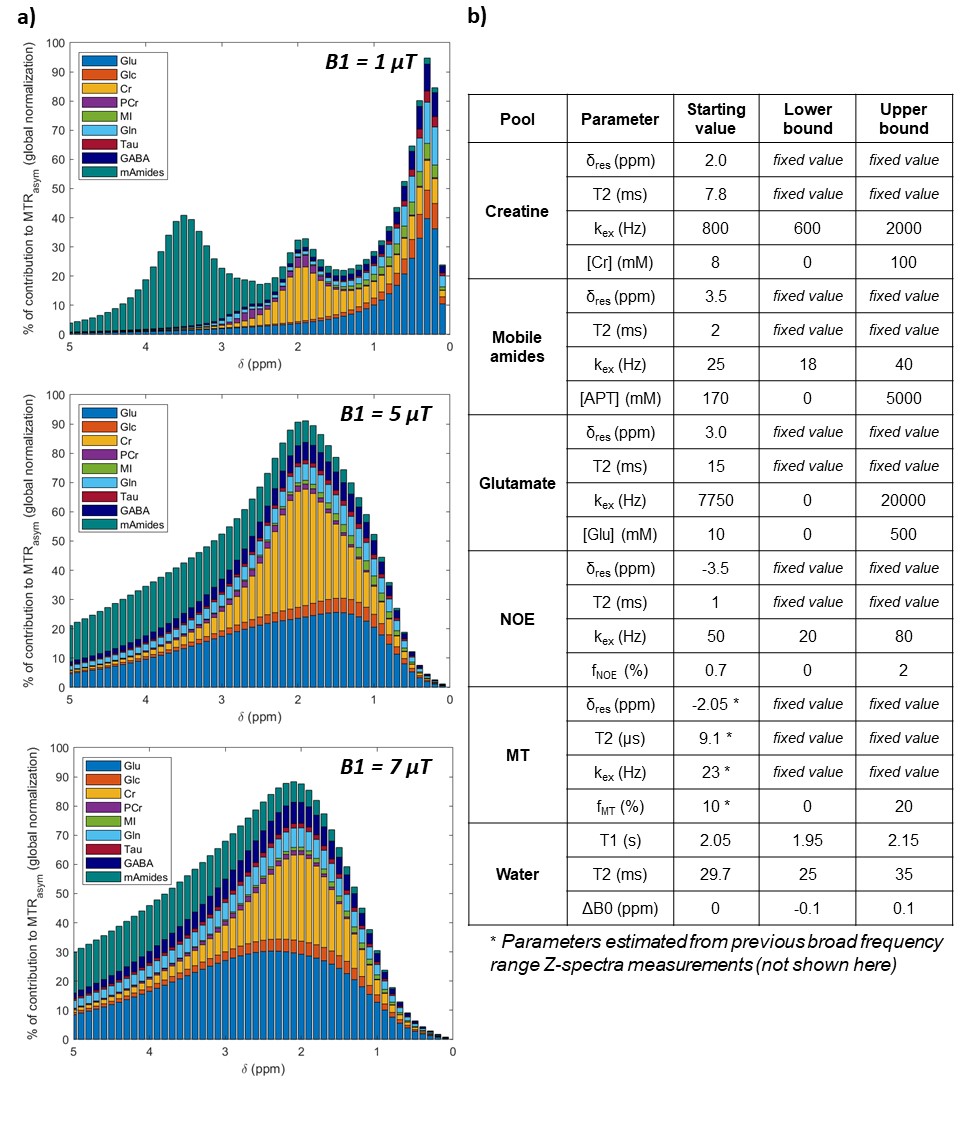
Figure 3 - CEST modeling used for data fitting.
a) Simulations of metabolite contributions to CEST signal at different saturation power (we used method and concentration values presented in 8). b) CEST model parameters values used for data fitting. Z-spectrum fitting was performed with a least square curve fitting algorithm, by proposing a starting value and imposing lower and upper bounds.
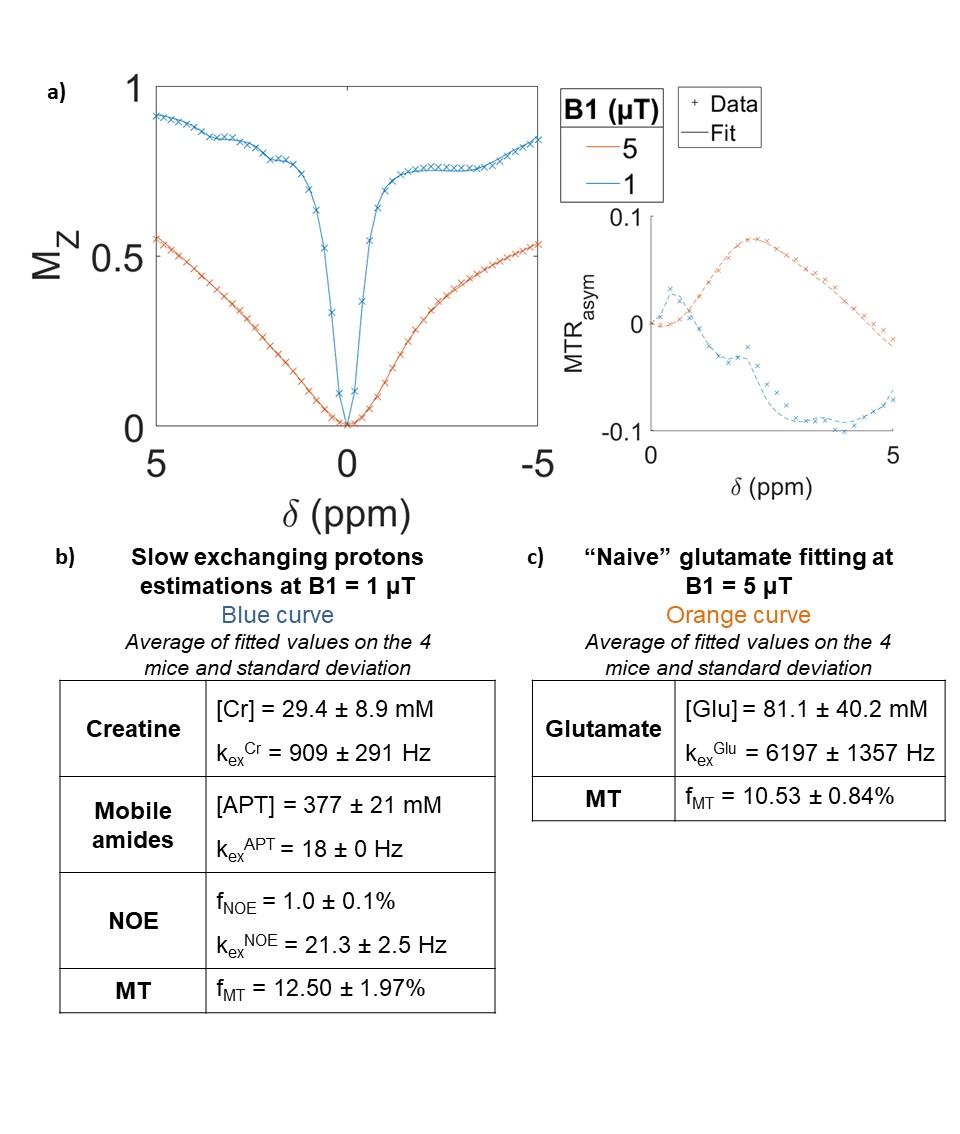
Figure 4 - Conventional CEST modeling.
a) Z-spectra acquired at B1 = 1 or 5 µT and their respective fits. b) Slow-exchanging proton parameters were estimated by fitting the B1 = 1 µT Z-spectrum. Glu concentration and exchange rate were left free during this fit, but their estimations were considered irrelevant since we are not sensitive to Glu at B1 = 1 µT. c) Fit of the B1 = 5 µT Z-spectrum using the metabolite parameters values found in a), but leaving Glu and MT free. MT modeling was done separately for each Z-spectra to improve fitting performance.
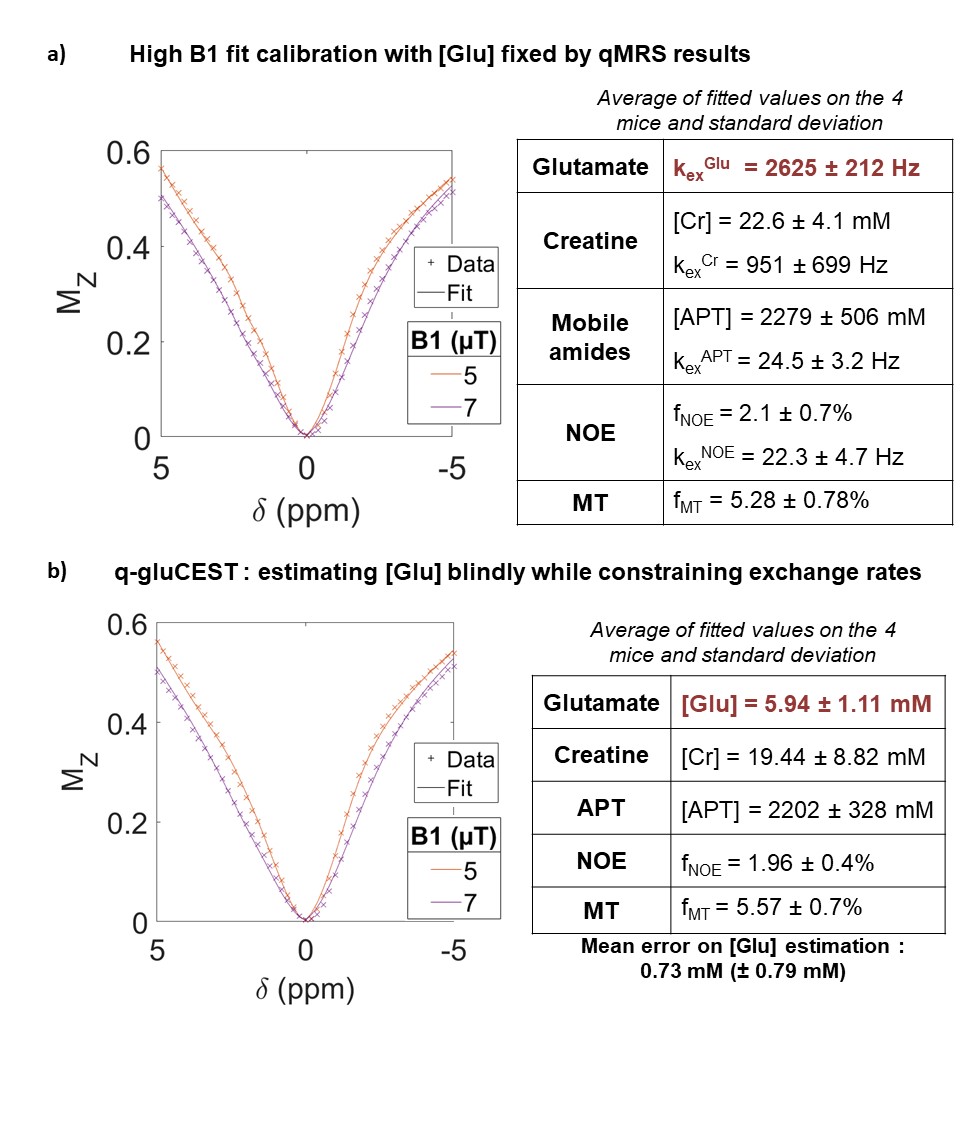
Figure 5 - Building a quantitative gluCEST model
a) CEST modeling at high saturation power, constraining [Glu] value using qMRS results. Both Z-spectra were fitted simultaneously, imposing identical concentrations and exchange rates estimations. b) Glutamate concentration estimationsby simultaneously fitting both Z-spectra but constraining fit with exchange rates found in a).