3157
Optimization of Saturation Power for pH-enhanced MRI in Stroke Rodents1Radiology, University of Pittsburgh, Pittsburgh, PA, United States
Synopsis
Keywords: CEST & MT, CEST & MT
The sensitivity of CEST to pH makes it a potential modality for the assessment of intracellular pH alterations under pathologic conditions. We previously introduced a method for pH-enhanced MRI using amide and guanidyl protons. In this study, we determine saturation powers for imaging both exchangeable protons to optimize either contrast or contrast-to-variation ratio (CVR) between healthy and infarcted tissue in stroke rats. The contrast across parameters remained steady at ~2-3%, while CVR was dominated by variation across ROIs due to residual non-specific contrast. Optimizing CVR minimizes contrast within the lesion and contralesional tissue while preserving contrast between the two tissues.Introduction
The sensitivity of CEST to pH makes it a potential modality for the assessment of intracellular pH alterations under pathologic conditions1-5. Our group has previously introduced a method for pH-enhanced MRI6 (pHenh MRI) which capitalized off of the ubiquity of peptide bonds bearing amide protons and amino acid side chains containing guanidyl protons in the brain to enhance the pH sensitivity of CEST imaging. However, since amide protons and guanidyl protons bear disparate exchange rates, optimal saturation power for these two labile proton species is also different. In this study, we seek to determine saturation powers for imaging both of these exchangeable protons to optimize either the contrast or contrast-to-variation ratio (CVR) between healthy and infarcted tissue in stroke rats in order to optimize pH-enhanced MRI.Methods
Imaging of MCAO rats (n=5) was performed 3-4 hours post-operation using 4-s Continuous Wave (CW) saturation preparation with B1=0.50, 0.60, 0.70, and 0.80 μT at 2.0 ppm, B1=0.60, 0.70, 0.80, 0.90, 1.00, 1.10, 1.25, and 1.40 μT at 3.6 ppm, and a 300 ppm image (B1=1.00 μT) along with ADC maps. Two MCAO rodents were imaged <1 hour post-operation with saturation at B1=0.70 μT at 2.0 ppm, B1=0.80 μT at 3.6 ppm, and a 300 ppm image (B1=0.80 μT) as well as ADC and CBF maps. Two slice spin-echo EPI was read out: matrix size= 80×80, a field of view= 32×32 mm, slice thickness= 2 mm, TR= 8 s, and TE= 20 ms. ROIs were drawn on ADC maps in the lesion and then reflected over the center of the brain to obtain an ROI over which the contralesional signal would be averaged over. CEST signals for pH weighting were calculated as follows: pHenh= (S3.6ppm[B1,3.6ppm]-S2.0ppm[B1,2.0ppm])/S06. The contrast was calculated by subtracting the pHenh averaged over the contralesional ROI from the average over the lesion while spatial variation was calculated by the standard deviation of pHenh over the contralesional ROI with CVR being the ratio between this contrast and variation value.Results
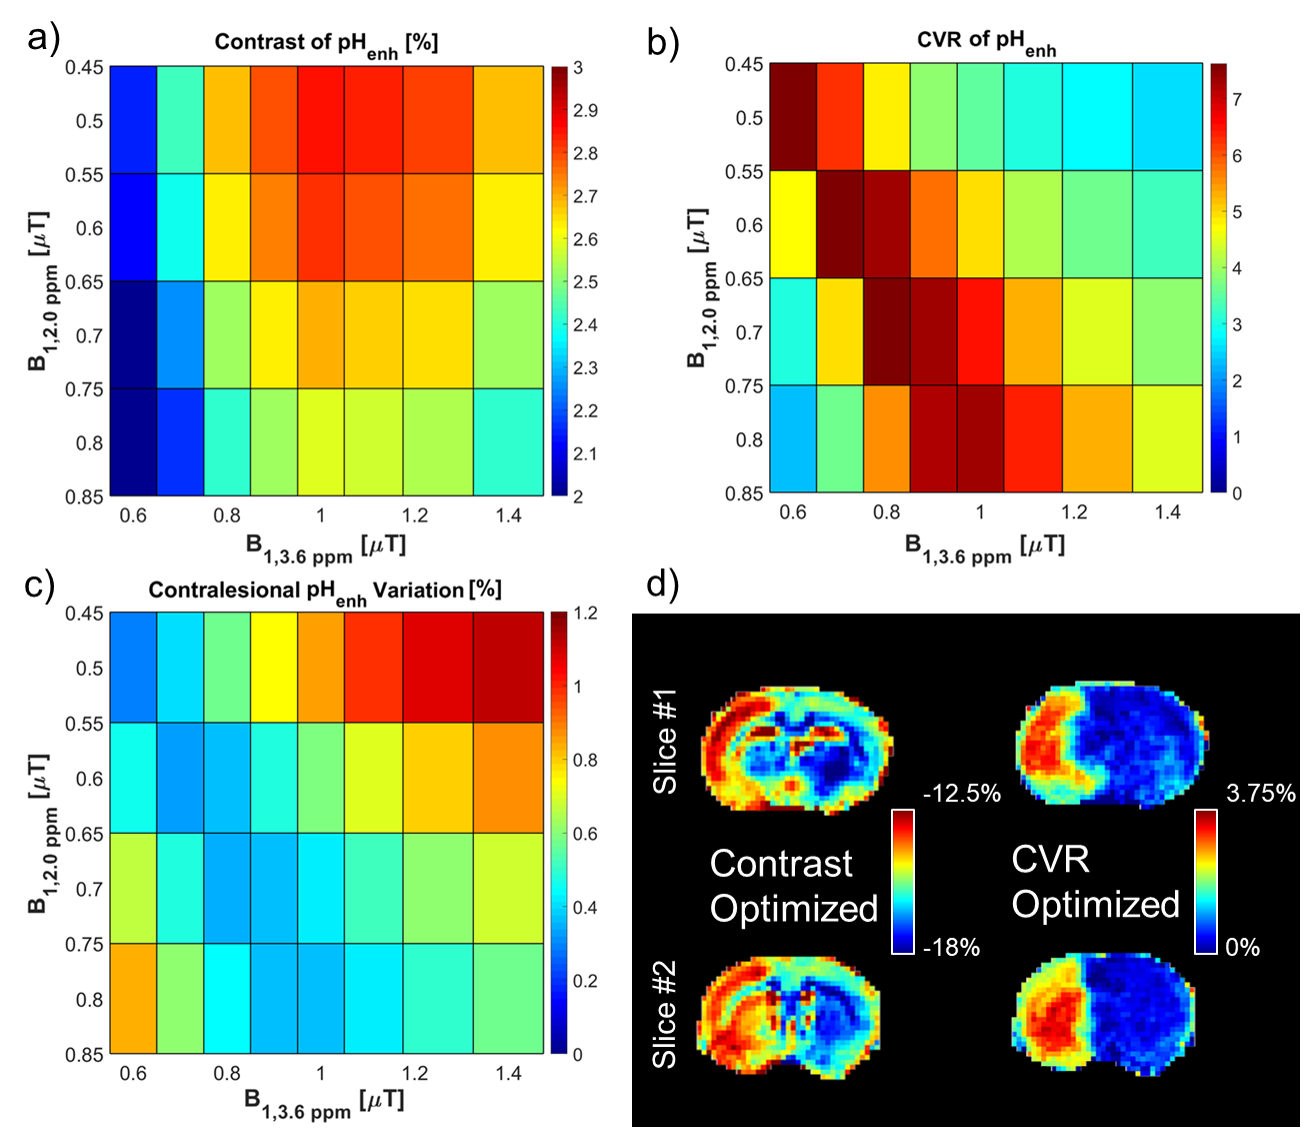
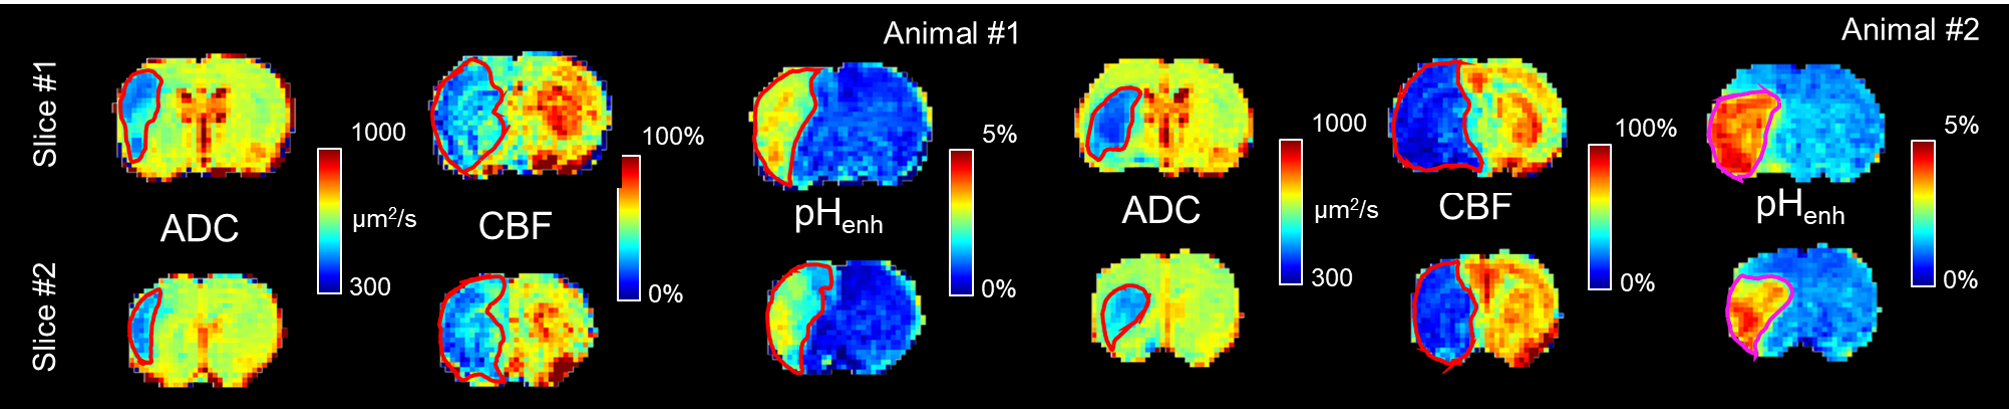
The contrast between the lesion and contralesional tissue for pHenh is greatest using a B1,2.0ppm of 0.5 μT and a B1,3.6ppm of 1.0 μT with a mean contrast of 2.86% (Fig. 1a). However, the CVR for this pairing was only 3.47 (Fig. 1b) due to the high variation in the tissue which resulted in a relatively large standard deviation in the contralesional tissue of 0.86% (Fig. 1c). Conversely, the largest CVR between the lesion and contralesional tissue for pHenh, 7.62, was obtained using a B1,2.0ppm of 0.6 μT and a B1,3.6ppm of 0.7 μT. This was a result of the contrast between the tissues being 2.38% while the variation was 0.32%. Maps of pHenh in an exemplary rodent demonstrate the differences in optimal parameters for contrast and CVR (Fig. 1d). Optimizing purely for contrast results in pHenh signals that are inherently negative. Scaling the maps around the contrast between the lesion and contralesional results in a relatively broad scale (~5.5%) from -18% to -12.5% while it is clear from the contralateral hemisphere that there is a significant amount of residual contrast that is not specific to pH change. This is mainly caused by the imbalance of the magnetization transfer effect at the two different offsets and powers. On the other hand, optimizing around CVR results in scaling that while being narrower (3.75%) remains purely positive (0-3.75%). Optimizing around CVR minimizes the spatial heterogeneity within the contralesional tissue while preserving the contrast between the lesion and the contralesional tissues.During the acute phase of stroke, an important therapeutic target is the ischemic penumbra or tissue salvageable by timely reperfusion. Although a mismatch between the apparent lesions defined by diffusion and perfusion imaging, i.e., the difference between ADC and perfusion attenuated tissues, is often used as a surrogate of the penumbra (Fig. 2), many studies have shown that the ADC/CBF mismatch often overestimate the penumbra7. The maps demarcated by pHenh show lesions that while larger than the lesions shown on ADC maps are smaller than those depicted by CBF. This mismatch between these three modalities may be able to provide new information useful in identifying penumbra, but more studies are needed to validate the tissue outcome in reperfusion studies.
Discussion
There were two major targets for optimization in this study, contrast, and CVR. Since contrast across the parameters studied remained steady within the range of ~2-3%, CVR was mainly dominated by the variation across each ROI because a great deal of this variation was caused by residual contrast that was non-specific to pH (e.g. cortex to subcortical contrast). Parameters which optimize CVR would be favorable to the general mapping of pathological conditions such as the case with the MCAO, while optimizing contrast may play a role when the detection of temporal pH changes are desired, such as caused by a physiological challenge6, where the background signal is less important since it will ultimately be subtracted out.Conclusion
pH-enhanced MRI is a useful method for the detection of pH alterations which can be tuned by optimization of either contrast to maximize sensitivity to pH changes or CVR to minimize background contrasts and improve the detection of spatial pH alterations.Acknowledgements
This work is supported by NIH grant NS100703.References
1.
Chen LQ, Howison CM, Jeffery JJ, et al. Evaluations
of extracellular pH within in vivo tumors using acidoCEST MRI. Magn Reson Med.
2014;72(5):1408–1417.
2.
McMahon
MT, Gilad AA, Zhou J, et al. Quantifying exchange rates in chemical exchange
saturation transfer agents using the saturation time and saturation power
dependencies of the magnetization transfer effect on the magnetic resonance
imaging signal (QUEST and QUESP): pH calibration for poly-L-lysine and a
starburst dendrimer. Magn Res Med. 2006;55(4):836–847.
3.
McVicar
N, Li AX, Goncalves DF, et al. Quantitative tissue pH measurement during
cerebral ischemia using amine and amide concentration-independent detection
(AACID) with MRI. J Cereb Blood Flow Metab. 2014;34(4):690–698.
4.
Ward
KM, Balaban RS. Determination of pH using water protons and chemical exchange
dependent saturation transfer (CEST) Magn Reson Med. 2000;44(5):799–802.
5.
Zhou
J, Payen JF, Wilson DA, et al. Using the amide proton signals of intracellular
proteins and peptides to detect pH effects in MRI. Nat Med.
2003;9(8):1085–1090.
6.
Jin
T, Wang P, Hitchens TK, et al.
Enhancing sensitivity of pH-weighted MRI with a combination of amide and
guanidyl CEST. Neuroimage 2017;157:341-350.
7.
Sun
PZ, Zhou J, Sun W, et al. Detection of the ischemic penumbra using pH-weighted
MRI. J Cereb Blood Flow Metab. 2007 Jun;27(6):1129-36.
Figures