3156
3D Steady-State Golden Angle Radial Sparse Parellel CEST (ssGraspCEST) MRI of the human brain at 3T.
Rodolphe Leforestier1, Ding Xia1, Li Feng1, and Xiang Xu1
1Biomedical Engineering and Imaging Institute, Icahn School of Medicine at Mount Sinai, New York, NY, United States
1Biomedical Engineering and Imaging Institute, Icahn School of Medicine at Mount Sinai, New York, NY, United States
Synopsis
Keywords: CEST & MT, CEST & MT
The purpose of this project was to study the applicability of a fast 3D CEST MRI technique called GraspCEST to extract amdie, guanidinium and rNOE CEST contrasts in human brain at 3T.Introduction
Chemical exchange saturation transfer (CEST) MRI is a molecular imaging technique that allows for detection of proteins and metabolites through their exchange properties with tissue water. In the human brain, these magnetization transfer mechanisms include direct proton exchange (amide protons, guanidinium protons) and exchange relayed nuclear Overhauser effect (rNOE). Most CEST/NOE experiments require the water signal to be acquired at a few saturation frequency offsets. Therefore, scans can be time-consuming and prone to motion artifacts. Radial acquisations are inherently robust to motion and has rencently been used for steady-state CEST imaging of the human brain. In this project [1] we further develop the radial CEST imaging by combining 3D golden angle radial sparse parallel imaging (Grasp) and steady-state CEST preparation. We investigated the applicability of extracting guanidinium CEST (guanCEST), amide proton transfer (APT) and rNOE contrasts in the human brain at 3T using this sequence.Methods
3D CEST experiments (2 healthy subjects) were done on a 3T MR scanner (MAGNETOM Skyra, Siemens Healthcare, Erlangen, Germany) clinical MRI scanner.A CEST-prepared sequence sequence with stack-of-stars golden-angle radial trajectory has been used [2], as shown in the in Figure 1.
CEST preparation is performed right before the acquisiton of each radial stack (i.e., all spokes corresponding to one acquisiton angle). There is no delay between acquisitions of different stacks in order to achieve steady-state CEST imaging.
Acquisition of each radial stack is done with centric-out ordering, and the rotation from one stack to the next follows the golden-angle scheme (i.e., adding 111.25°). GRASP reconstruction was subsequently performed by exploiting spatiotemporal image correlations to reconstruct dynamic images.
The total acquisition time of the sequence is 7 minutes with the following parameters: TR/TE = 2.43/1.12ms, flip angle = 5º, slice thickness = 5 mm, 8 slices, FOV = 256x256 mm2, matrix size = 128x128, Bandwidth 1000 Hz/Pixel, B1 of CEST preparation pulses are 0.5, 0.7 and 1.0 µT. A total of 51 frequency offsets were swept from -9.7 ppm (-1200Hz) to 6.5 ppm (800Hz), including two offsets at -405.7 ppm (-5000Hz) as unsatured reference (M0).
All image reconstruction and image processing were performed with Matlab.
Images were manually segmented, then two regions of interested were drawn (Figure 2A,B) in the white (WM) and grey (GM) matter.
Z spectra were calculated for these two ROIs after a ∆B0 correction using a linear interpolation of acquired offsets [3] and a normalization by the measurement at -9.7 ppm.
MTC background for positive and negative offset frequencies were fitted separately using Polynomial Lorentzian line-shape method (PLOF) [4] on offsets ranging from 0.5 to 6.5 ppm excluding [1.5, 5.0 ppm] and on offsets ranging from -9.7 to -0.5 ppm excluding [-5.0, 1.5 ppm], respectively.
GuanCEST, APT and rNOE signals were extracted by Lorentzian difference analysis, substracting the measured data from the MTC fitted background [4]. Guanidinium, amide and rNOE weighted maps were calculated using the same PLOF method and Lorentzian difference analysis voxel-wise.
Results
Z-spectra and PLOF fitted background between 0.5 and 6.5 ppm for three different B1 values are shown in Figure 2C,E for WM and GM, respectively. The MTC background of WM is stronger than that of GM, which is consistent with previous studies [5,7].The difference between the background PLOF fitted spectra and the Z-spectra from 0.5 to 6.5 ppm offset range are plotted in Figure 2D,F for WM and GM respectively.
For B1=0.5 µT, two distinct peaks can be observed, at 2.3 and 3.5 ppm representing Guan and amide CEST signals respectively with an intensity of 0.8 and 1% in WM, and both 0.9% in GM. rNOE peak was also observed at -3.5 ppm (figure not shown) with an intensity of 0.9% in both WM and GM.
As B1 increases, the amide peak decreases to 0.6 and 0.3% in the WM and GM respectively while remaining observable, yet distinguishing guanidinium peak becomes more complicated akin to study [4].
Amide, Guan and rNOE maps were generated by taking the integrated intensity of the Lorentzian difference in [2.0, 2.4 ppm], [3.3, 3.7 ppm] and [-3.7, -3.3 ppm] ranges respectively (Figure 3).
Conclusions
We have shown that 3D steady-state CEST imaging method based on the GRASP technique can be applied to detect in vivo GuanCEST, APT and rNOE contrasts in the brain, with relatively low B1 power. This technique provides as a fast, low-SAR, motion robust 3D whole-brain CEST imaging method, which will be especially valuable for the pediatric and elderly populations who cannot hold still in the scanners.Acknowledgements
R00EB026312References
[1] S Ran et al., Magnetic resonance in medicine 86.2 (2021): 893-906.
[2] L Feng et al., Magnetic resonance in medicine 72 (3), 707 (2014).
[3] M Zaiss et al., NMR in biomedicine, 27(3), 240-252.
[4] K Wang et al., Magnetic Resonance in Medicine (2022).
[5] A Deshmane et al., Magnetic resonance in medicine 81.4 (2019): 2412-2423.
[6] A Haase, Magnetic Resonance in Medicine 13.1 (1990): 77-89.
[7] S Mueller et al., Magnetic resonance in medicine 84.5 (2020): 2469-2483.
Figures
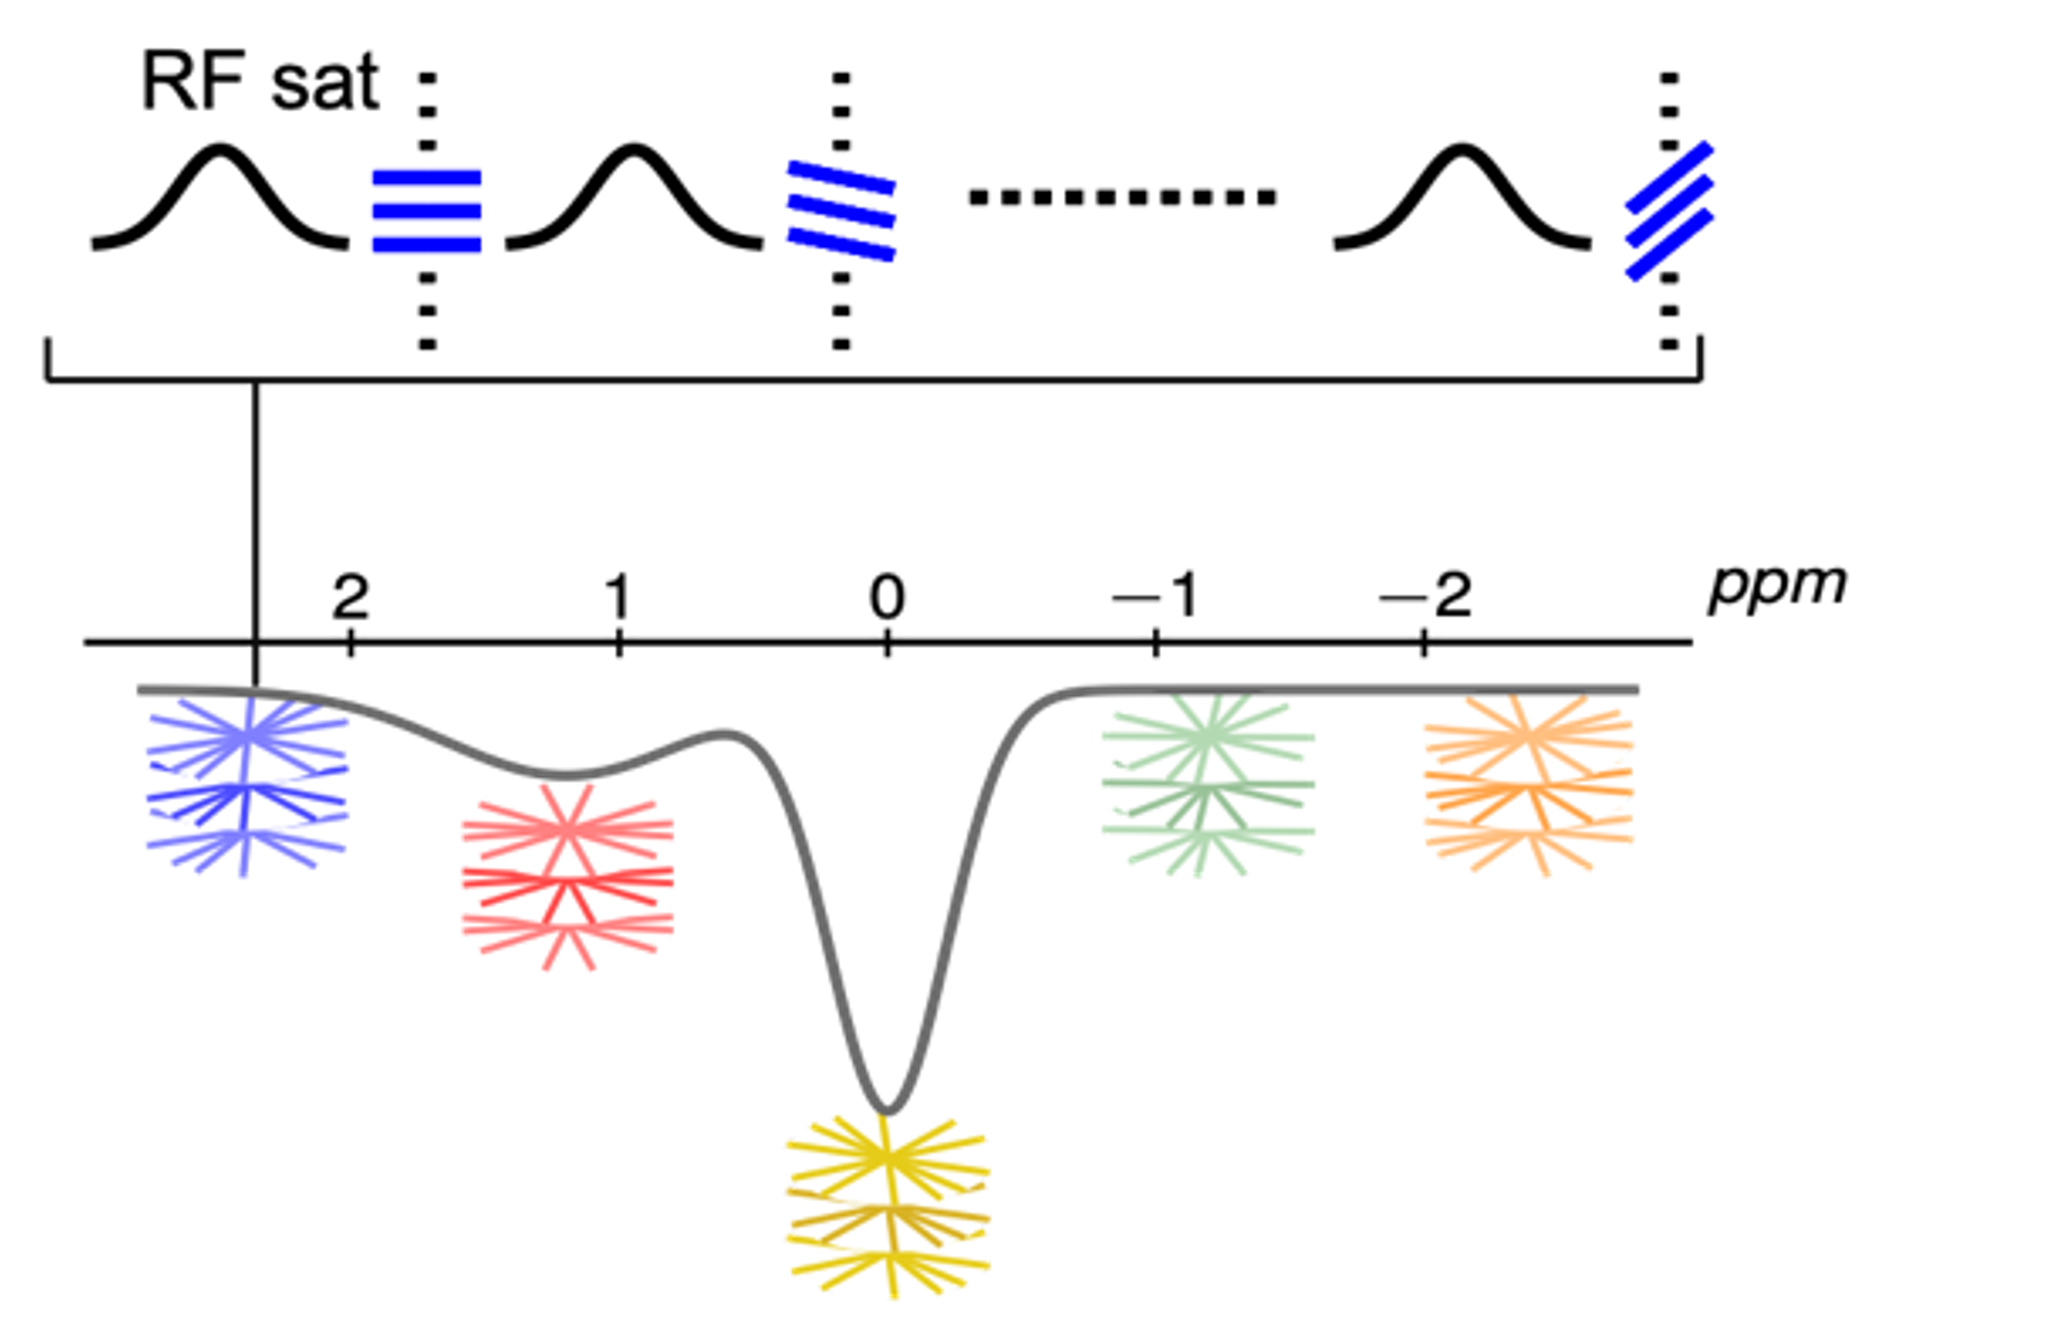
Illustration of steady-state GraspCEST acquisition scheme. CEST preparation is performed right before the acquisiton of each radial stack. Acquisition of each radial stack is rotated from one stack to the next via the golden-angle scheme.
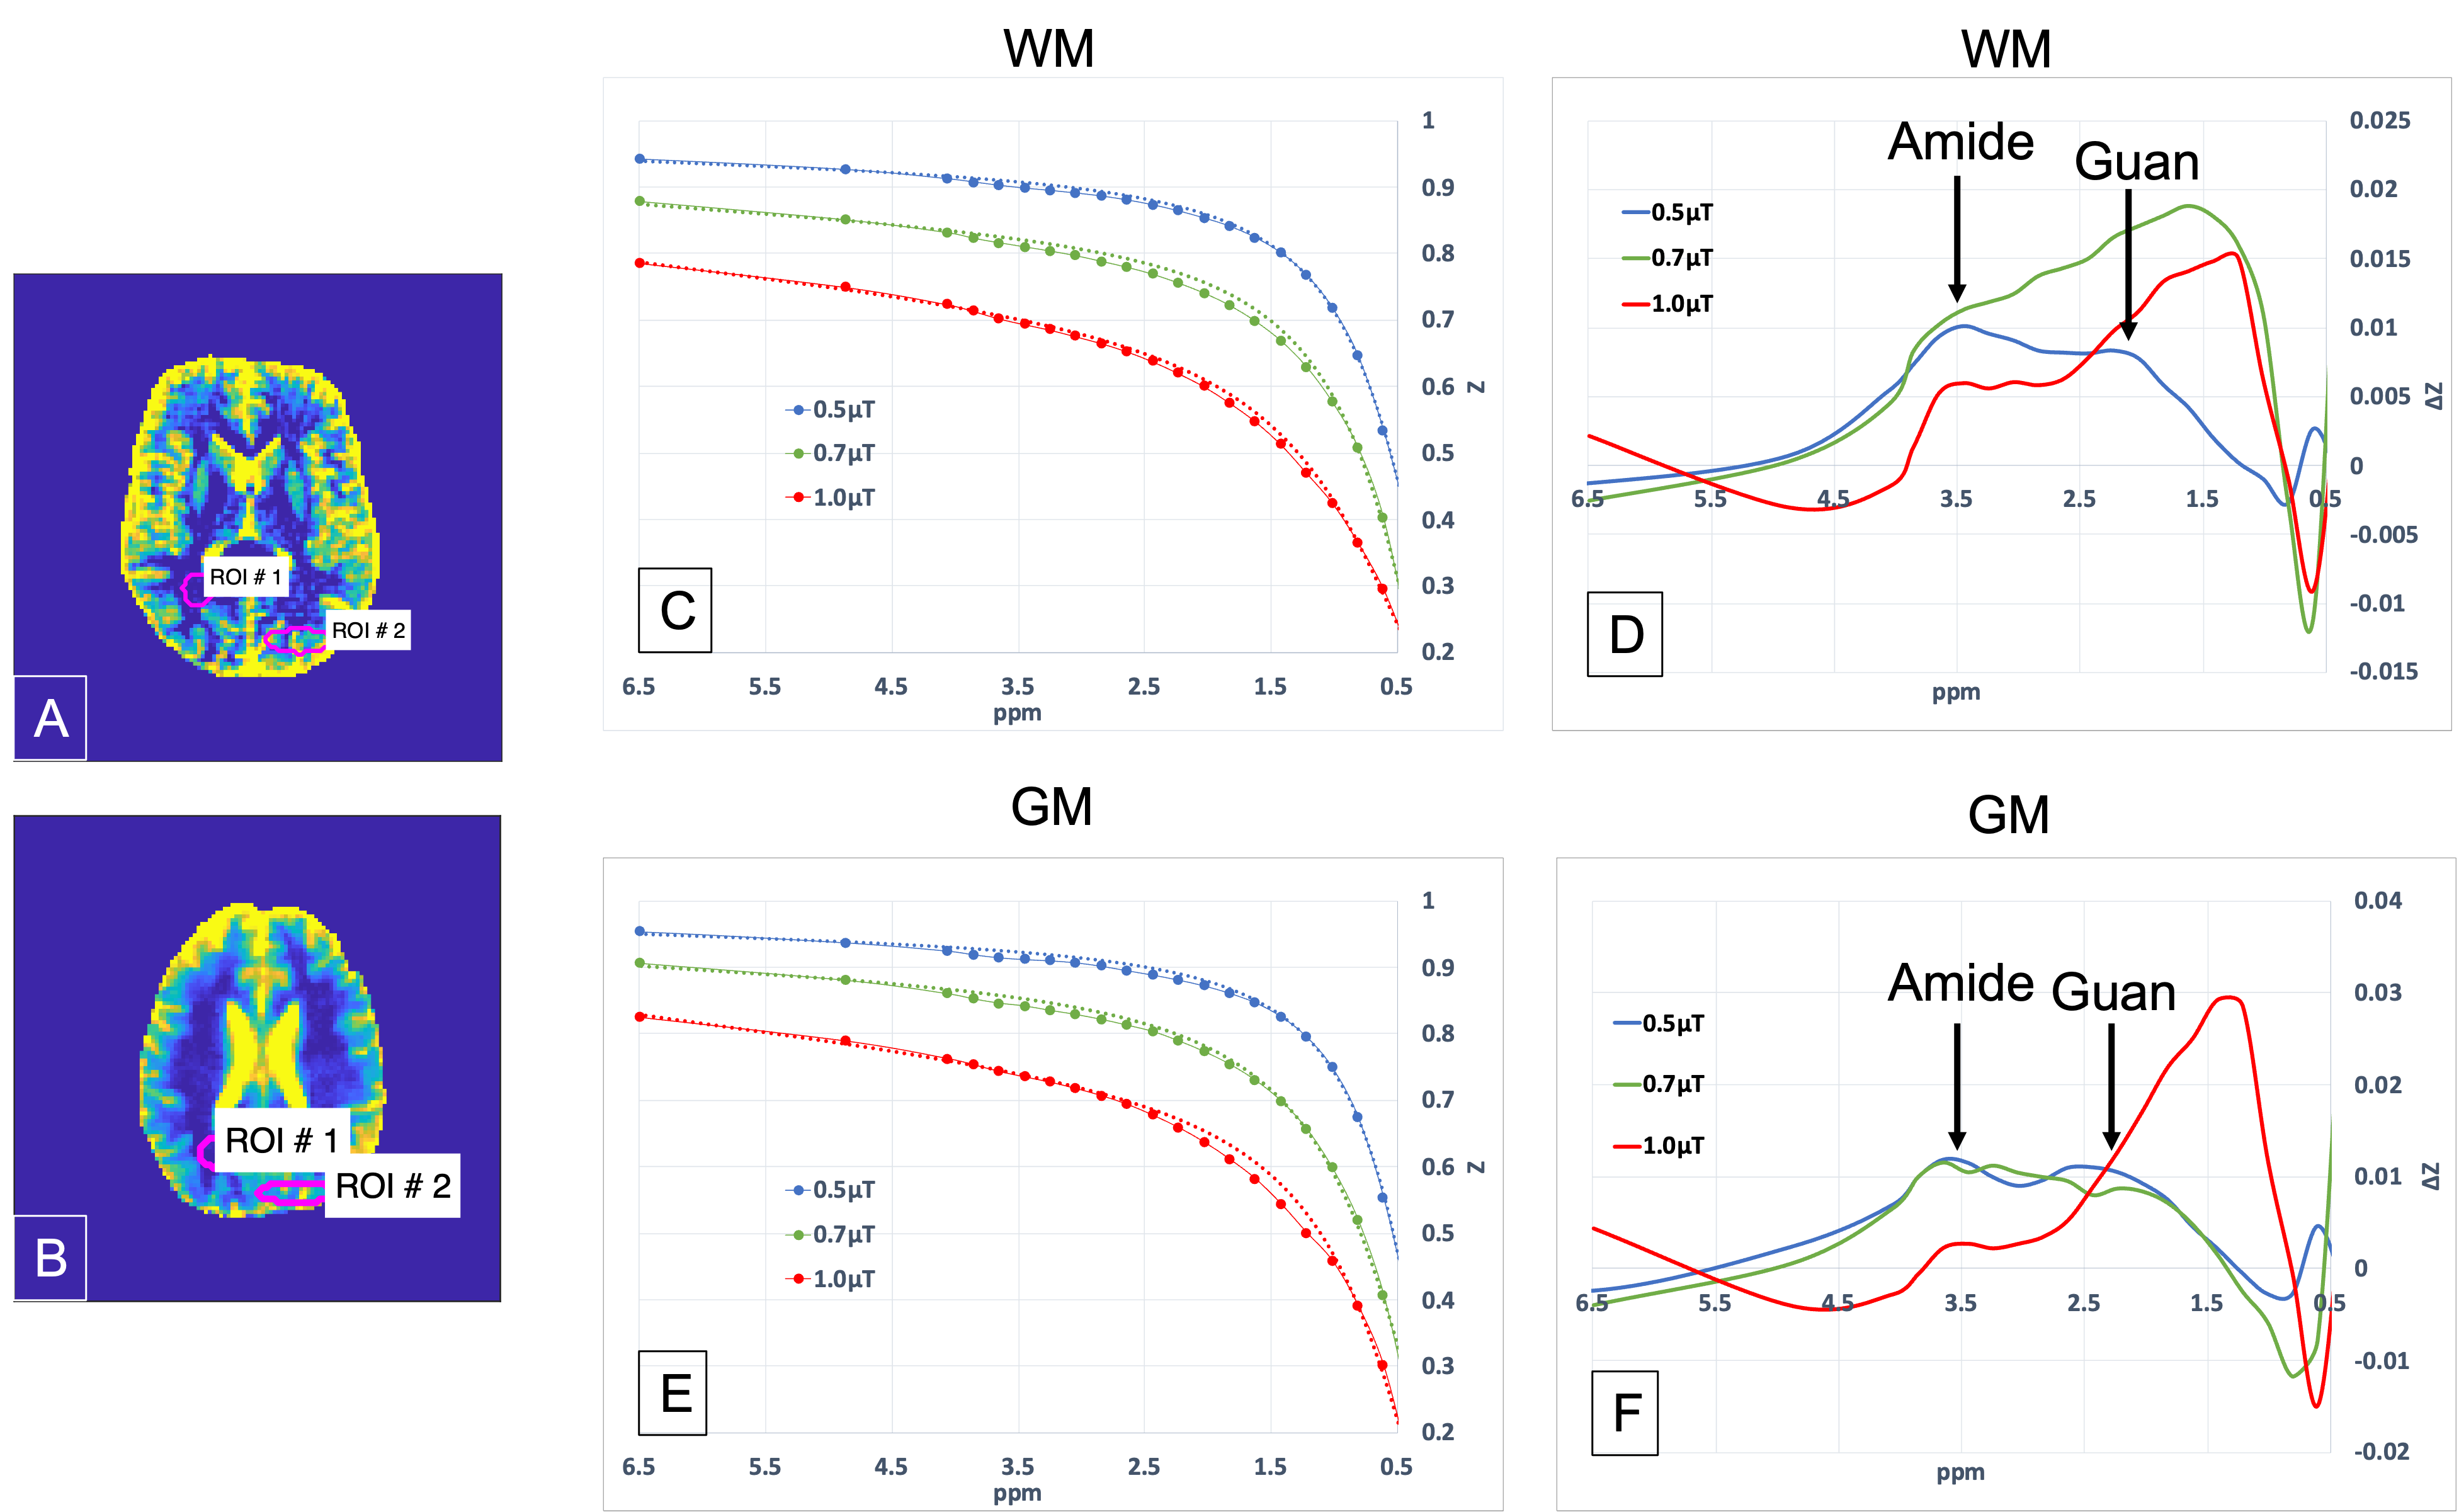
A and B, ROIs drawn in the WM (ROI1) and GM (ROI2) for two subjects. C and E, Z-spectra for the WM and GM, respectively, plotted with the PLOF background fitting for B1=0.5, 0.7 and 1.0 µT. D and F, Lorentzian Difference between PLOF fitted background and Z-spectra for WM and GM, respectively, for B1=0.5, 0.7 and 1.0 µT.
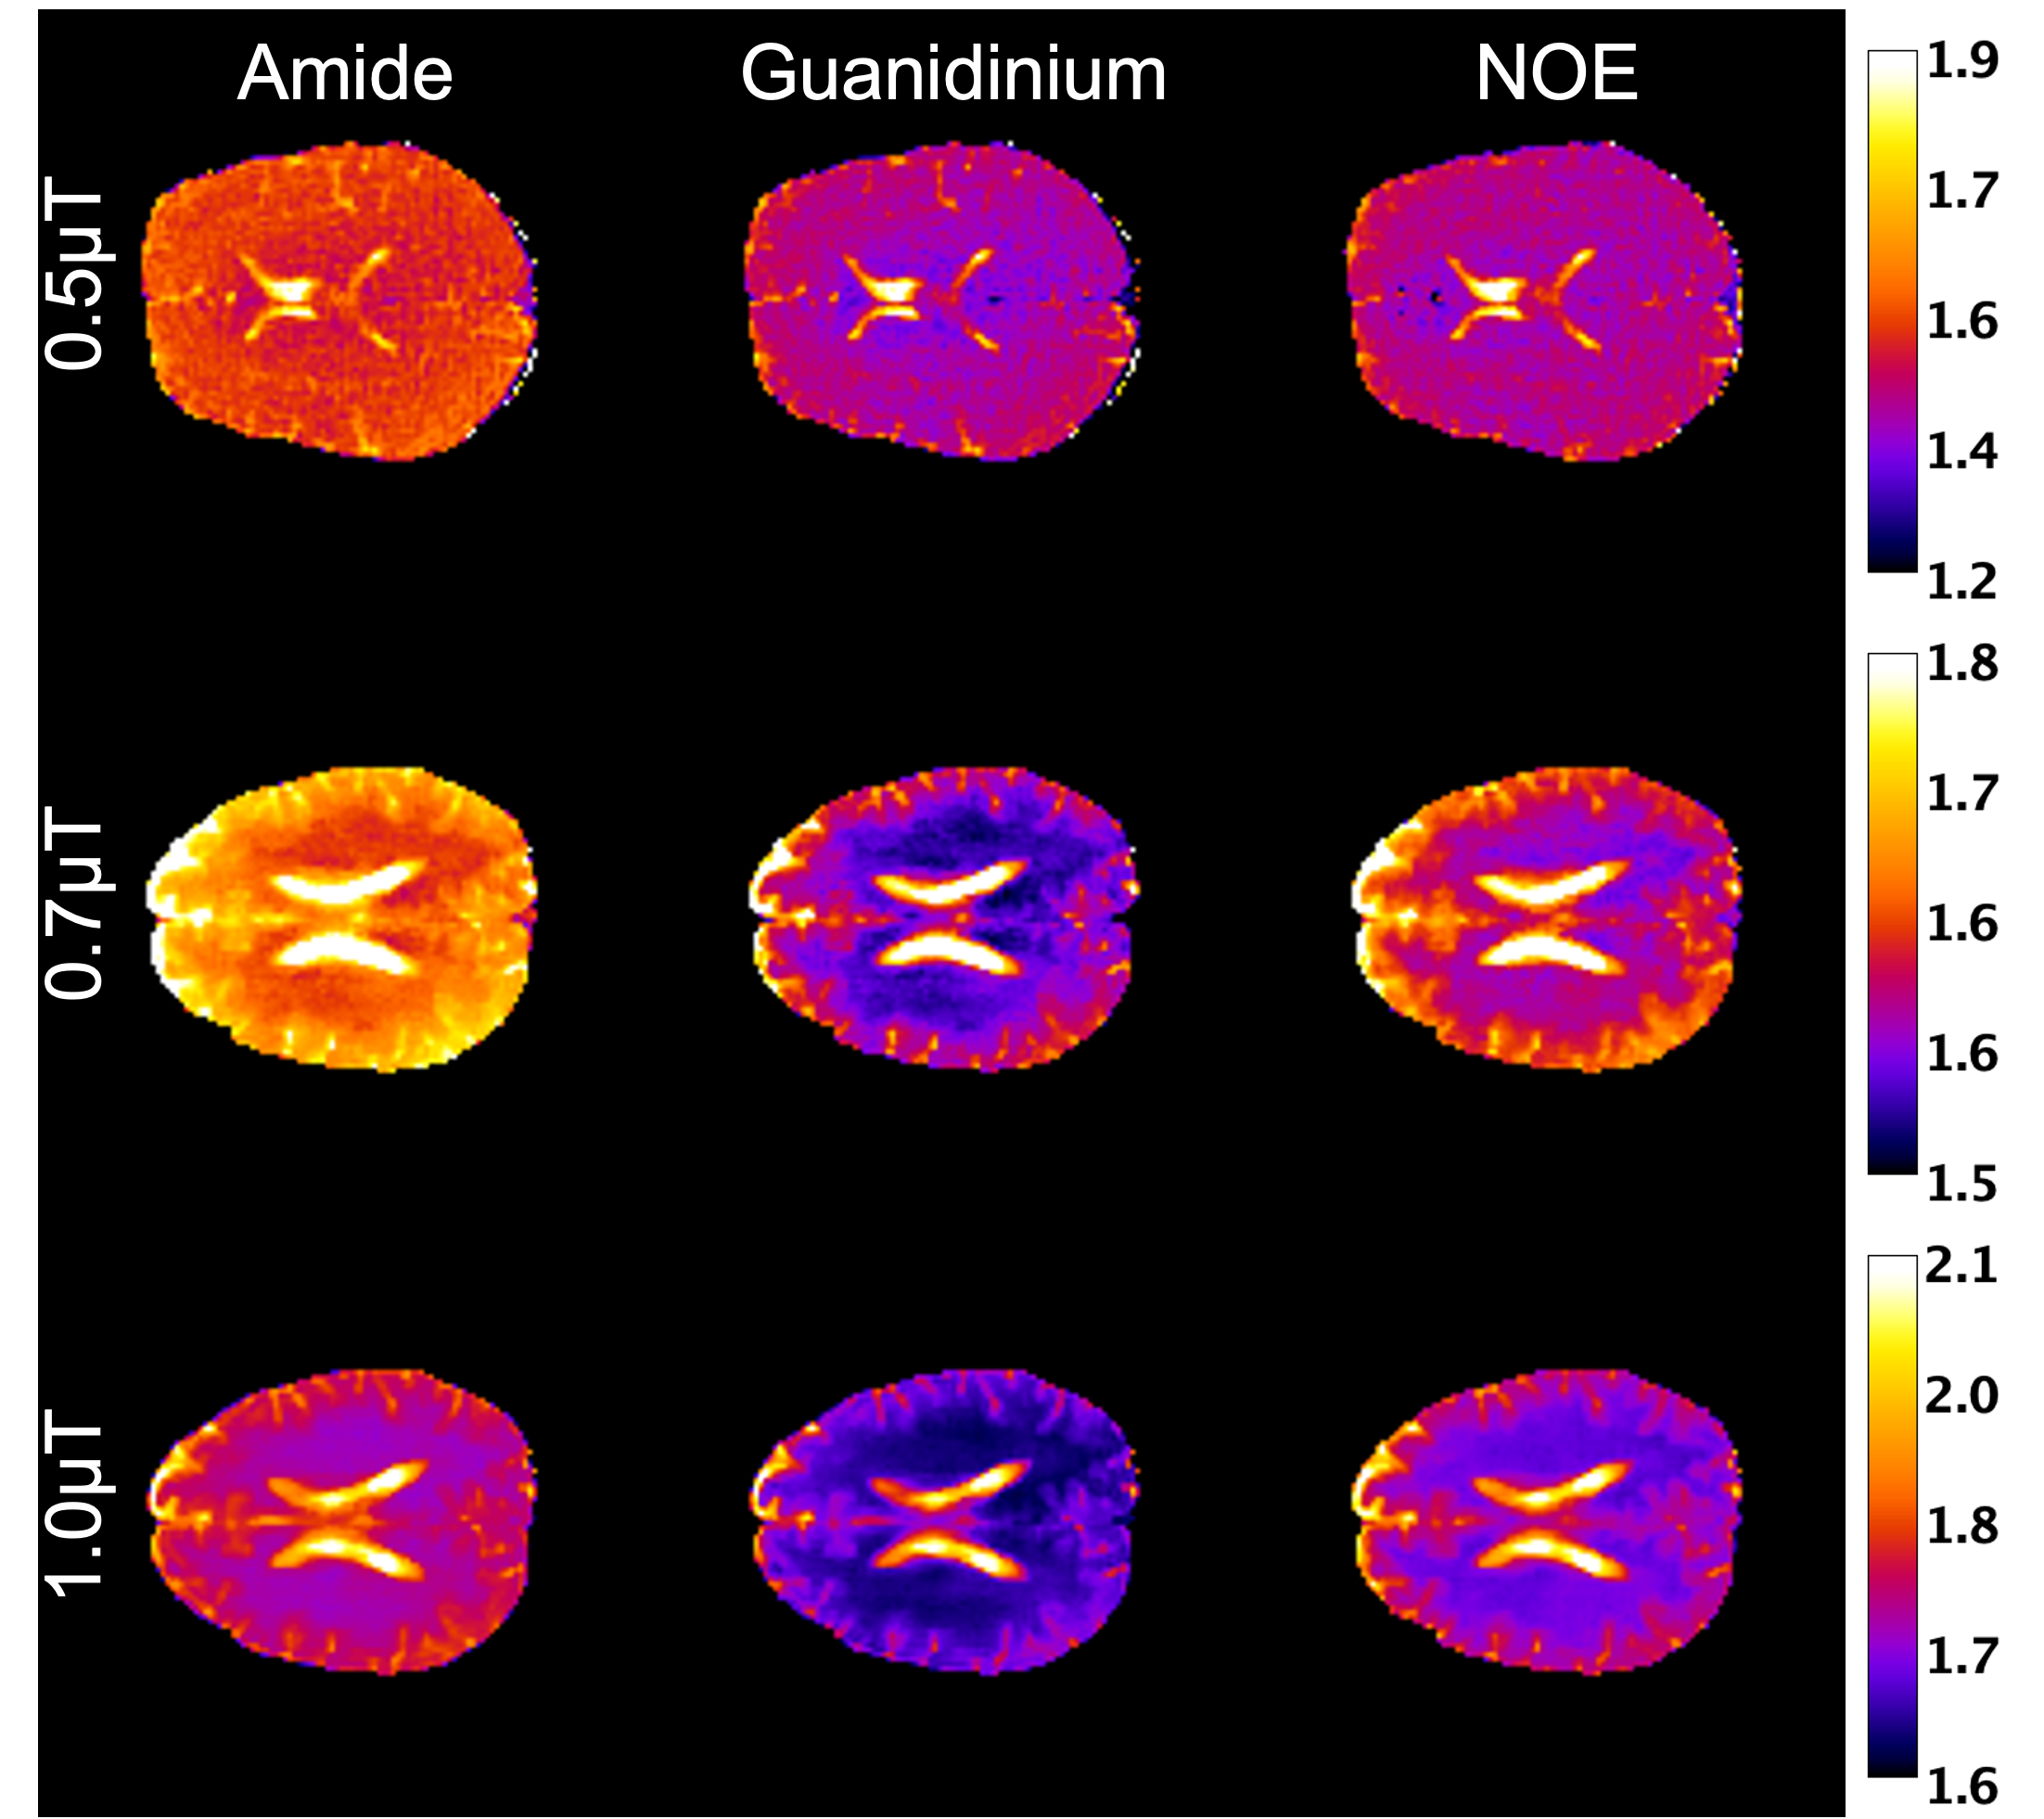
Amide, Guanidinium and rNOE maps for B1=0.5, 0.7 and 1.0 µT.
DOI: https://doi.org/10.58530/2023/3156