3155
Optimal flip angle and delay time of Gd-BOPTA-enhanced MRI in the normal liver and biliary imaging
Xue Ren1, Ying Zhao1, Qingwei Song1, Geli Hu2, Jiazheng Wang2, and Ailian Liu1
1The First Affiliated Hospital of Dalian Medical University, Dalian, China, 2Clinical and Technical Support, Philips Healthcare, Beijing, China
1The First Affiliated Hospital of Dalian Medical University, Dalian, China, 2Clinical and Technical Support, Philips Healthcare, Beijing, China
Synopsis
Keywords: Liver, Liver
Gadobenate dimeglumine (Gd-BOPTA) is a novel contrast agent for hepatobiliary specific magnetic resonance imaging.At present, there is no exact and recognized turning Angle and delay time for Gd-BOPTA enhanced MRI scanning, and no relevant research reports have been reported at home and abroad. This study intends to analyze the image quality of the liver and biliary system in the hepatobiliary stage of Gd-BOPTA enhanced MRI by using the combination of different rotation angles and delay time.Introduction
Gadobenate dimeglumine (Gd-BOPTA) is a new contrast agent for hepatobiliary specific magnetic resonance imaging. As an important parameter of MRI imaging, flip angles (FA) has been confirmed to have a certain impact on image quality [1]. Increasing FA can increase the contrast of hepatobiliary stage images [2]. In various studies of Gd-BOPTA, the delay time of HBP scanning was also different, mainly concentrated in 40~120 minutes after injection of contrast agent. At present, there is no exact and recognized turning Angle and delay time for Gd-BOPTA enhanced MRI scanning, and no relevant research reports have been reported at home and abroad. This study intends to analyze the image quality of the liver and biliary system in the hepatobiliary stage of Gd-BOPTA enhanced MRI by using the combination of different rotation angles and delay time, so as to explore the best scanning scheme of Gd-BOPTA enhanced MRI in the hepatobiliary stage.Methods
This study was approved by the local IRB. A total of 44 patients were included in this retrospective study. All patients underwent Gd-BOPTA-enhanced MRI examination. T1W, T2WI, and DWI were performed on a 3.0 T MR scanner using a 16-channel abdominal array coil (Ingenia CX, Philips Healthcare) with parameters listed in Table 1. Intravenous bolus injection of Gd-BOPTA was performed, and FA10°, FA15°, FA20°, FA25°, and FA30°hepatobiliary phase imaging was performed with a delay of 60 minutes and 120 minutes after contrast agent injection, respectively. MR raw data were transferred to the workstation (Intellispace Portal v10, Philips Healthcare) for post-processing. Region of interests (ROIs) were placed in the left lobe of the liver, the right anterior lobe of the liver, and the right posterior lobe of the liver, which avoided blood vessels and other abnormal liver tissues, and we placed ROIs on the paraspinal muscles on both sides of the same layer. Three ROIs were placed at different levels of the common bile duct. The average values of above parameters were taken for the further analysis. Signal intensity (SI), standard deviation (SD), signal-to-noise ratio (SNR), contrast-to-noise ratio (CNR), and bile duct-liver ratio (BLR) were measured and calculated, and the calculation formule were as follows: SNRLiver=SILiver/SDmuscle, CNRLiver=(SILiver-SImuscle)/SDmuscle, BLR=SIbile/SILiver. The Mann-Whitney U test was used to compare SNR, CNR, and BLR between scan groups with different FA and delay time, and the Friedman test was used for pairwise comparison within groups.Result
The agreement between the 2 observers was good (ICC > 0.75 for both). All parameters in the delay of 120min are higher than the delay of 60min. The SNR of the liver in the 120minFA30° group was the highest (63.91(49.44,77.15)), which was significantly different from the 60minFA10°and 120minFA10°groups (P<0.05). The CNR liver in the 120minFA30° group was the highest (44.21 (31.58, 53.64)), which was significantly different from the 60minFA10°, 60minFA15°, 60minFA20°, 60minFA30°, and 120minFA10° groups (P<0.05). The SNR of the bile duct in the 120minFA30° group was the highest (296.10 (190.36,382.40)), which was significantly different from the 60minFA10°, 60minFA15°, 60minFA30°, and 120minFA10° groups (P<0.05). The CNR bile duct and BMR in the 120minFA30° group were the highest, which were 270.62 (177.43, 363.27) and 14.79 (11.68, 17.89), respectively. They were all significantly different from the 60minFA10°, 60minFA15°, 60minFA20°, 60minFA25°, 120minFA10°, 120minFA15° groups (P<0.05).Conclusion
Longer delay time and higher flip angle have obvious advantages in the image quality and bile duct visualization. When taking into account the image display and bile duct visualization, 120minFA30°can be used as the preferred scan parameters.Acknowledgements
NoneReferences
1.Ibrahim EH, Arpinar VE, Muftuler LT, et al. Cardiac functional magnetic resonance imaging at 7T: Image quality optimization and ultra-high field capabilities[J]. World J Radiol. 2020,12(10):231-246. DOI:10.4329/wjr.v12.i10.2312.Inoue Y, Hata H, Nakajima A, et al. Quantitative Evaluation of Display Contrast of Gd-EOB-DTPA-Enhanced Magnetic Resonance Images: Effects of the Flip Angle and Grayscale Gamma Value[J]. Radiol Res Pract. 2019,2019:7630671. DOI: 10.1155/2019/7630671.Figures
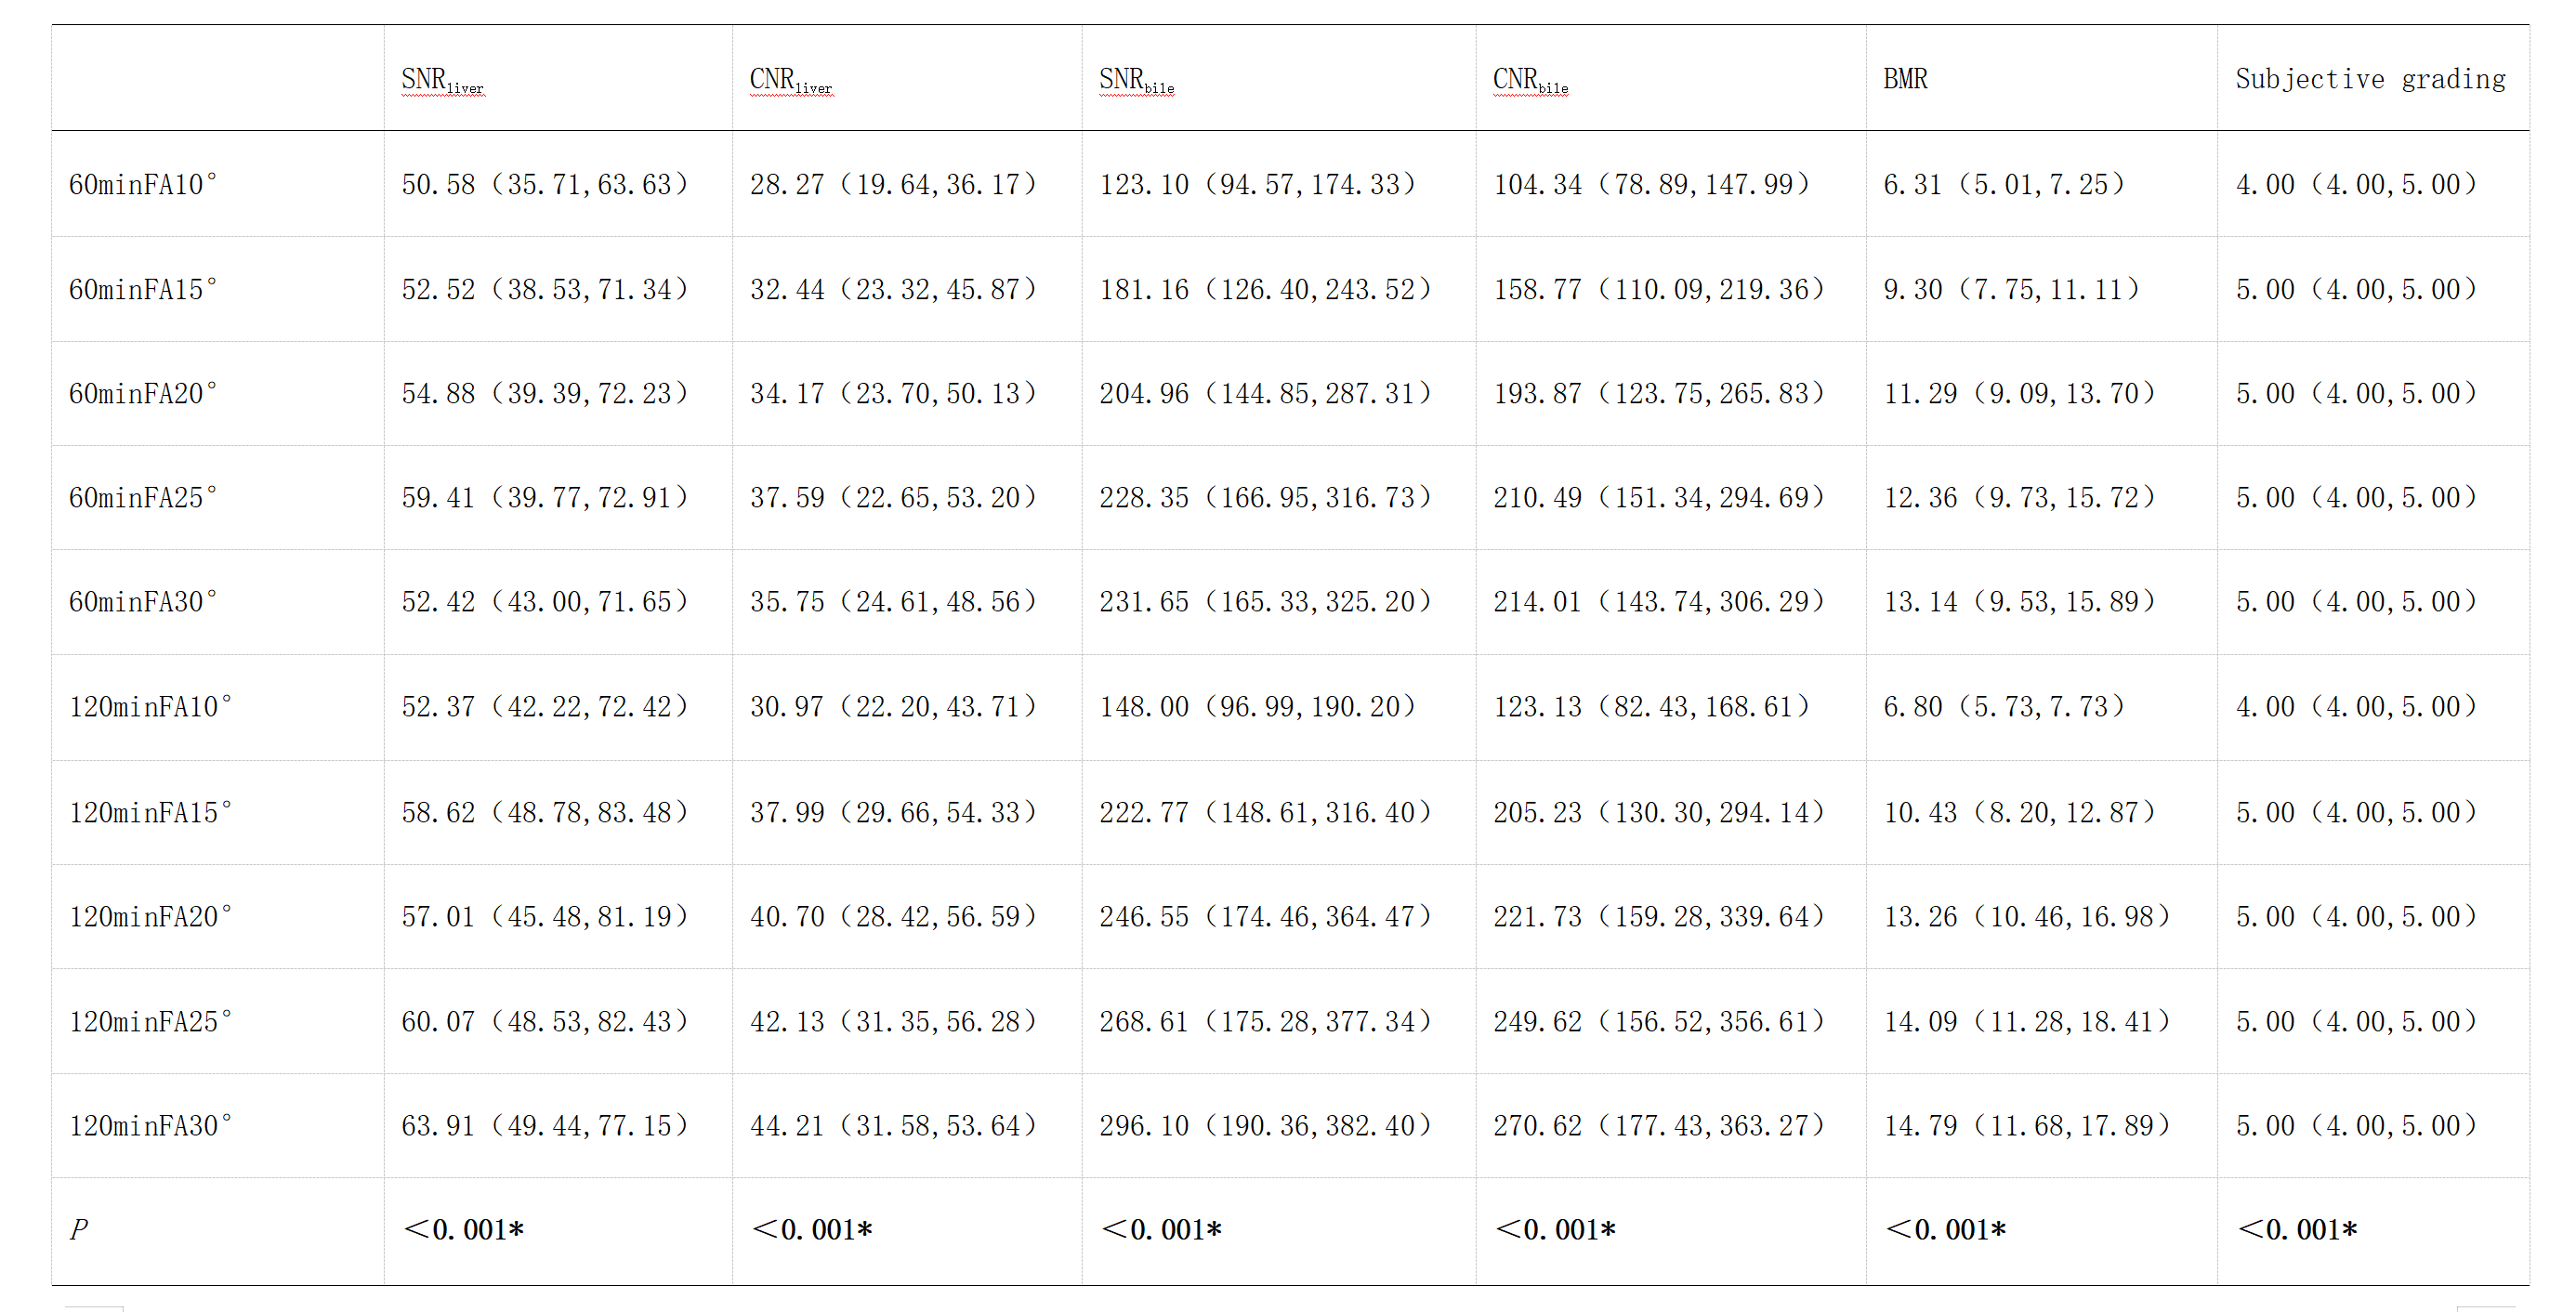
Table1
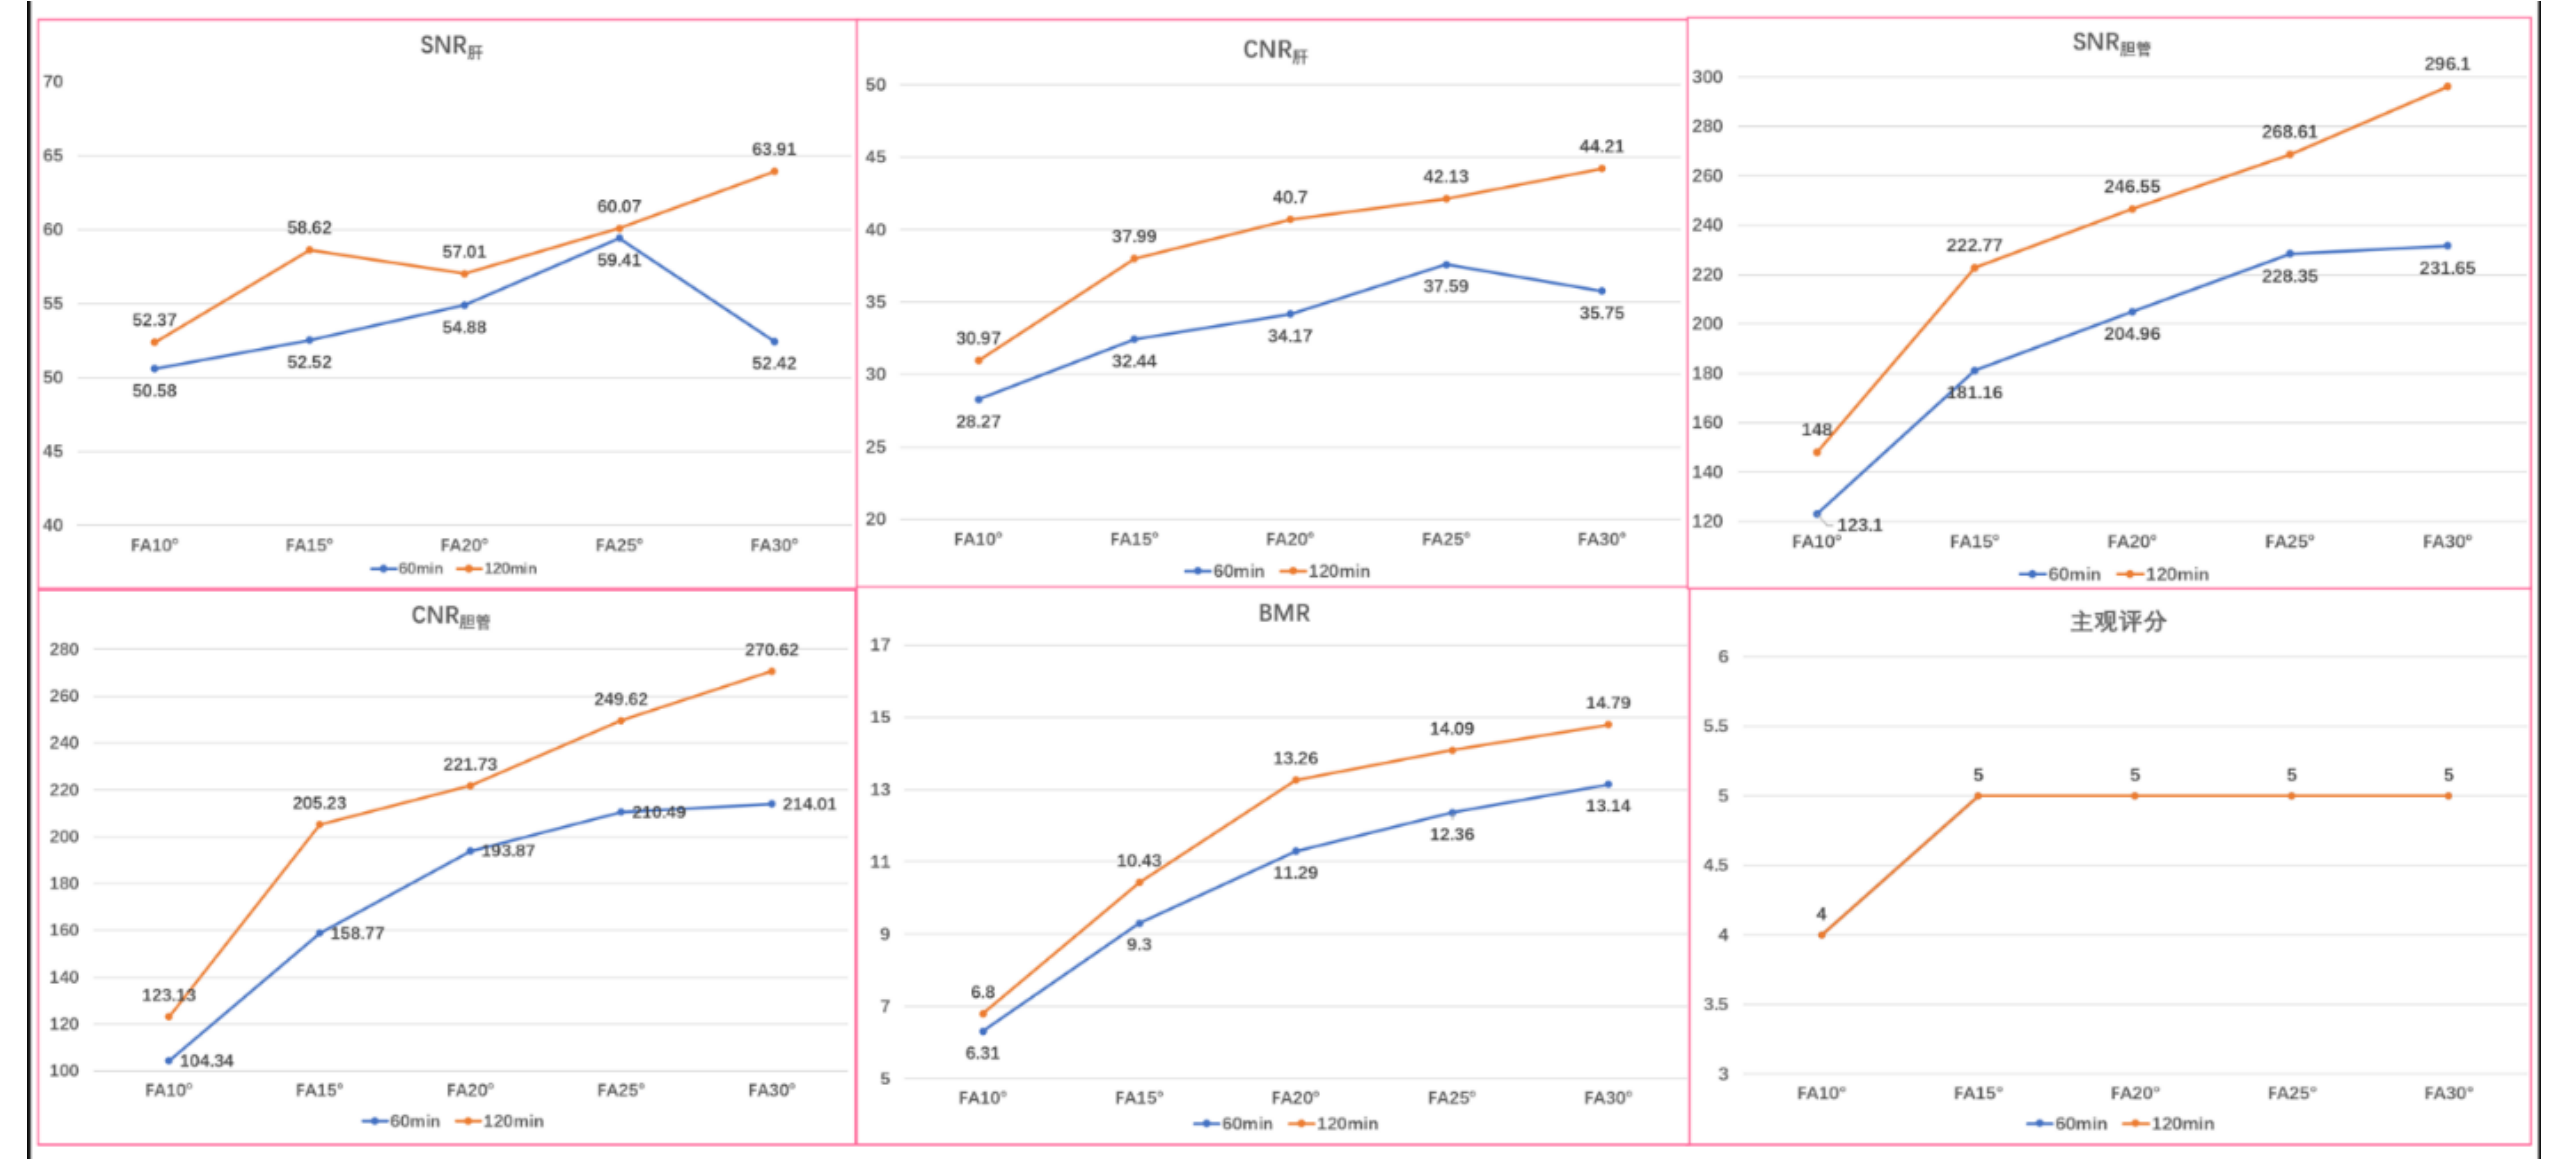
Figure 1
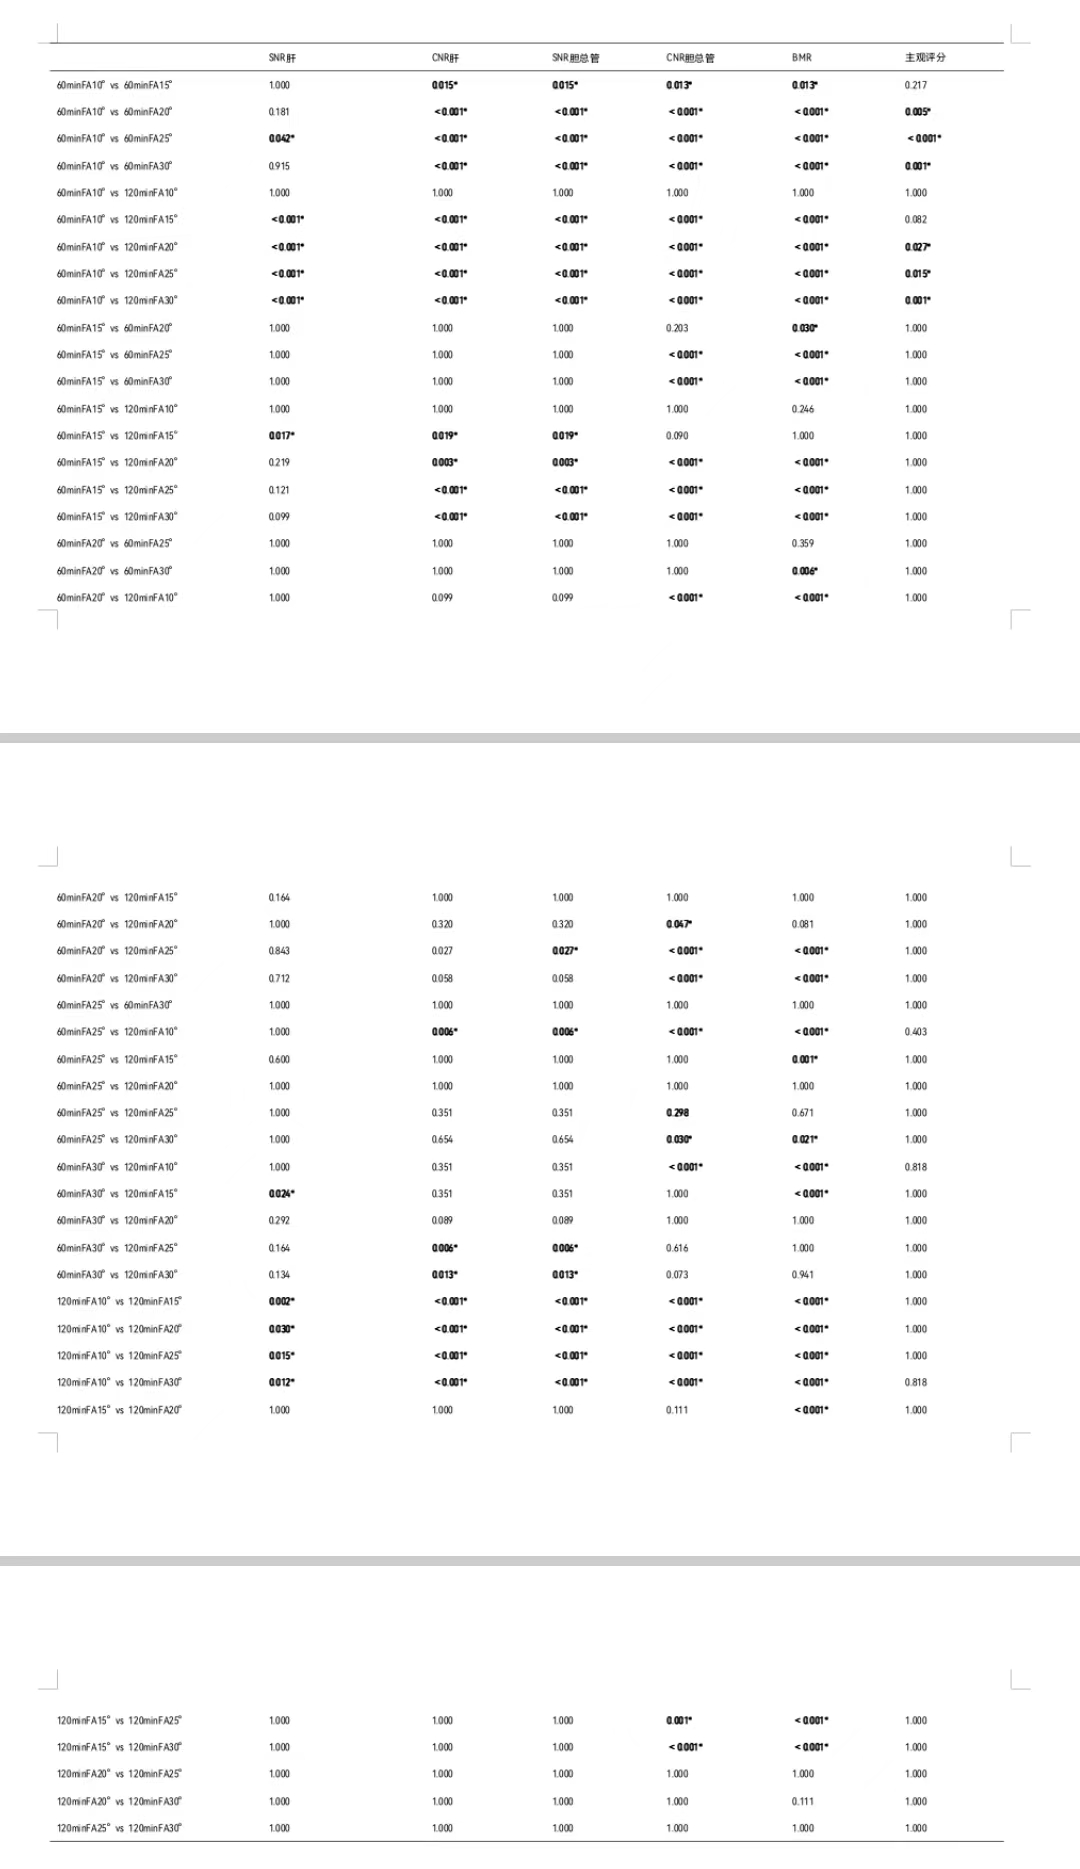
Table 2
DOI: https://doi.org/10.58530/2023/3155