3152
Evaluating Spatial Heterogeneity for Liver PDFF and R2* using Radiomics Features
Marjola Thanaj1, Nicolas Basty1, Ramprakash Srinivasan2, Madeleine Cule2, Elena Sorokin2, Jimmy Bell1, Elizabeth Louise Thomas1, and Brandon Witcher1
1Life Sciences, University of Westminster, London, United Kingdom, 2Calico Life Sciences LLC, South San Francisco, CA, United States
1Life Sciences, University of Westminster, London, United Kingdom, 2Calico Life Sciences LLC, South San Francisco, CA, United States
Synopsis
Keywords: Liver, Data Analysis, PDFF, R2*
MRI measures specific to the liver such as proton density fat fraction (PDFF) and R2* are proven biomarkers for assessing hepatic fat and iron content. There is an interest in using radiomics to extract additional information relating to spatial heterogeneity from images and apply these to clinical data. Here, we extracted radiomics features from liver PDFF and R2* and selected reproducible features and features that provide independent information to that derived from median liver PDFF and R2*. Additionally, we show that most radiomics features are negatively correlated with age and positively correlated with body mass index (BMI).Introduction
Liver proton density fat fraction (PDFF) and R2*, acquired from single-slice MRI, have been previously shown to be quantitative biomarkers for assessing hepatic fat and iron concentration¹⁻² although little is known about their spatial heterogeneity. Radiological texture features (or radiomics features) can provide quantitative biomarkers to evaluate the heterogeneity and have shown to be clinically meaningful in discriminating between groups of tissue with different shapes and textures³⁻⁴. Here we used PDFF and R2* maps of the liver to identify reproducible radiomics features and provide information beyond that which median liver PDFF and R2* can provide. We also explored the relationship between radiomics features, age, and body mass index (BMI).Methods
DataSingle-slice IDEAL MRI images of the liver available via the UK Biobank were processed and segmented using automated methods¹. PDFF and R2* were estimated using the PRESCO method⁵. We examined the liver PDFF of 35,752 participants and liver R2* of 35,773 participants at their baseline imaging visit and 3,088 participants who underwent a re-imaging visit.
Radiological texture feature analysis
Radiomics features were extracted using the PyRadiomics v3.0.1⁶ toolbox for the maps of liver PDFF and R2*. A total of 1,311 features were extracted per liver from the following Pyradiomics classes: Shape, First Order, Second order including: Gray Level Co-occurrence Matrix (GLCM), Gray Level Dependence Matrix (GLDM), Gray Level Run Length Matrix (GLRLM), Gray Level Size Zone Matrix (GLSZM), Neighbouring Gray Tone Difference Matrix (NGTDM) as well as features with wavelet filtering using 4 levels of wavelet decompositions and coif1 filter.
Statistical analysis
Pearson’s correlation coefficients were used to judge whether features provided additional independent information to the median liver PDFF and R2*, where lower correlations were desirable. Baseline repeatability was assessed using the intraclass correlation coefficient (ICC) based on a two-way mixed effect, consistency and single rater/measurement⁷ and was computed between 3,088 participants at both baseline and re-imaging scans. Features that showed > 0.5 repeatability and < 0.5 absolute values of correlation coefficient with median liver PDFF and R2* were selected. Highly correlated features were discarded by removing the feature with the largest mean absolute correlation. Spearman’s rank correlation coefficient was used to assess monotonic trends between variables. P-values < 0.05 were judged to be statistically significant.
Results
Figure 1 shows sample images and Bland-Altman plots of baseline and follow-up differences for median liver PDFF and R2*. The correlation between radiomics features and median liver PDFF and R2* showed that 1,206/1,311 and 1,016/1,311, respectively had an absolute correlation coefficient < 0.5 (Figure 2a). ICC showed that 176 and 302 had repeatability > 0.5 for the liver PDFF and R2*, respectively (Figure 2b). After combining the information from figure 2 and removing highly correlated features, we found 38 and 36 radiomics features that scored > 0.5 ICC and < 0.5 absolute values of correlation coefficient with median liver PDFF and R2*, respectively (Figure 3). The features selected for liver PDFF included first order, GLCM, GLDM, GLRLM, shape and wavelet filtering on first order, GLDM, and GLRLM. The features selected for liver R2* included shape and wavelet filtering on GLDM and GLRLM.Significant negative correlations were shown between median liver PDFF and age for male subjects, with a positive correlation in females. These opposing correlations were consistent for the first and second-order radiomics features. After wavelet filtering, the correlations with age were negative in both genders (Figure 4a). We found significant positive correlations between most radiomics features with wavelet filtering as well as median liver PDFF and BMI in both genders although we observed negative correlations between first-order Entropy, GLCM InverseVariance, GLCM JointEntropy, GLRLM RunPercentage and BMI in both genders (Figure 4b). We observed significant positive correlations between median liver R2* and age in both genders although significant negative correlations were observed between most radiomics features, in both men and women (Figure 5a). We found positive correlations between radiomics features and BMI in both genders, although for median liver R2* this only reached significance in females.
Discussion and Conclusion
We have extracted quantitative biomarkers of liver PDFF and R2* using radiomics analysis and demonstrated the application of this methodology in a large cohort. We have further identified the most informative features that are repeatable and hold independent information to median liver maps. Radiomics features related to wavelet filtering were significantly negatively correlated with age showing the opposite direction of their relationship from median liver PDFF and R2* whereas BMI was positively associated with most of the radiomics features related to wavelet filtering for both liver maps and in both genders. We believe that these opposing correlations may be due to less detail being captured from the wavelet filtering. However, recent studies suggest that radiomics features following wavelet transformation were stronger predictors of malignancy in lung nodules⁸. Future work will enable population-wide studies to utilise the radiomics features from liver PDFF and R2* which may potentially be used to provide novel information about health outcomes.Acknowledgements
This research has been conducted using the UK Biobank Resource under Application Number 44584 and was funded by Calico Life Sciences LLC.References
- Liu Y. et al. Genetic architecture of 11 abdominal organ traits derived from abdominal MRI using deep learning. eLife 2021; 10:e65554.
- Doyle E.K. et al. Effects of B1+ Heterogeneity on Spin Echo-Based Liver Iron Estimates. Journal of magnetic resonance imaging : JMRI 2022, vol. 55,5: 1419-1425.
- Brooks, F.J. et al. Quantification of heterogeneity observed in medical images. BMC Med Imaging 2013, 13, 7.
- Kim H.S., Kim JH, Yoon YC, Choe BK (2017) Tumor spatial heterogeneity in myxoid-containing soft tissue using texture analysis of diffusion-weighted MRI. PLOS ONE 12(7): e0181339.
- Bydder M. et al. Constraints in estimating the proton density fat fraction. Magnetic Resonance Imaging 2020, 66:1–8.
- van Griethuysen J.J. et al. Computational Radiomics System to Decode the Radiographic Phenotype. Cancer Research 2017, 1:77(21):e104-7.
- Bartko, J. J. The intraclass correlation coefficient as a measure of reliability. Psychol. Rep. 1966, 19, 3–11.
- Jing, R. et al. A wavelet features derived radiomics nomogram for prediction of malignant and benign early-stage lung nodules. Sci Rep 2021, 11, 22330.
Figures
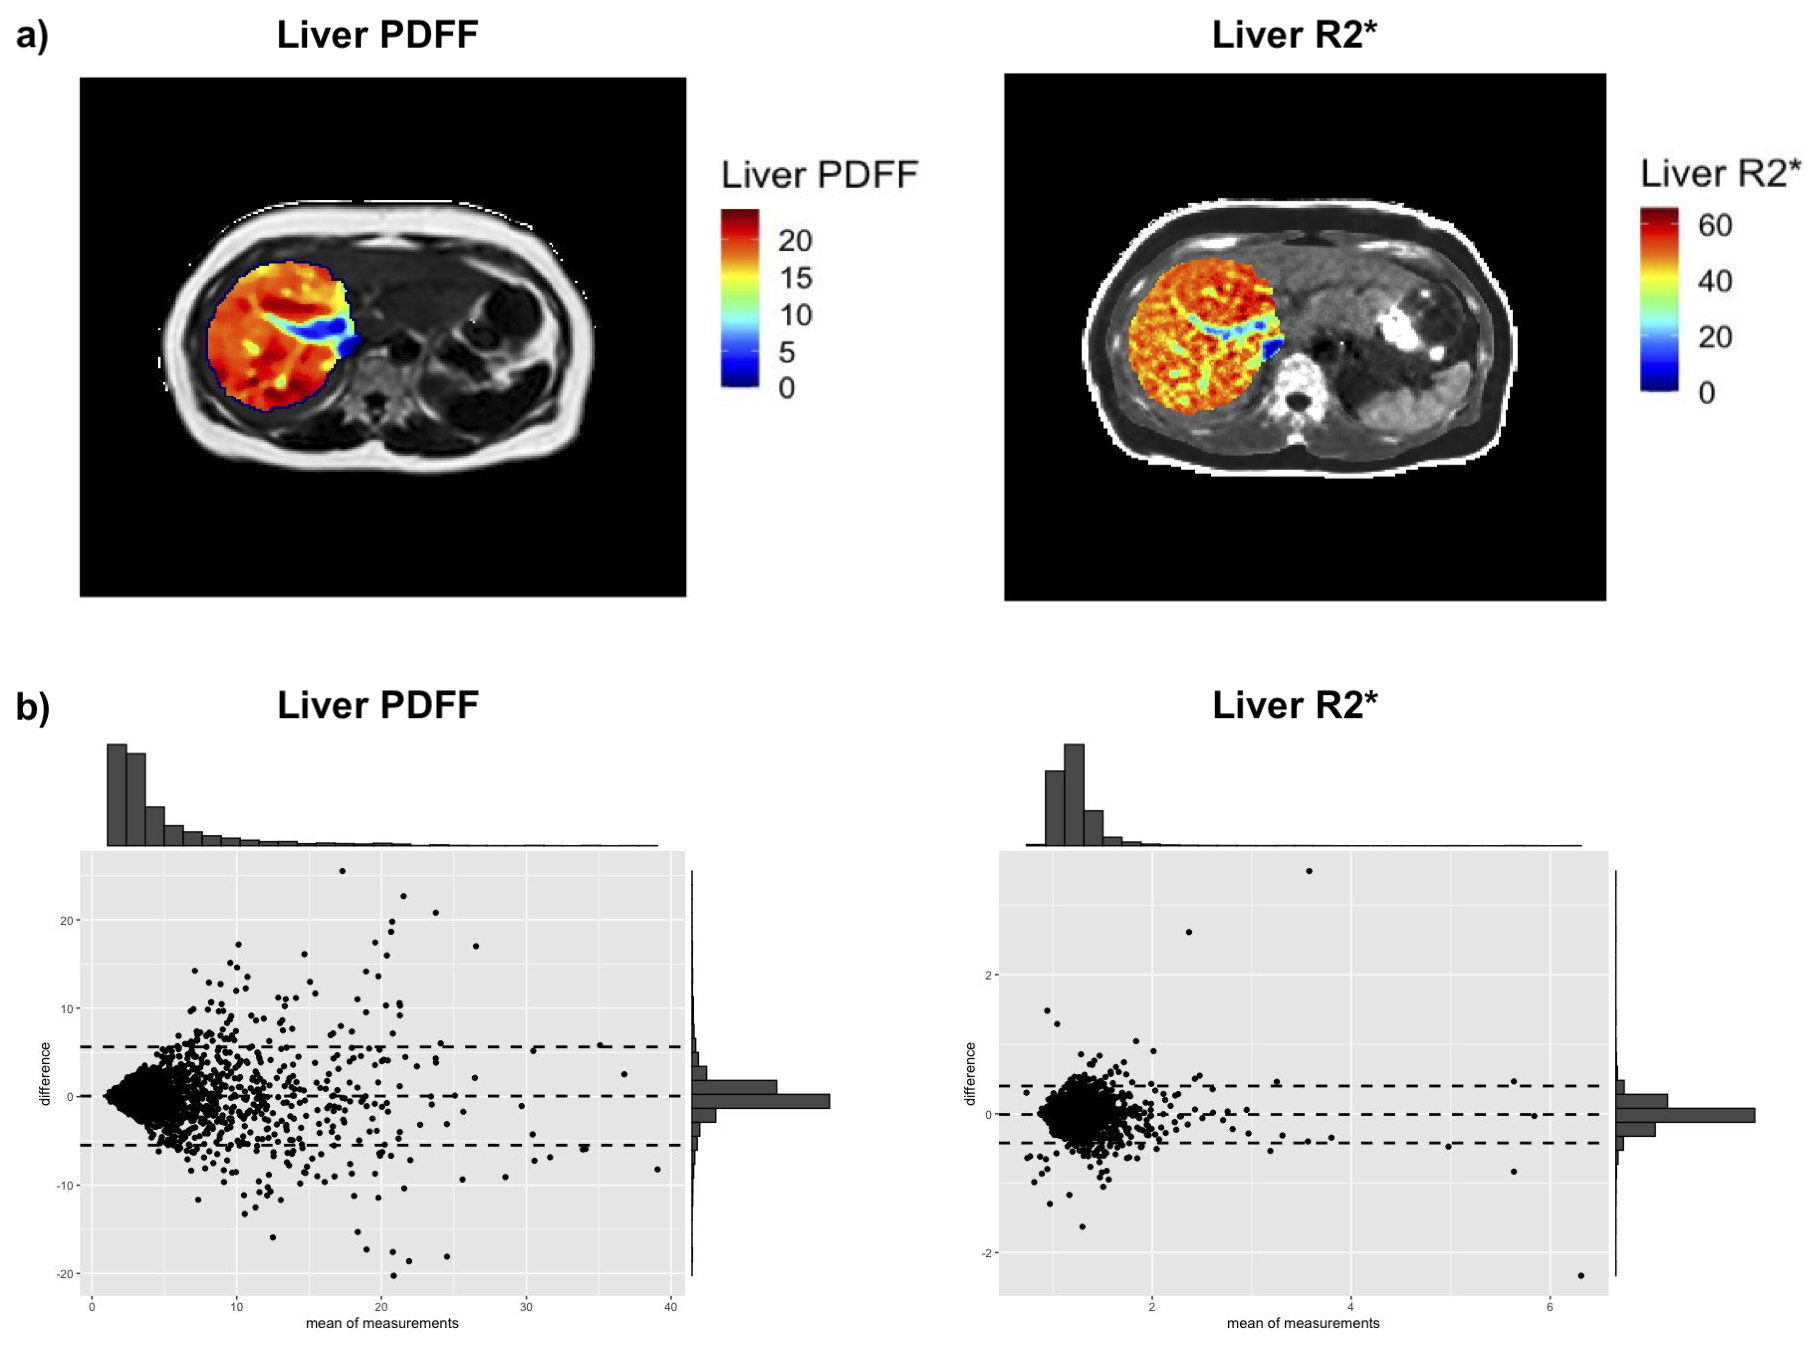
Figure 1. a) Liver PDFF and R2* maps at baseline from one participant (top plots) and b) Bland-Altman plots showing the average and baseline and re-imaging scans difference for median liver PDFF and R2* (bottom plots).
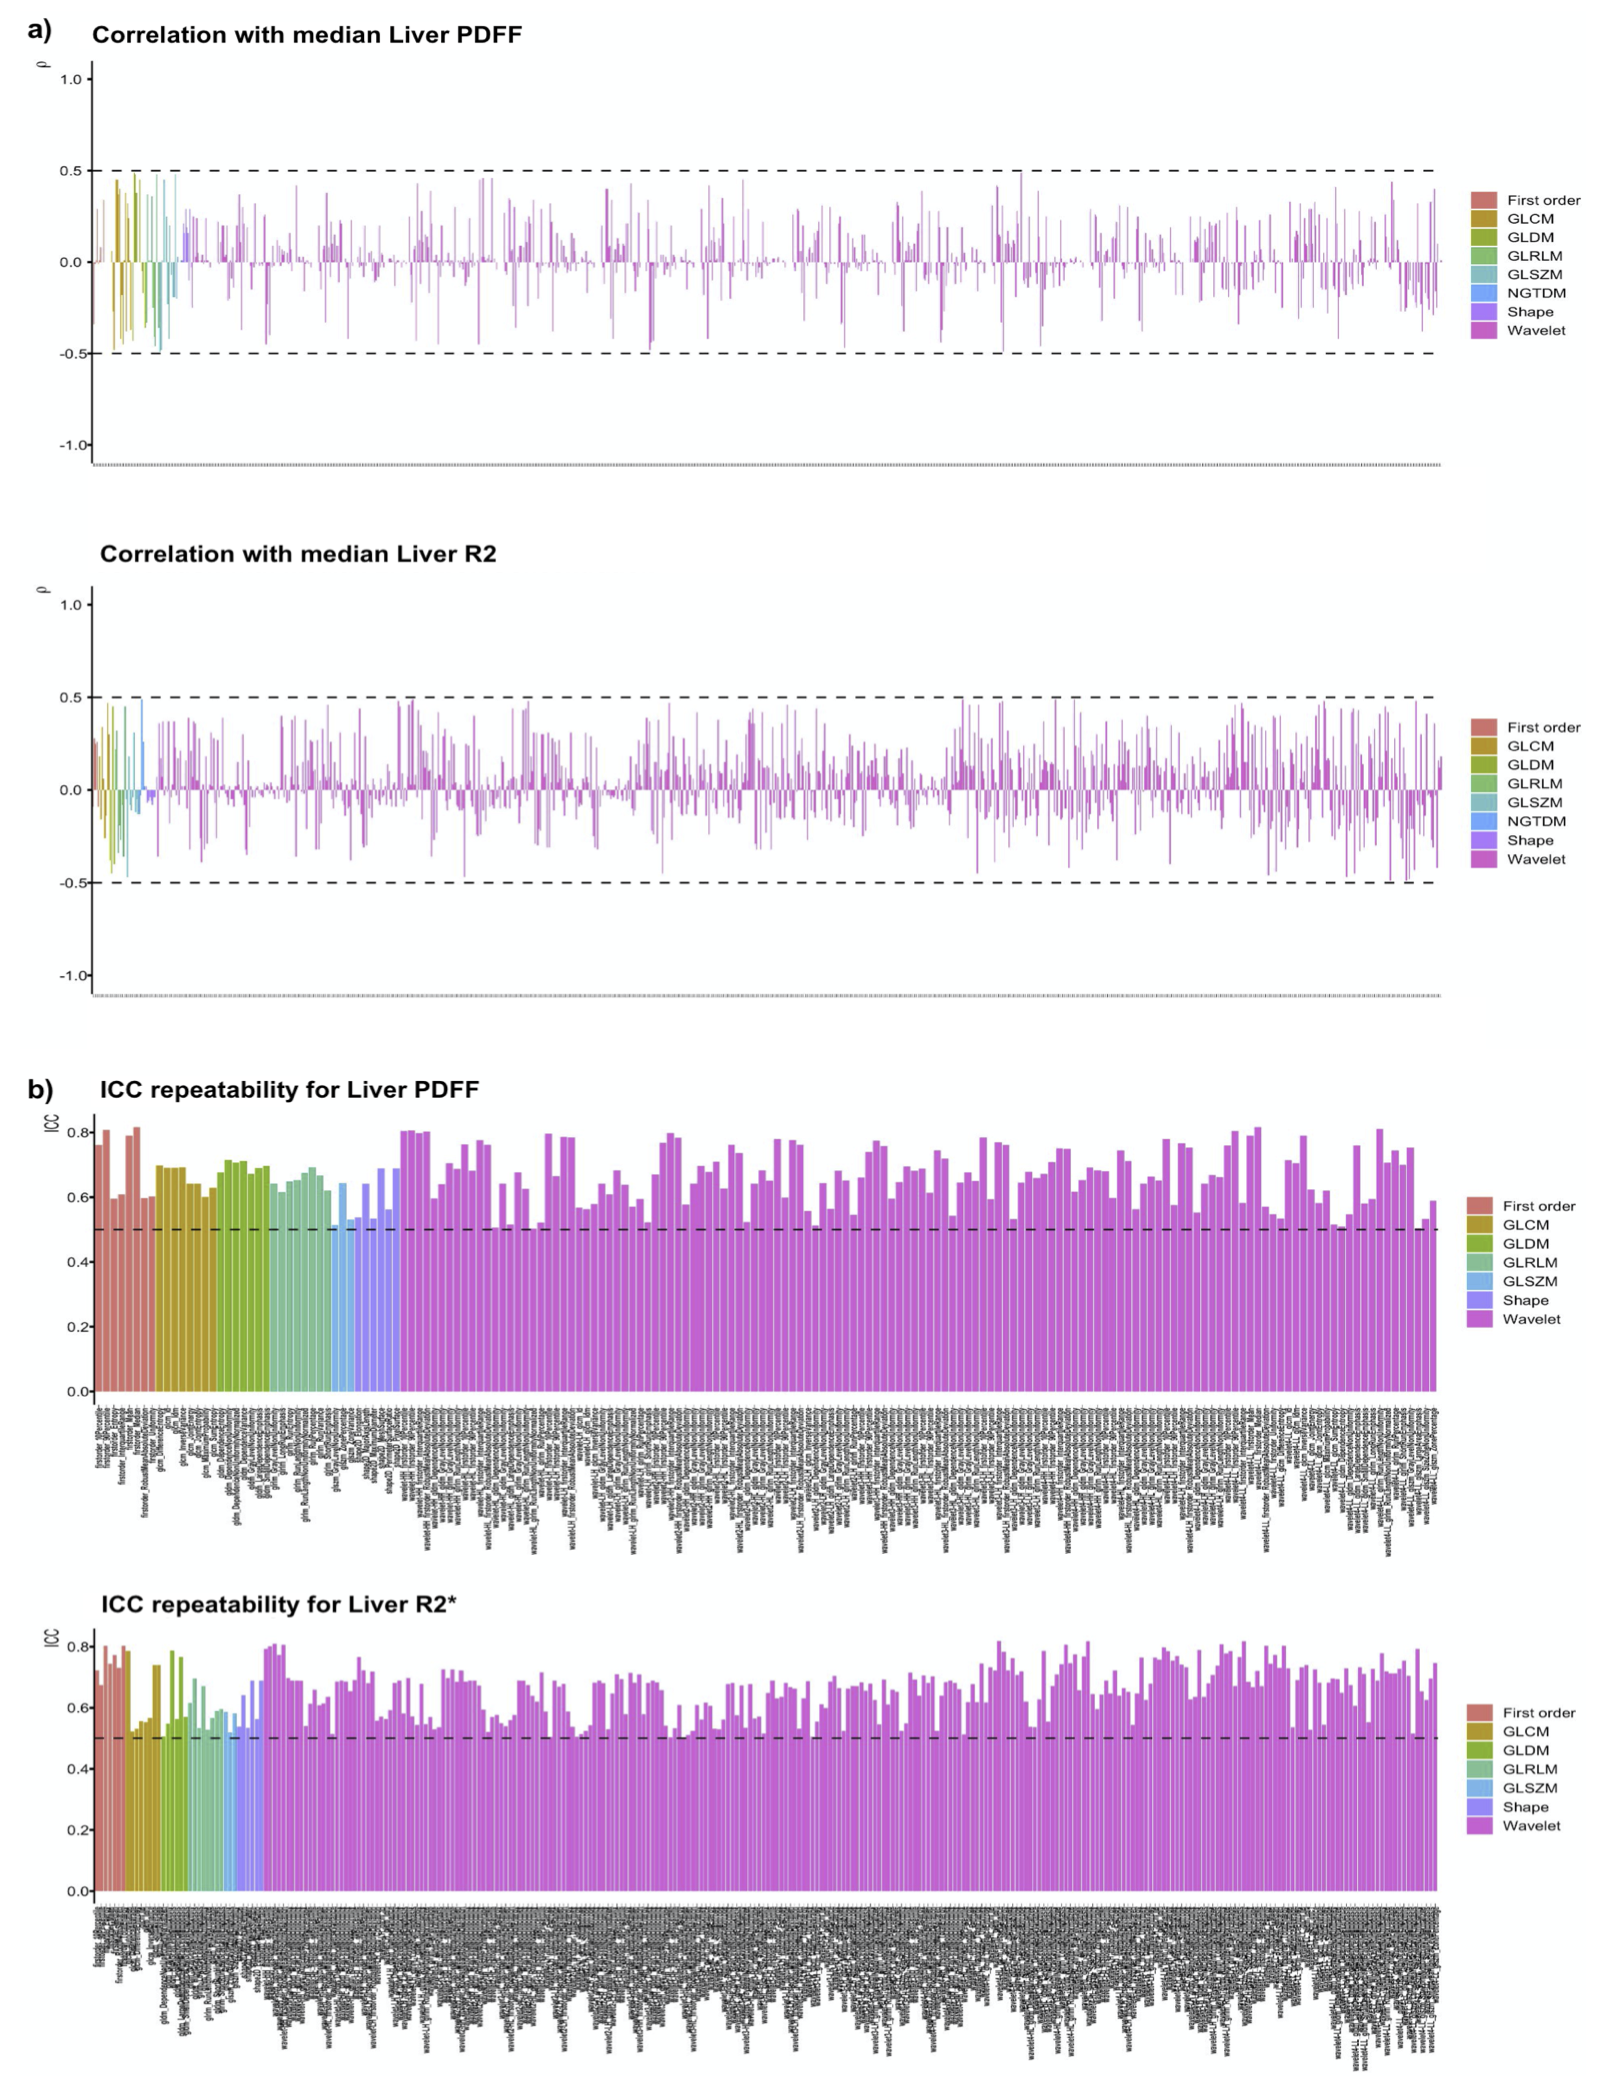
Figure 2. a) Radiomics feature selected using Pearson’s correlation with the median liver PDFF (N=1,206 features, top plot) and median R2* (N=1,016 features, bottom plot) and b) radiomics feature selected using ICC for repeatability for liver PDFF (N=176 features, top plot) and median R2* (N=302 features, bottom plot). Pyradiomics classes: First Order (red), GLCM (orange), GLDM (dark green), GLRLM (light green), GLSZM (blue green), NGTDM (dark blue), Shape (purple) and wavelet filtering (pink).
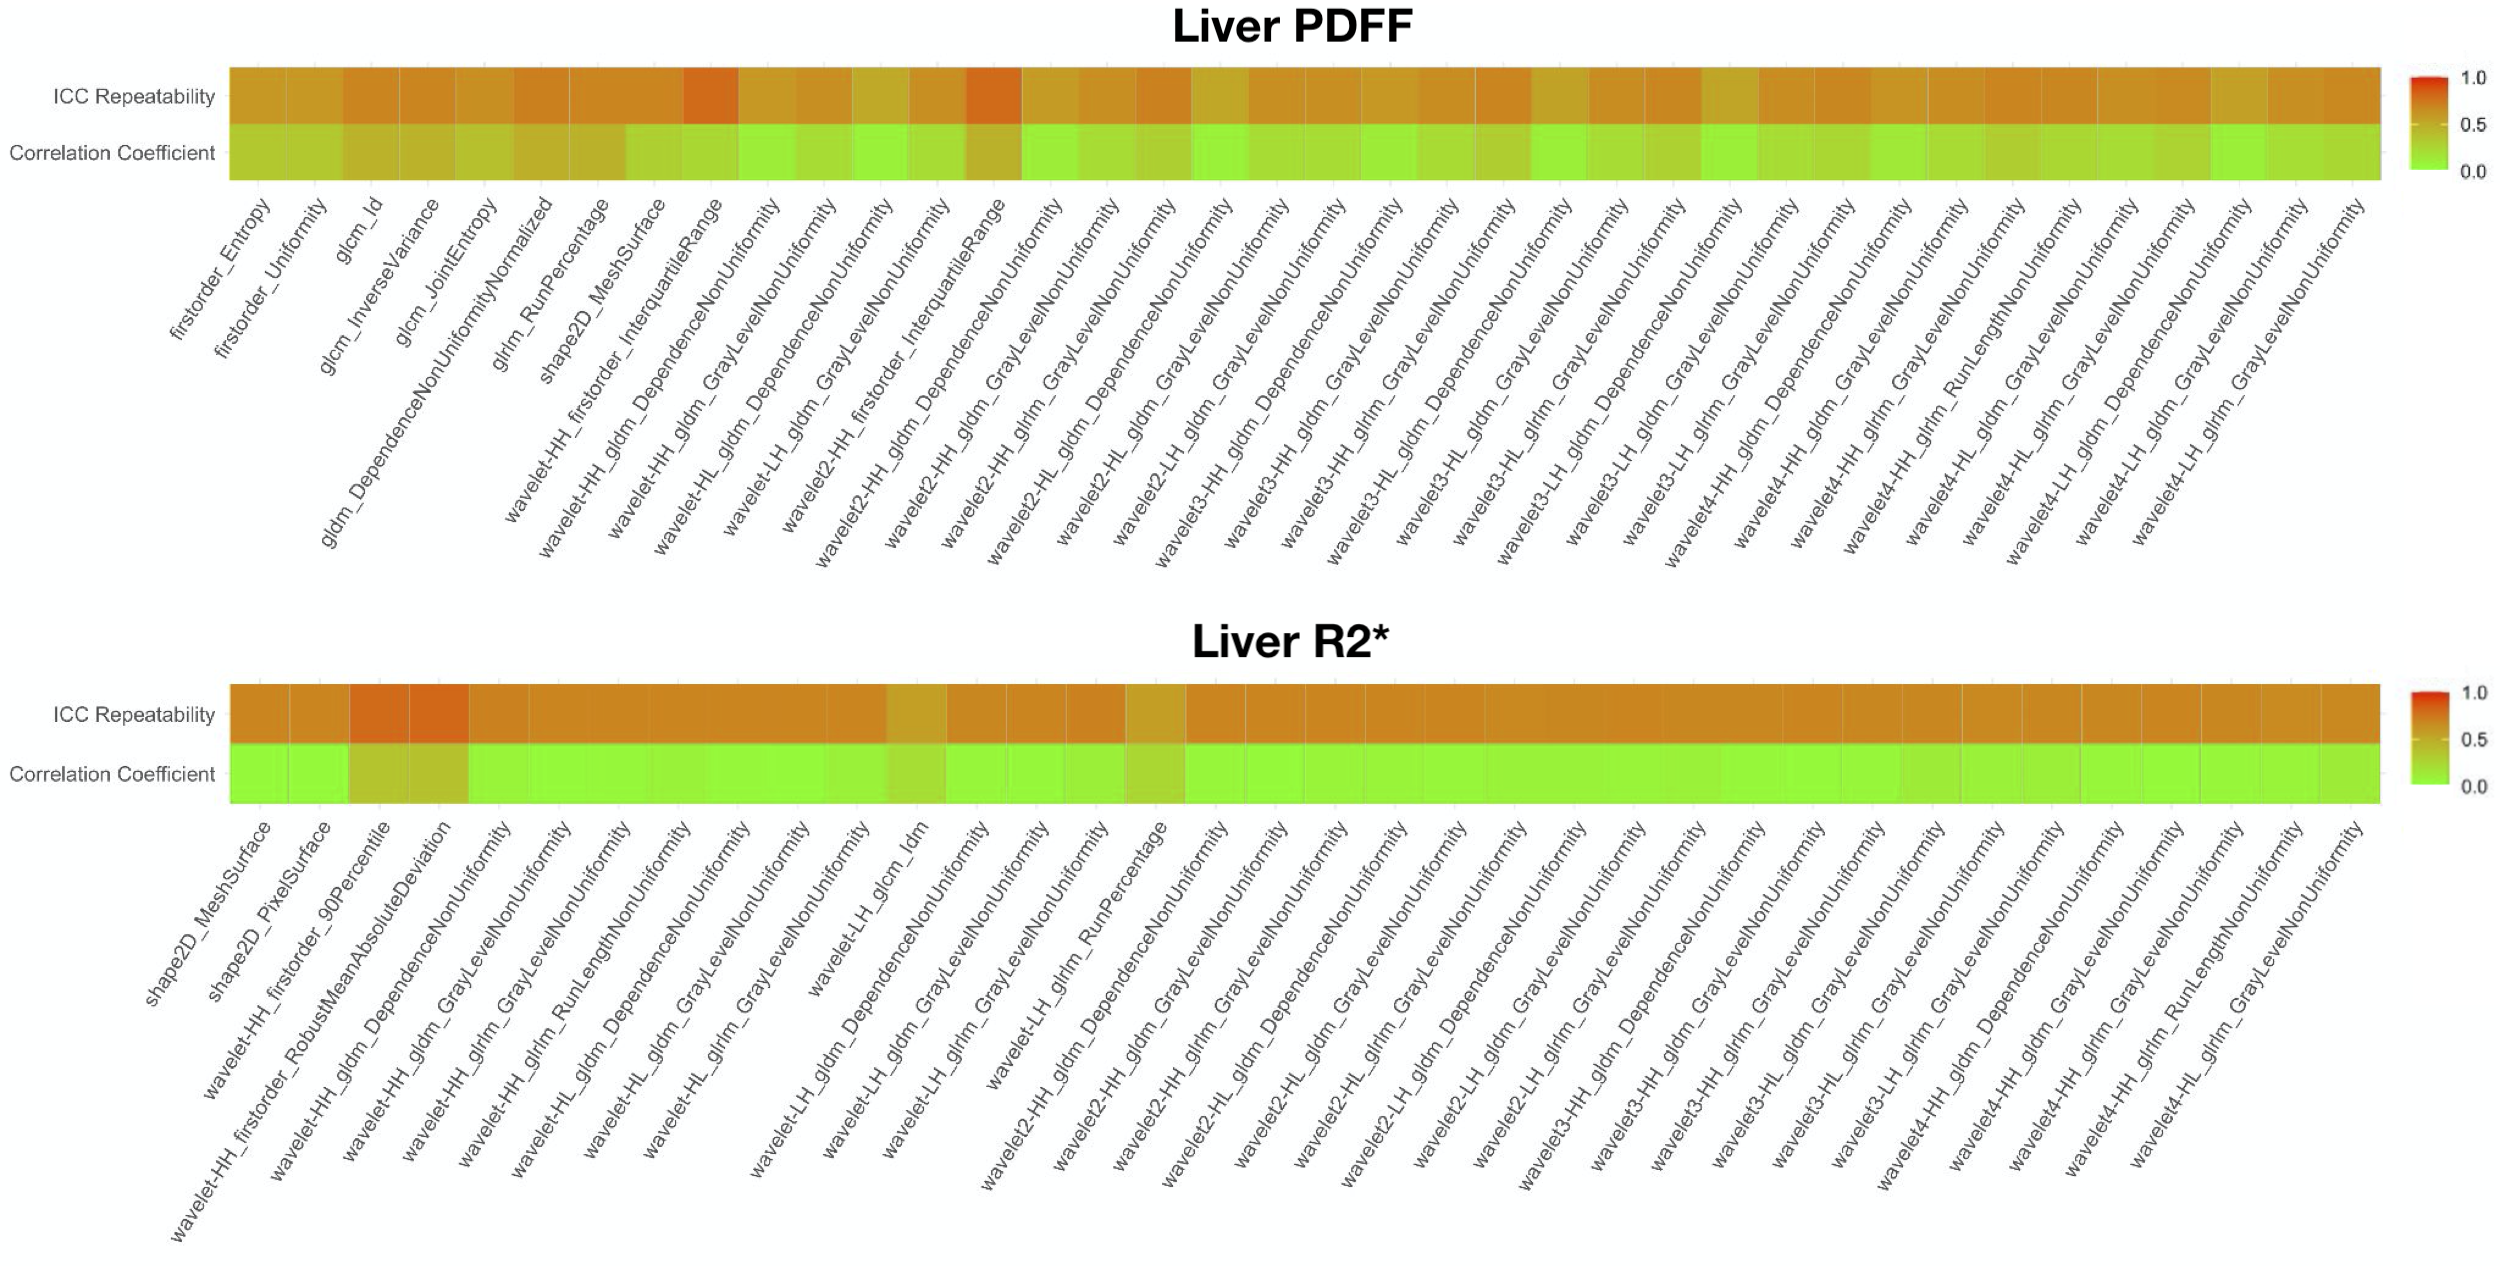
Figure 3. Radiomics feature selected using both ICC for repeatability and correlation coefficients for both liver PDFF (N=38 features, top plot) and R2* (N=36 features, bottom plot). Colour scale from 0 to 1 shows the ICC and absolute values of the correlations for each feature.
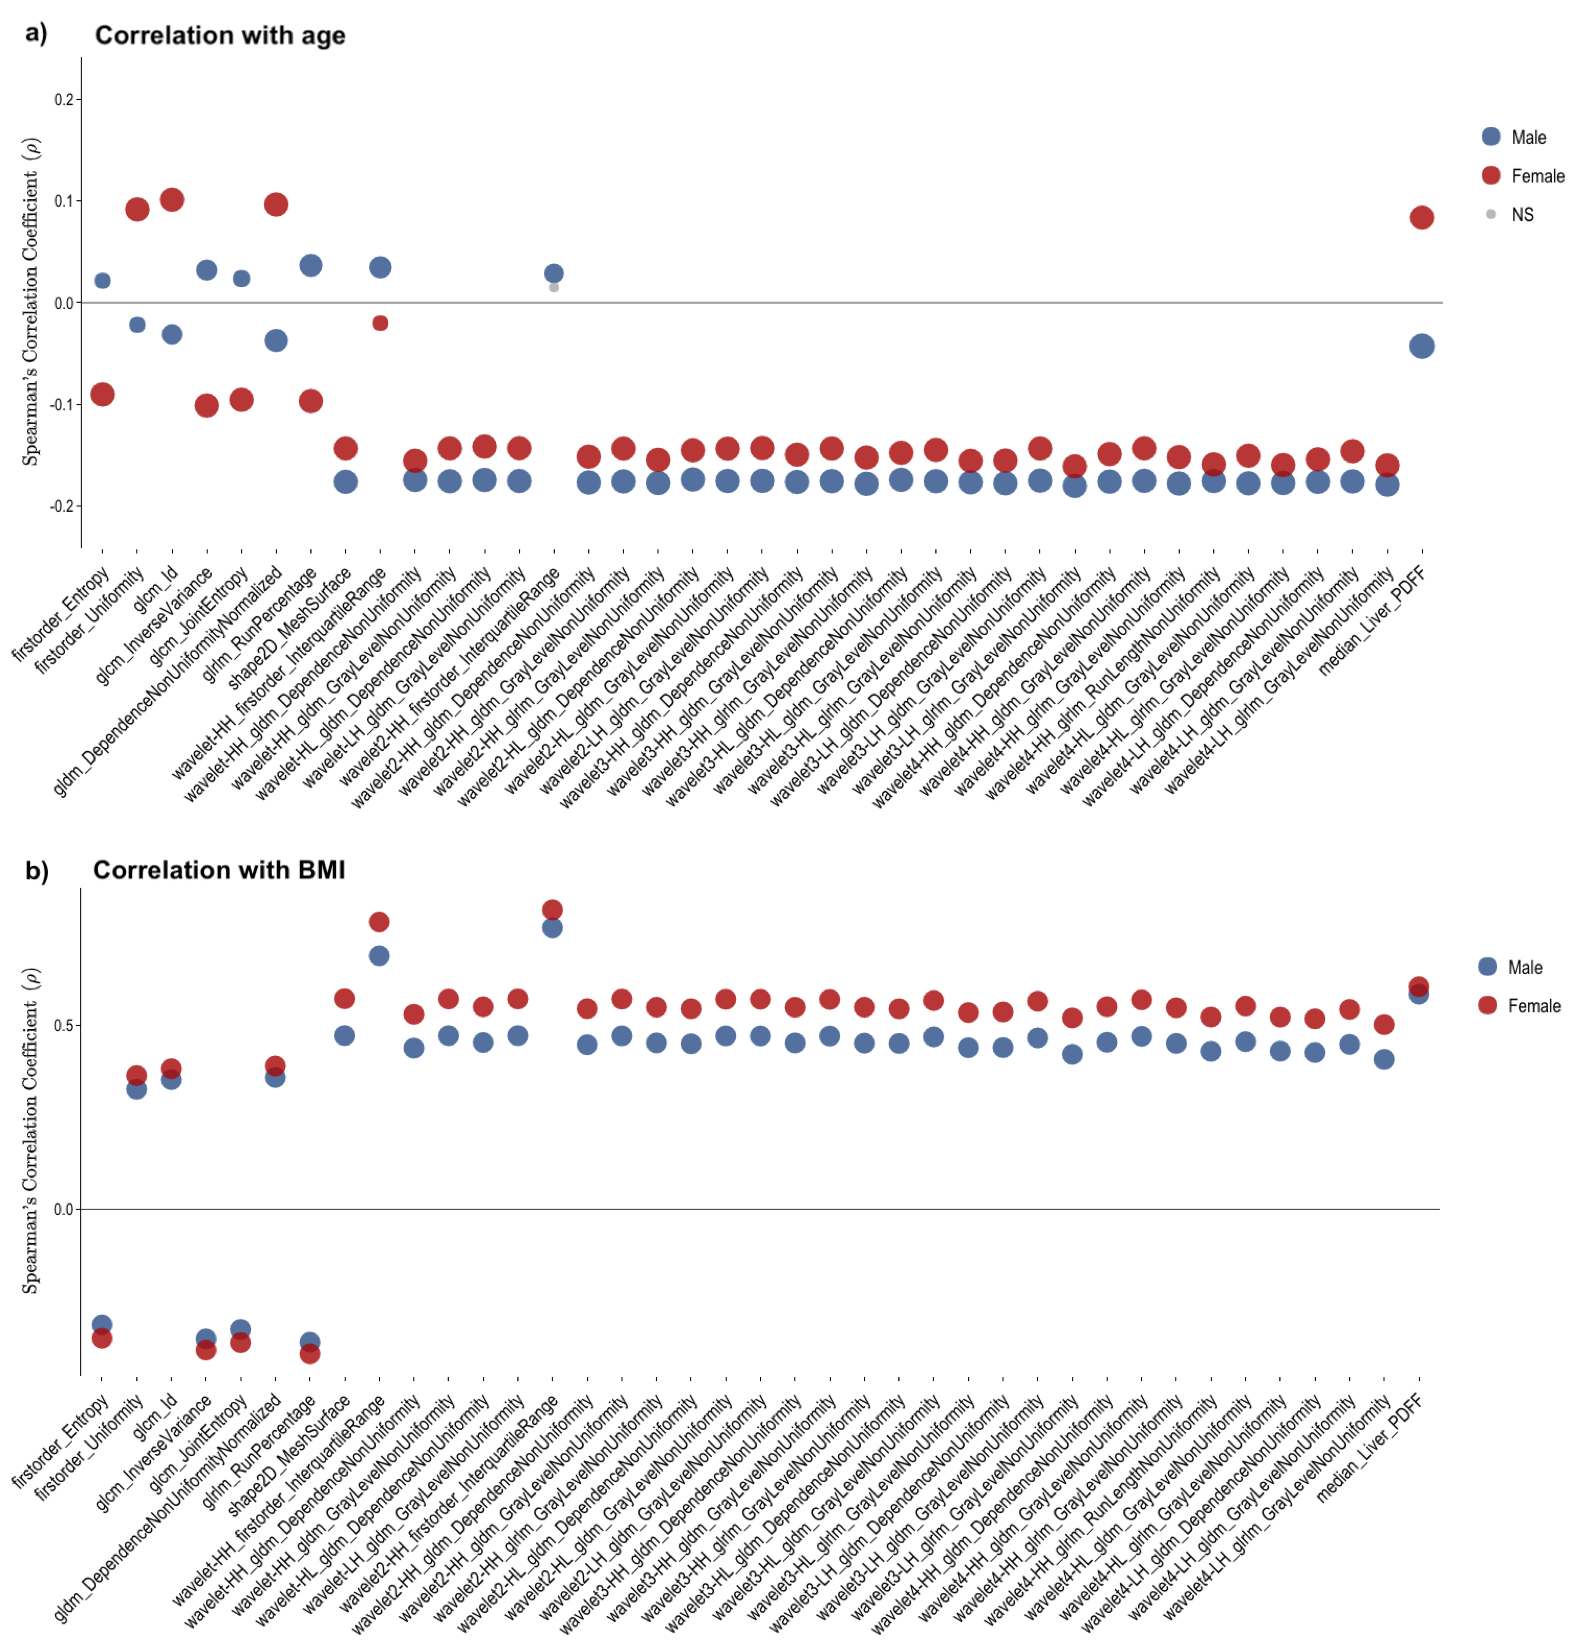
Figure 4. Plot showing the Spearman’s correlation coefficient (ρ) for the 38 radiomic features selected for the liver PDFF, including the median liver PDFF with a) age and b) BMI, for both male (blue) and female (red). The circle size represents the -log10(p-value). Not significant (NS) associations are shown in grey.
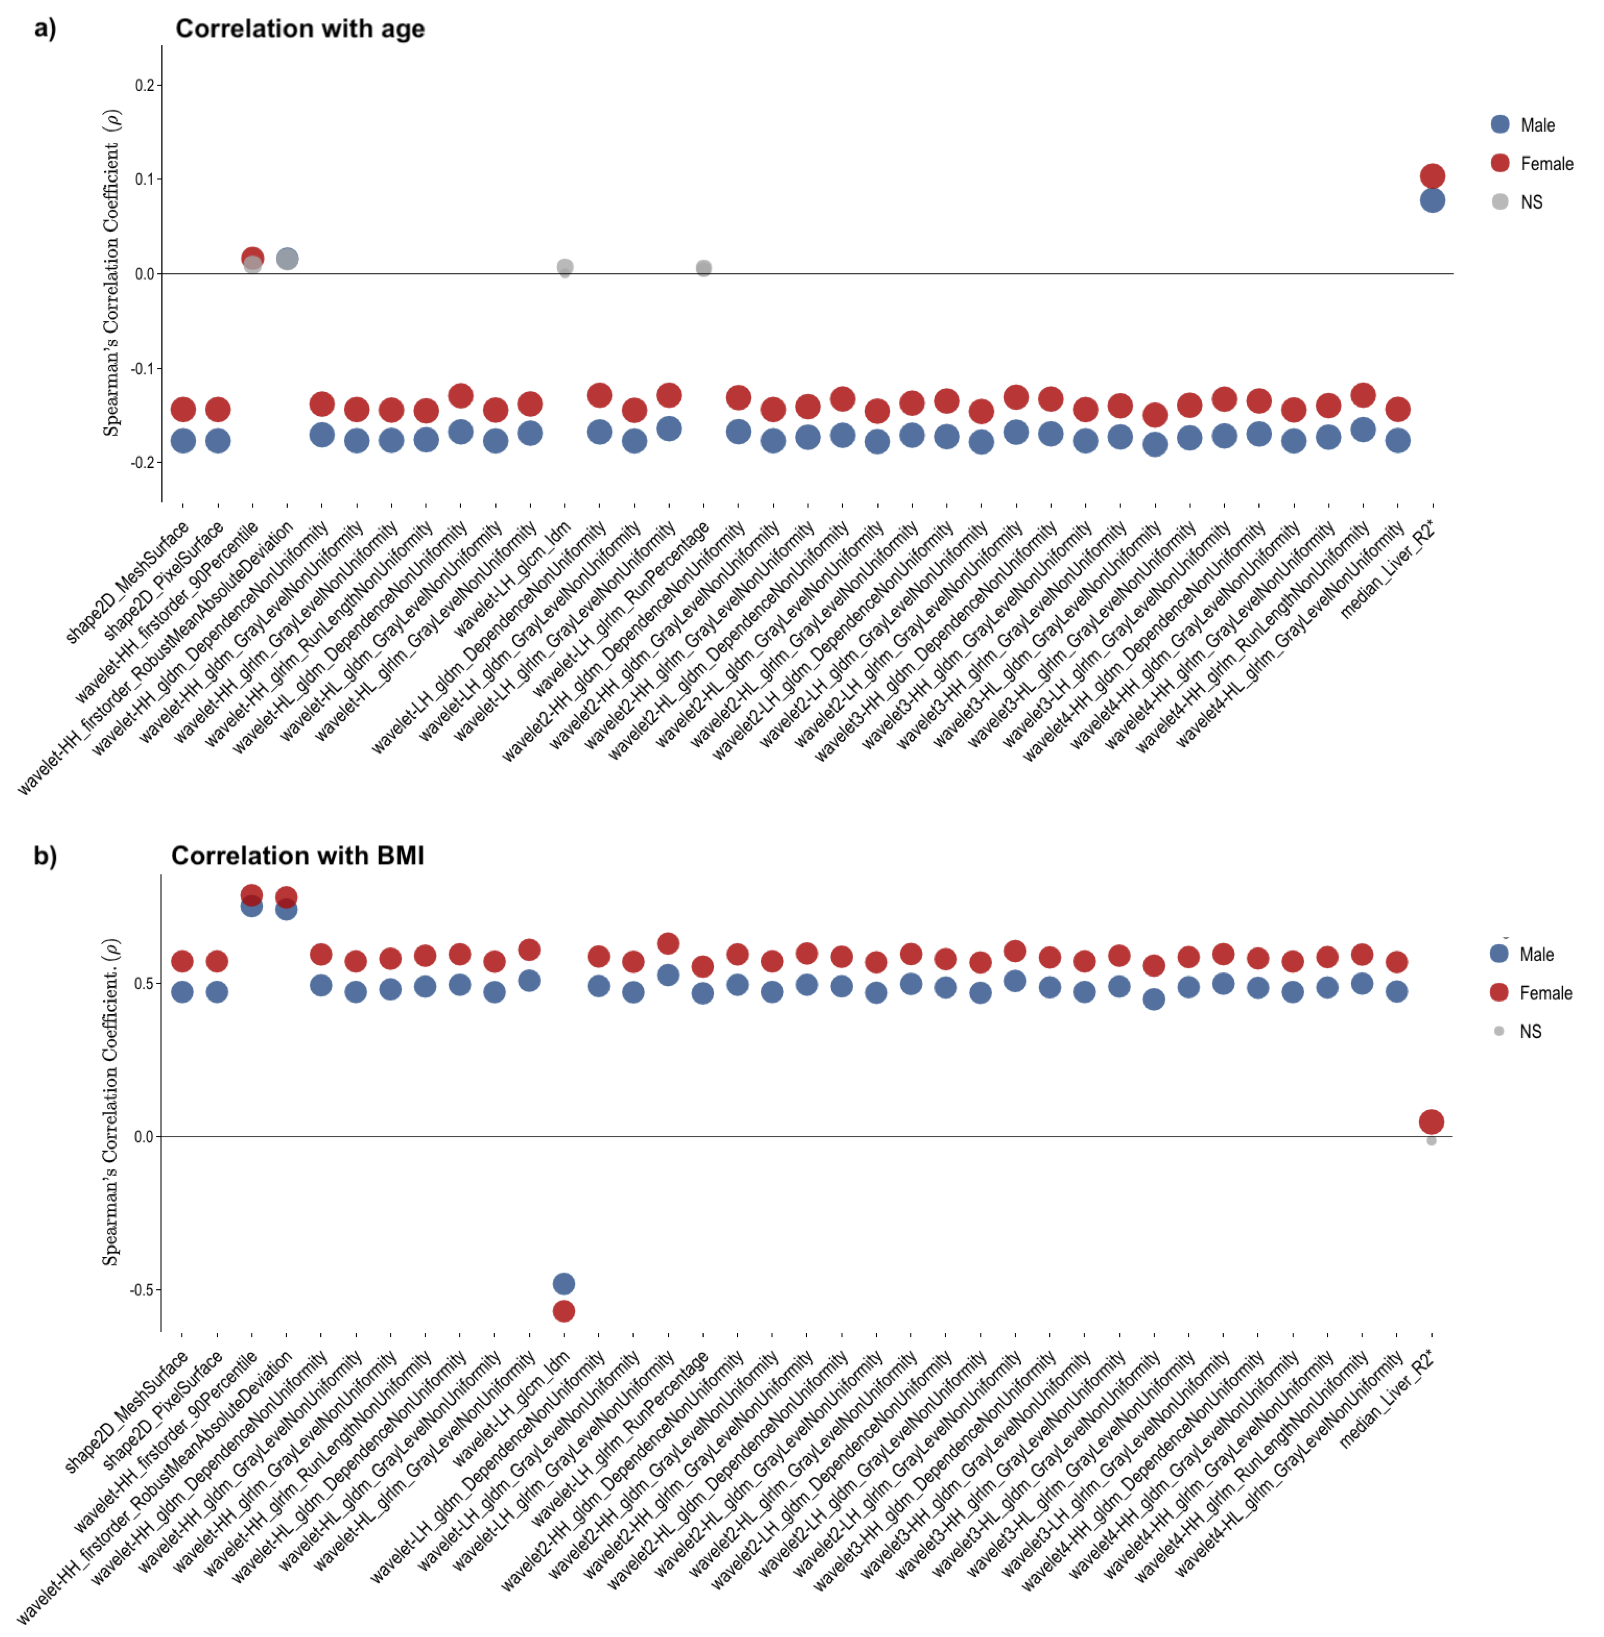
Figure 5. Plot showing the Spearman’s correlation coefficient (ρ) for the 36 radiomic features selected for the liver R2*, including the median liver R2* with a) age and b) BMI, for both male (blue) and female (red). The circle size represents the -log10(p-value). Not significant (NS) associations are shown in grey.
DOI: https://doi.org/10.58530/2023/3152