3151
The feasibility of fat quantification by MRI-PDFF maps for assessing grading of NAFLD
Hongyan Qi1,2, Jianxiu Lian3, Jiang Nan2, Xuan Wang2, and Junqiang Lei2
1First School of Clinical Medicine ,Lanzhou University, Lanzhou, China, 2Department of Radiology, the First Hospital of Lanzhou University, Lanzhou, China, 3Philips Healthcare, Beijin, China
1First School of Clinical Medicine ,Lanzhou University, Lanzhou, China, 2Department of Radiology, the First Hospital of Lanzhou University, Lanzhou, China, 3Philips Healthcare, Beijin, China
Synopsis
Keywords: Liver, Quantitative Imaging, pdff-mapping
Non-alcoholic fatty liver disease (NAFLD) is a serious threat to human health, and the investigation for non-invasive biomarkers to quantify hepatic fat content appears to be crucial. In the study, PDFF was used to quantify liver fat content, assess the grade and degree of hepatic steatosis. PDFF was found to be effective in assessing fat content in NAFLD, which is expected to be used as a biomarker to assess the grading of steatosis in patients with NAFLD.Introduction
Non-alcoholic fatty liver disease (NAFLD) is the most common cause of chronic liver disease worldwide, posing a serious risk to human health and a huge socioeconomic burden(1,2).Although the disease can be improved by lifestyle and exercise, it can also get deterioration to liver fibrosis, cirrhosis, liver cancer and even death. Therefore, early diagnosis of fatty liver is important to inhibit its progression, regression and prognosis. Liver biopsy is a clinical practice for determining fat content with the disadvantages including invasive and risk of infection (3). However, magnetic resonance imaging (MRI) could provide high resolution soft tissue structures even non-invasive biomarkers to quantify liver fat content. Researchers has proved the feasibility of non-invasive magnetic resonance proton density fat fraction (MRI-PDFF) by using mDixon-Quant sequence on evaluation hepatic fat(4,5). The aim of this study is to quantify liver fat content, assess the degree of hepatic steatosis and pathological grading for providing quantitative evidence on clinical treatment, prognosis assessment, and drug efficacy.Methods
Based on clinical and laboratory examinations, patients aged >18 with suspected NAFLD or pre-evaluated NAFLD were enrolled, and MRI scans were performed on 59 patients. All patients were scanned at 3.0T MRI (Ingenia CX, Philips Healthcare, the Netherlands) with 32-element abdominal coil. PDFF values were obtained by mDixon-Quant sequence. Scan parameters for mDixon-Quant sequence as follows :FOV 375×312×201mm,matrix 152×125×67,voxel size 2.5×2.5×6mm,slice thickness 6mm ,Filp angle 3°,TR(repetition time)=5.8ms,TE(echo times)=1.01ms. Post-processing was performed by the software (Intellispace Portal; Version 10.1; Philips Healthcare, Best, the Netherlands). The selection of ROIs was measured in the left outer lobe, left inner lobe, right anterior lobe and right posterior lobe of the liver by a radiologist (with more than 5 years of experience in abdominal diagnosis).While the large vessels, bile ducts and marginal parts of the liver were avoided. All data were analyzed by using SPSS 26.0 (IBM Chicago, USA) software. Quantitative data conforming to normal distribution were described by mean±standard deviation,ANOVA was used for comparison between groups, and SNK-q test for multiple comparisons. Qualitative data were described by rate and composition ratio, and χ2 test for comparison between groups. P<0.05 was considered as statistical difference.Results
59 participants finally included in the analysis, There were 9 in the normal group, 26 in the mild NAFLD group, and 24 in the moderate NAFLD group with mean age 44.59±10.82. Age and gender showed no significant differences while among different groups, but BMI showed higher in the NAFLD group than in the normal group(P<0.001) (Table1). Among all patients, the mean PDFF value was 3.13 ± 1.23 in the normal group, 10.16 ± 2.96 in mild NAFLD, and 20.75 ± 2.12 in moderate NAFLD. There were significant differences not only between the normal and diseased groups, but also between the mild and moderate-(Table2). Figure 1 shows PDFF for different fat contents.Discussion
In our study, we used a parametric MRI-PDFF map to quantify liver fat content, analyzing the degree of hepatic steatosis and grade it to predict the risk of occurrence of NAFLD. PDFF can be used as a non-invasive test to accurately measure liver fat content and to grade patients with NAFLD, which further apply to risk stratification for clinical diagnosis of NAFLD. PDFF value between groups of study subjects made it possible to divide the lesion groups into mild and moderate groups, providing reliable evidence for an objective clinical assessment of the degree of steatosis. In previous studies, Bedogni et al. predicted hepatic steatosis by establishing a fatty liver index (FLI) model(6). Kotronen's team created a liver fat score model (LFS) by combining laboratory tests and clinical manifestations to predict the threshold values for the risk of NAFLD patients(7). Researchers also evaluated the diagnostic efficacy of MRI-PDFF technique in NAFLD in terms of histological findings as a reference standard(8). In the meantime, finding an appropriate threshold between the normal and mild NAFLD groups may prevent the development of fatty liver in the early stages. The shortcoming of this study is that the sample size was insufficient for a single-center study, and patients with severe fatty liver were not collected. In order to further validate the application value of PDFF in fat content determination and degeneration grading, multi-center and large samples should be enrolled.Conclusion
MRI-PDFF map can be used to measure fat content and grade in patients with NAFLD, which can be applied to risk stratification of fat content in clinical diagnosis.Acknowledgements
We thank Prof. Junqiang Lei and Dr. Jianxiu Lian for their guidance and assistance in conducting this study.References
1. Chalasani N, Younossi Z, Lavine JE, Diehl AM, Brunt EM, Cusi K, et al. The diagnosis and management of non-alcoholic fatty liver disease: practice Guideline by the American Association for the Study of Liver Diseases, American College of Gastroenterology, and the American Gastroenterological Association. Hepatology. 2012;55:2005–2023. 2.Younossi ZM, Koenig AB, Abdelatif D, Fazel Y, Henry L, Wymer M. Global pidemiology of nonalcoholic fatty liver disease-Meta-analytic assessment of revalence, incidence, and outcomes. Hepatology. 2016;64:73–84.3. Bannas P, Kramer H, Hernando D, Agni R, Cunningham AM, Mandal R, et al. Quantitative magnetic resonance imaging of hepatic steatosis: Validation in ex vivo human livers. Hepatology 2015;62:1444-55. 4. Artz NS, Haufe WM, Hooker CA, et al. Reproducibility of MR-based liver fat quantification across field strength: same-day comparison between 1.5T and 3T in obese subjects. J Magn Reson Imaging 2015;42(3): 811–817. 5. Zhong X, Nickel MD, Kannengiesser SA, Dale BM, Kiefer B, Bashir MR. Liver fat quantification using a multi-step adaptive fitting approach with multi-echo GRE imaging. Magn Reson Med 2014;72(5):1353–1365. 6. Bedogni G, Bellentani S, Miglioli L, Masutti F, Passalacqua M, Castiglione A, Tiribelli C. The Fatty Liver Index: a simple and accurate predictor of hepatic steatosis in the general population. BMC Gastroenterol. 2006;6:33. 7. Kotronen A, Peltonen M, Hakkarainen A, Sevastianova K, Bergholm R, Johansson LM, Lundbom N, Rissanen A, Ridderstrale M, Groop L, et al. Prediction of non-alcoholic fatty liver disease and liver fat using metabolic and genetic factors. Gastroenterology. 2009;137(3):865–72. 8.Tang A, Desai A, Hamilton G, et al. Accuracy of MR imaging– estimated proton density fat fraction for classifification of dichotomized histologic steatosis grades in nonalcoholic fatty liver disease. Radiology. 2015;274:416–425.Figures
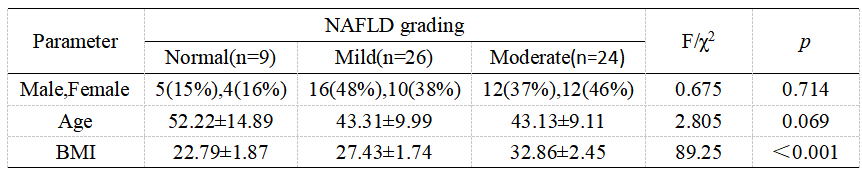
Table 1 Baseline Characteristics
BMI, body mass index
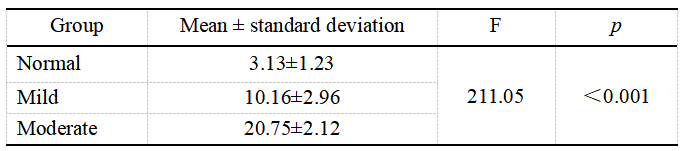
Table2 Comparison of PDFF of different groups
MRI-PDFF, magnetic resonance imaging–estimated proton density fat fraction
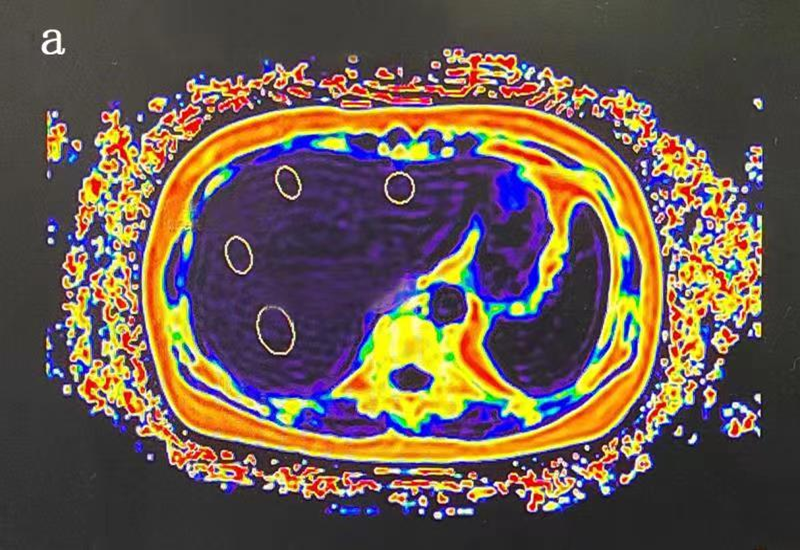
Figure1: PDFF
plots for different groupings was shown. a-c were PDFF plots . a was
for normal patients, b was for mild fatty liver
and c was for moderate fatty liver.
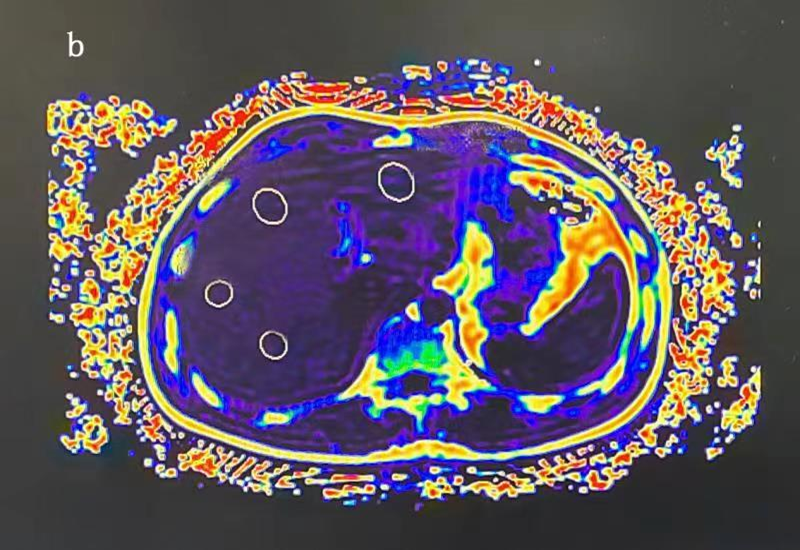
Figure1: PDFF
plots for different groupings was shown. a-c were PDFF plots . a was
for normal patients, b was for mild fatty liver
and c was for moderate fatty liver.
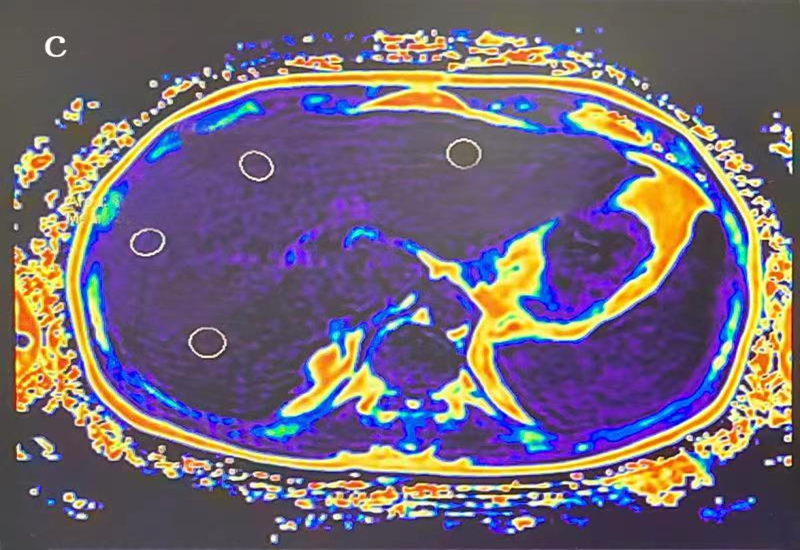
Figure1: PDFF
plots for different groupings was shown. a-c were PDFF plots . a was
for normal patients, b was for mild fatty liver
and c was for moderate fatty liver.
DOI: https://doi.org/10.58530/2023/3151