3149
Efficacy of Perirenal Fat and Intra-organ Fat in differentiation Metabolic Syndrome from Adults with Overweight and Obesity of Suspected NAFLD1Department of Radiology, Ningbo First Hospital, Ningbo, China, 2Siemens healthineers, Shanghai, China
Synopsis
Keywords: Liver, Fat
This study investigated the fat quantitative Q-DIXON sequence to evaluate intra-organ fat content and visceral adipose tissue (VAT) to find the association with metabolic syndrome (MetS) in adults with overweight and obesity suspected with NAFLD.
The results showed that the cut-off level of 9.15mm of perirenal fat thickness (PRFT) and 14.68% of liver fat fraction (LFF) can effectively predict MetS, and the combination of PRFT and LFF predict MetS better. Moreover, ectopic fat levels in pancreas and lumbar spines are positively associated with PRFT.
Introduction/Purpose:
Nonalcoholic fatty liver disease (NAFLD) has a multidirectional relationship with metabolic syndrome (MetS), and used to be considered a hepatic manifestation of MetS[1]. Perirenal fat as a part of visceral adipose tissue (VAT), was reported correlated with MetS components[2-4], but data with intra-organ fat are lacking. Limitations of US and CT to evaluate liver fat content was subjective and semiquantitative. Recently, a novel technique was proposed for fat quantitative, proton density fat fraction (MRI-PDFF), has a higher degree of precision and reproducibility[5], and take a short time within 1 min. Our study aimed to (1) investigate the utility of Q-DIXON sequence for quantifying the fat content of different organs; (2) identify MetS in overweight and obesity with suspected NAFLD adults through the association of perirenal fat thickness (PRFT) and intra-organ fat.Method:
We investigated 134 patients (63 female) with body mass index (BMI)≥25 kg/m2 being suspected with NAFLD on the basis of clinical, laboratory and USG findings. BMI ranged from 25.1 to 47.5 kg/m2. Criteria for inclusion were: (1) age ≥18 years; (2) evidence of absent or minimal alcohol consumption: <20 g alcohol/day for women and <30 g alcohol/day for men; (3) absence of confounding disease including acute and/or chronic viral hepatitis (hepatitis A, B, or C); and (4) exclusion of other forms of liver disease including autoimmune, drug-induced, cholestatic and metabolic liver diseases, as well as big liver cyst and hemangioma. The study passed the Hospital Ethics Council and all patients signed informed consent. All participants underwent abdominal MRI examination including volume interpolated breath-hold examination (VIBE-Dixon) sequence and Q-DIXON sequence by MAGNETOM Vida 3 T MRI scanner (Siemens Healthcare, Erlangen, Germany). The parameters of Q-DIXON sequence were TR = 9 ms; TE = 1.05, 2.46, 3.69, 4.92, 6.15, and 7.38 ms; thickness = 3mm; FOV = 420 mm; voxel size =1.3 mm × 1.3 mm × 3 mm; flip angle = 4°; and averages =1; acquisition time=15 sec. Anthropometric, metabolic parameters and PRFT, subcutaneous adipose tissue thickness (SATT), liver fat fraction (LFF), pancreas fat fraction (PFF), and lumbar spines fat fraction (LSFF) were collected. Patients were devided into group MetS+ and MetS- according the international Diabetes Federation (IDF) criteria. To assess the relationship between imaging parameters and two different types of patients, basic statistics, linear correlation and logistic regression analysis were analysied. The sensitivity and specificity of parameters to predict MetS were assessed using receiver operating characteristic (ROC) curve analysis. The correlation between PRFT, intra-organ fat content and metabolic parameters was assessed with a Spearman test. A p<0.05 was considered statistically significant. (SPSS version 25.0, Chicago, IL, USA)Result:
Patients with MetS had greater PRFT, LFF, and higher proportion of advanced steatosis (Grades 2 and 3) compared to those without (P=0.026, P<0.001, P< 0.001, respectively), as well as greater homeostasis model assessment of insulin resistance (HOMA-IR), alanine transaminase (ALT), aspartate transaminase (AST), and decreased SATT. The detail results are shown in Table 1. Figure 1 shows an example from a patient. PRFT was positively correlated with age, BMI, waist circumference (WC), ALT, uric acid, fasting insulin, triglyceride, PFF and LSFF, and negatively correlated with SATT and high-density lipoprotein (HDL). PRFT and LFF were independent predictors of MetS after adjusted for age and gender. The areas under the ROC curve (AUC) for PRFT and LFF for predicting MetS were 0.610 and 0.679 with the cut-off level of 9.15mm and 14.68% respectively (Figure 2). Moreover, the combination of PRFT and LFF predict MetS better with sensitivity of 84.1%, specificity 46.5%, AUC=0.70 (p<0.001).Discussion:
This was a preliminary feasibility study of fat quantitative of different organs to evaluate the predictive value of MetS. The results suggest that the PRFT and LFF both can be used to predict MetS. LFF was superior to PRFT in predicting the presence of MetS, furthermore the combination of PRFT and LFF predict MetS best. The correlation analysis revealed positively correlation between PRFT and ectopic fat levels in pancreas and lumbar spines, however, no significant correlation was found between PRFT and LFF. Further research of large sample size is needed to examine correlations between excessive fat depots and ectopic fat depots to find the organs vulnerable to MetS.Conclusion:
This study shows that the absolute cut-off level of 9.15mm of PRFT and 14.68% of LFF may be a clinically important marker for identifying patients who are at high risk of MetS in adults with overweight and obesity of suspected NAFLD, irrespective of gender and age. Moreover, it suggests that, ectopic fat levels in pancreas and lumbar spines are positively associated with PRFT.Acknowledgements

References
[1] Angelico F, Del B M, Conti R, et al. Non-alcoholic fatty liver syndrome: a hepatic consequence of common metabolic diseases[J]. J Gastroenterol Hepatol, 2003,18(5):588-594. [2] Roever L, Resende E S, Veloso F C, et al. Perirenal Fat and Association with Metabolic Risk Factors: The Uberlândia Heart Study[J]. Medicine (Baltimore), 2015,94(38): e1105. [3] Cuatrecasas G, de Cabo F, Coves M J, et al. Ultrasound measures of abdominal fat layers correlate with metabolic syndrome features in patients with obesity[J]. Obes Sci Pract, 2020,6(6):660-667. [4] Pimanov S, Bondarenko V, Makarenko E. Visceral fat in different locations assessed by ultrasound: Correlation with computed tomography and cut-off values in patients with metabolic syndrome[J]. Clin Obes, 2020,10(6): e12404. [5] Fitzpatrick E, Dhawan A. Noninvasive biomarkers in non-alcoholic fatty liver disease: current status and a glimpse of the future[J]. World J Gastroenterol, 2014,20(31):10851-10863.Figures
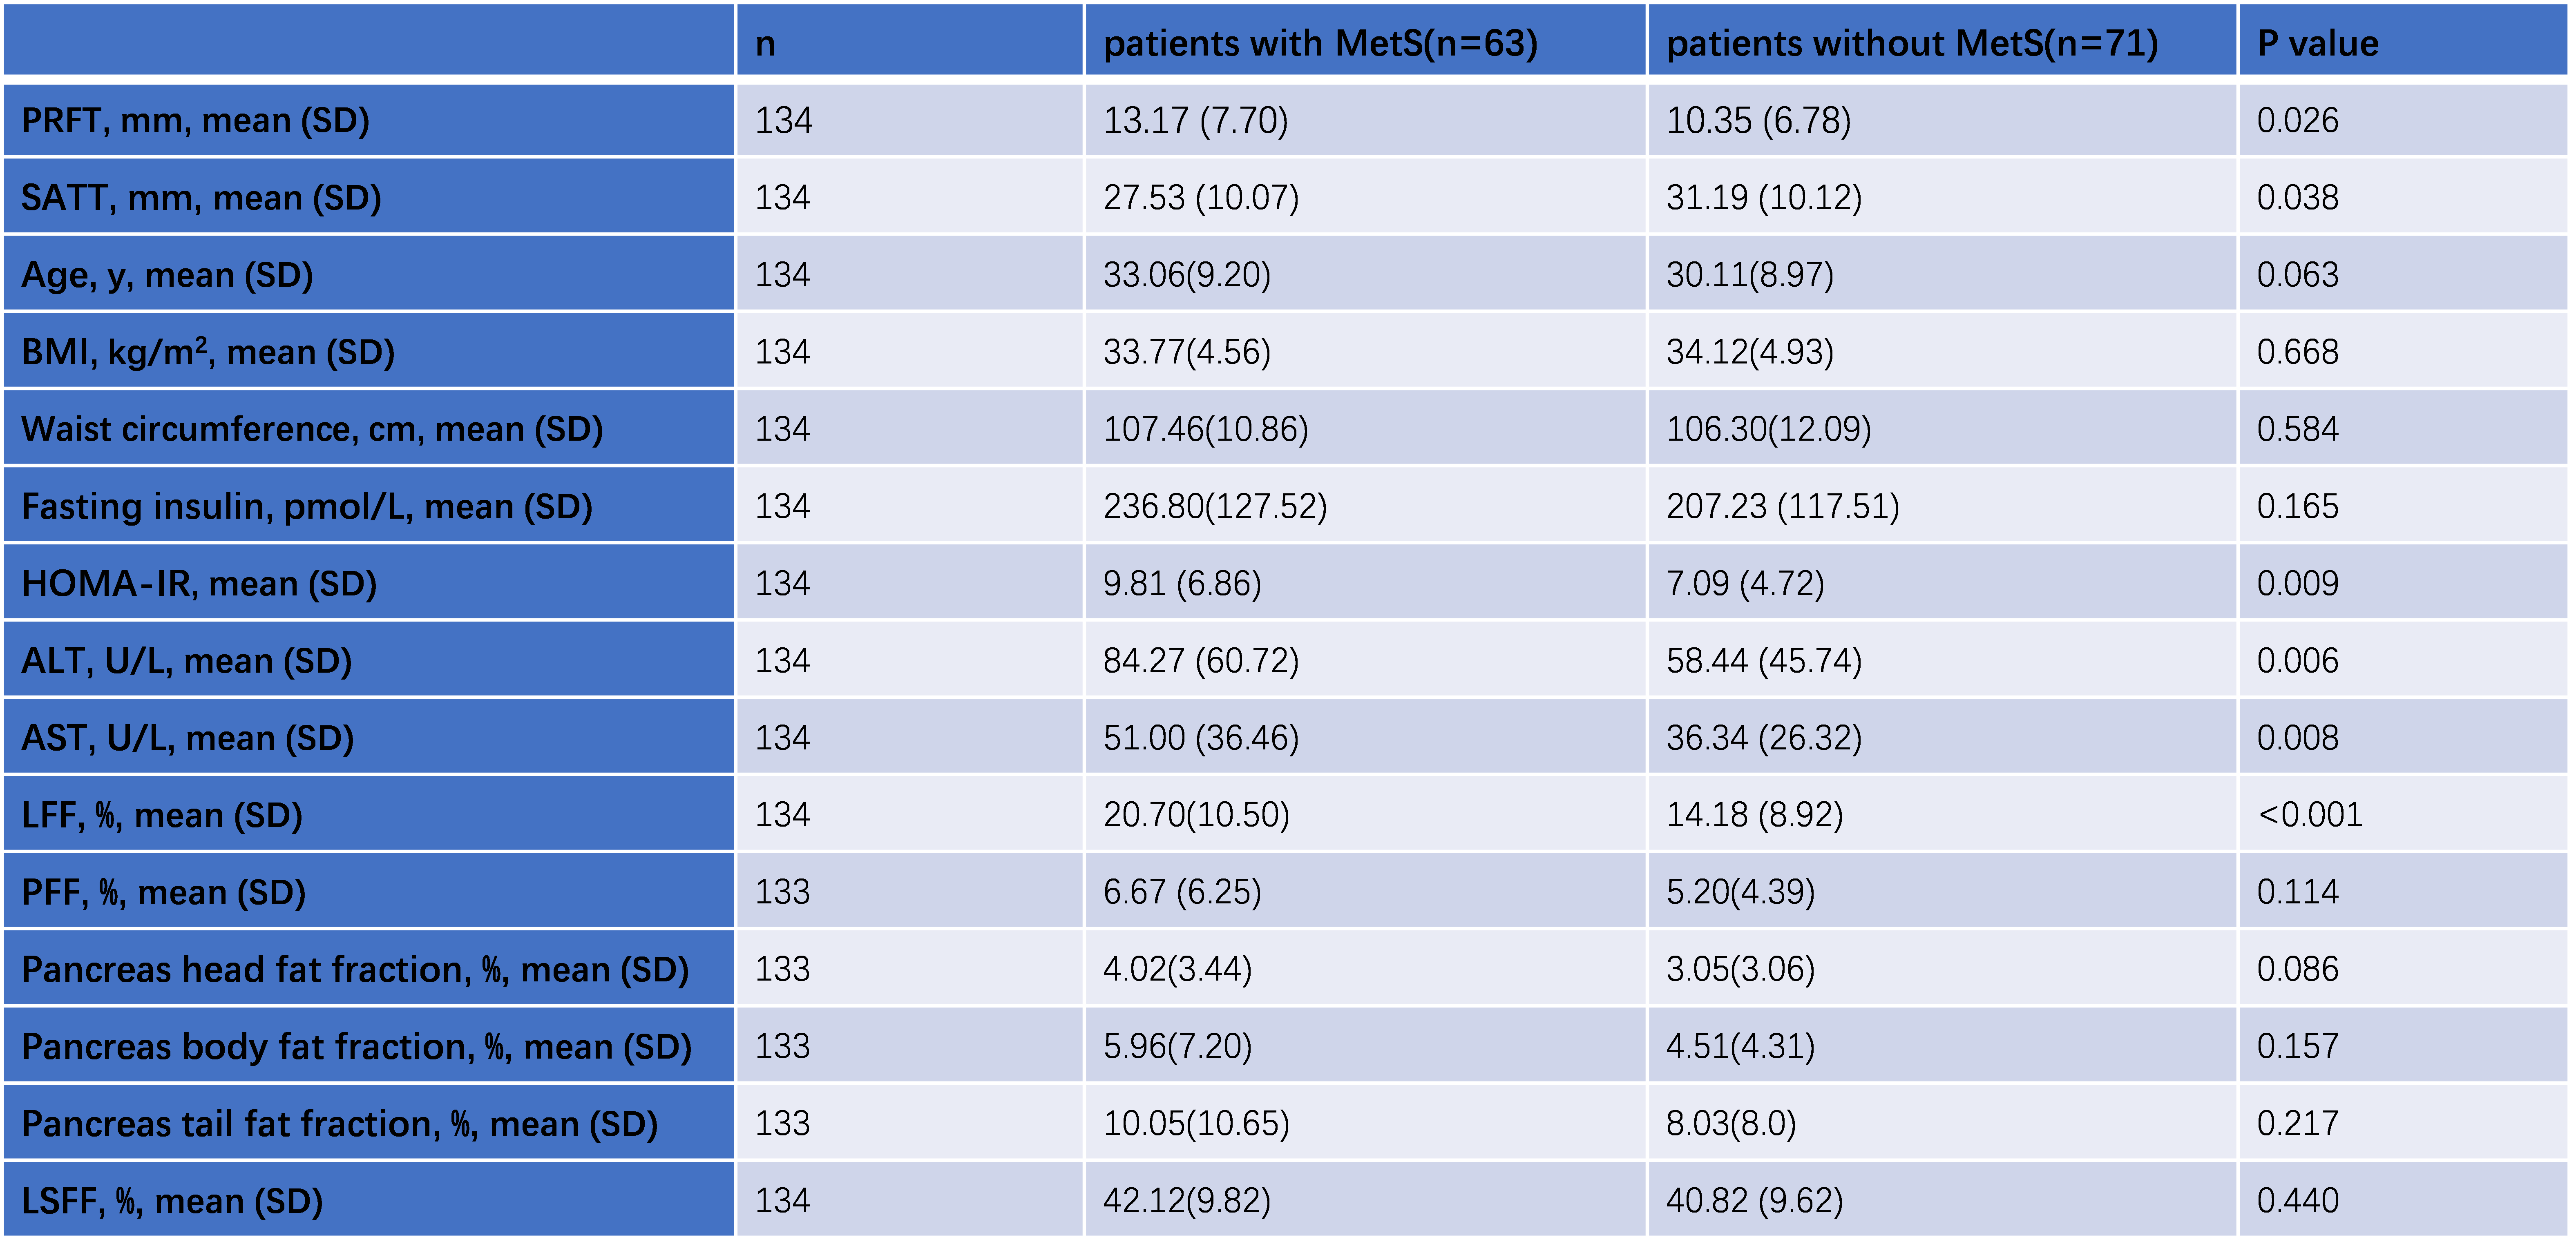
Table 1. Clinical and biochemical characteristics and ectopic fat depots according to MetS
PRFT, perirenal fat thickness; SATT, subcutaneous adipose tissue thickness; BMI, body mass index; HOMA-IR, homeostasis model assessment of insulin resistance; ALT, alanine transaminase; AST, aspartate transaminase; LFF, liver fat fraction; PFF, Pancreas fat fraction; LSFF, lumbar spine fat fraction; MetS, metabolic syndrome.
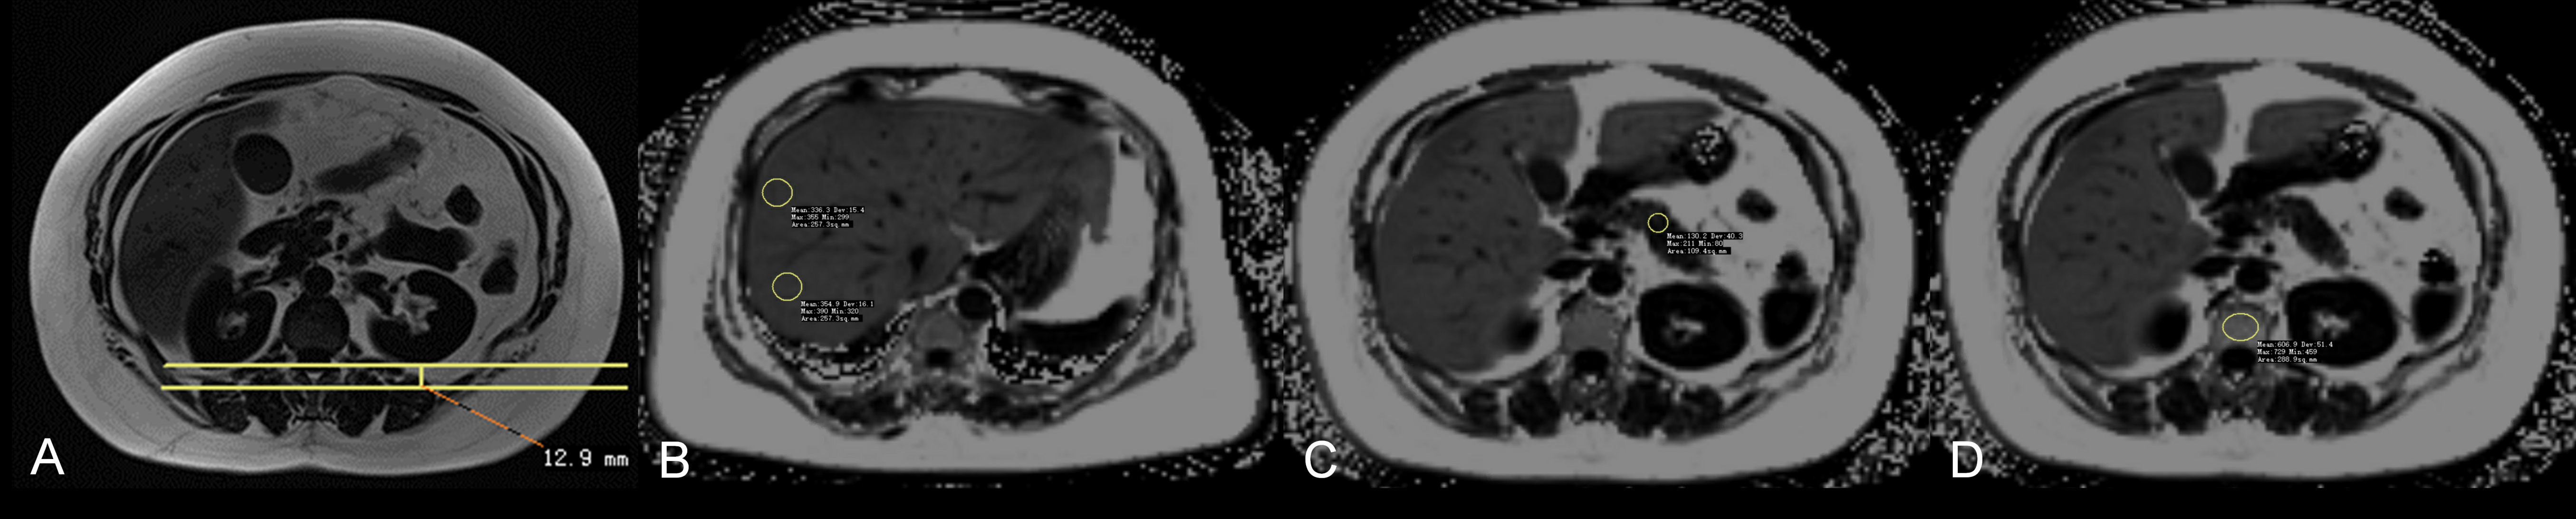
Figure 1. Measurement of PRFT, LFF, PFF and LSFF on MRI map. (A) The PRFT of a patient with MetS. (B) The two ROIs in hepatic segments Ⅶ-Ⅷ; (C) ROI in the pancreas body; (D) ROI in L1 vertebral body. LFF was calculated by averaging the results of 8 round ROIs in each of the hepatic segments; PFF was calculated by averaging the results of three ROIs on the head, body and tail of the pancreas; LSFF measurements were performed by averaging the results of two ROIs on L1-2.
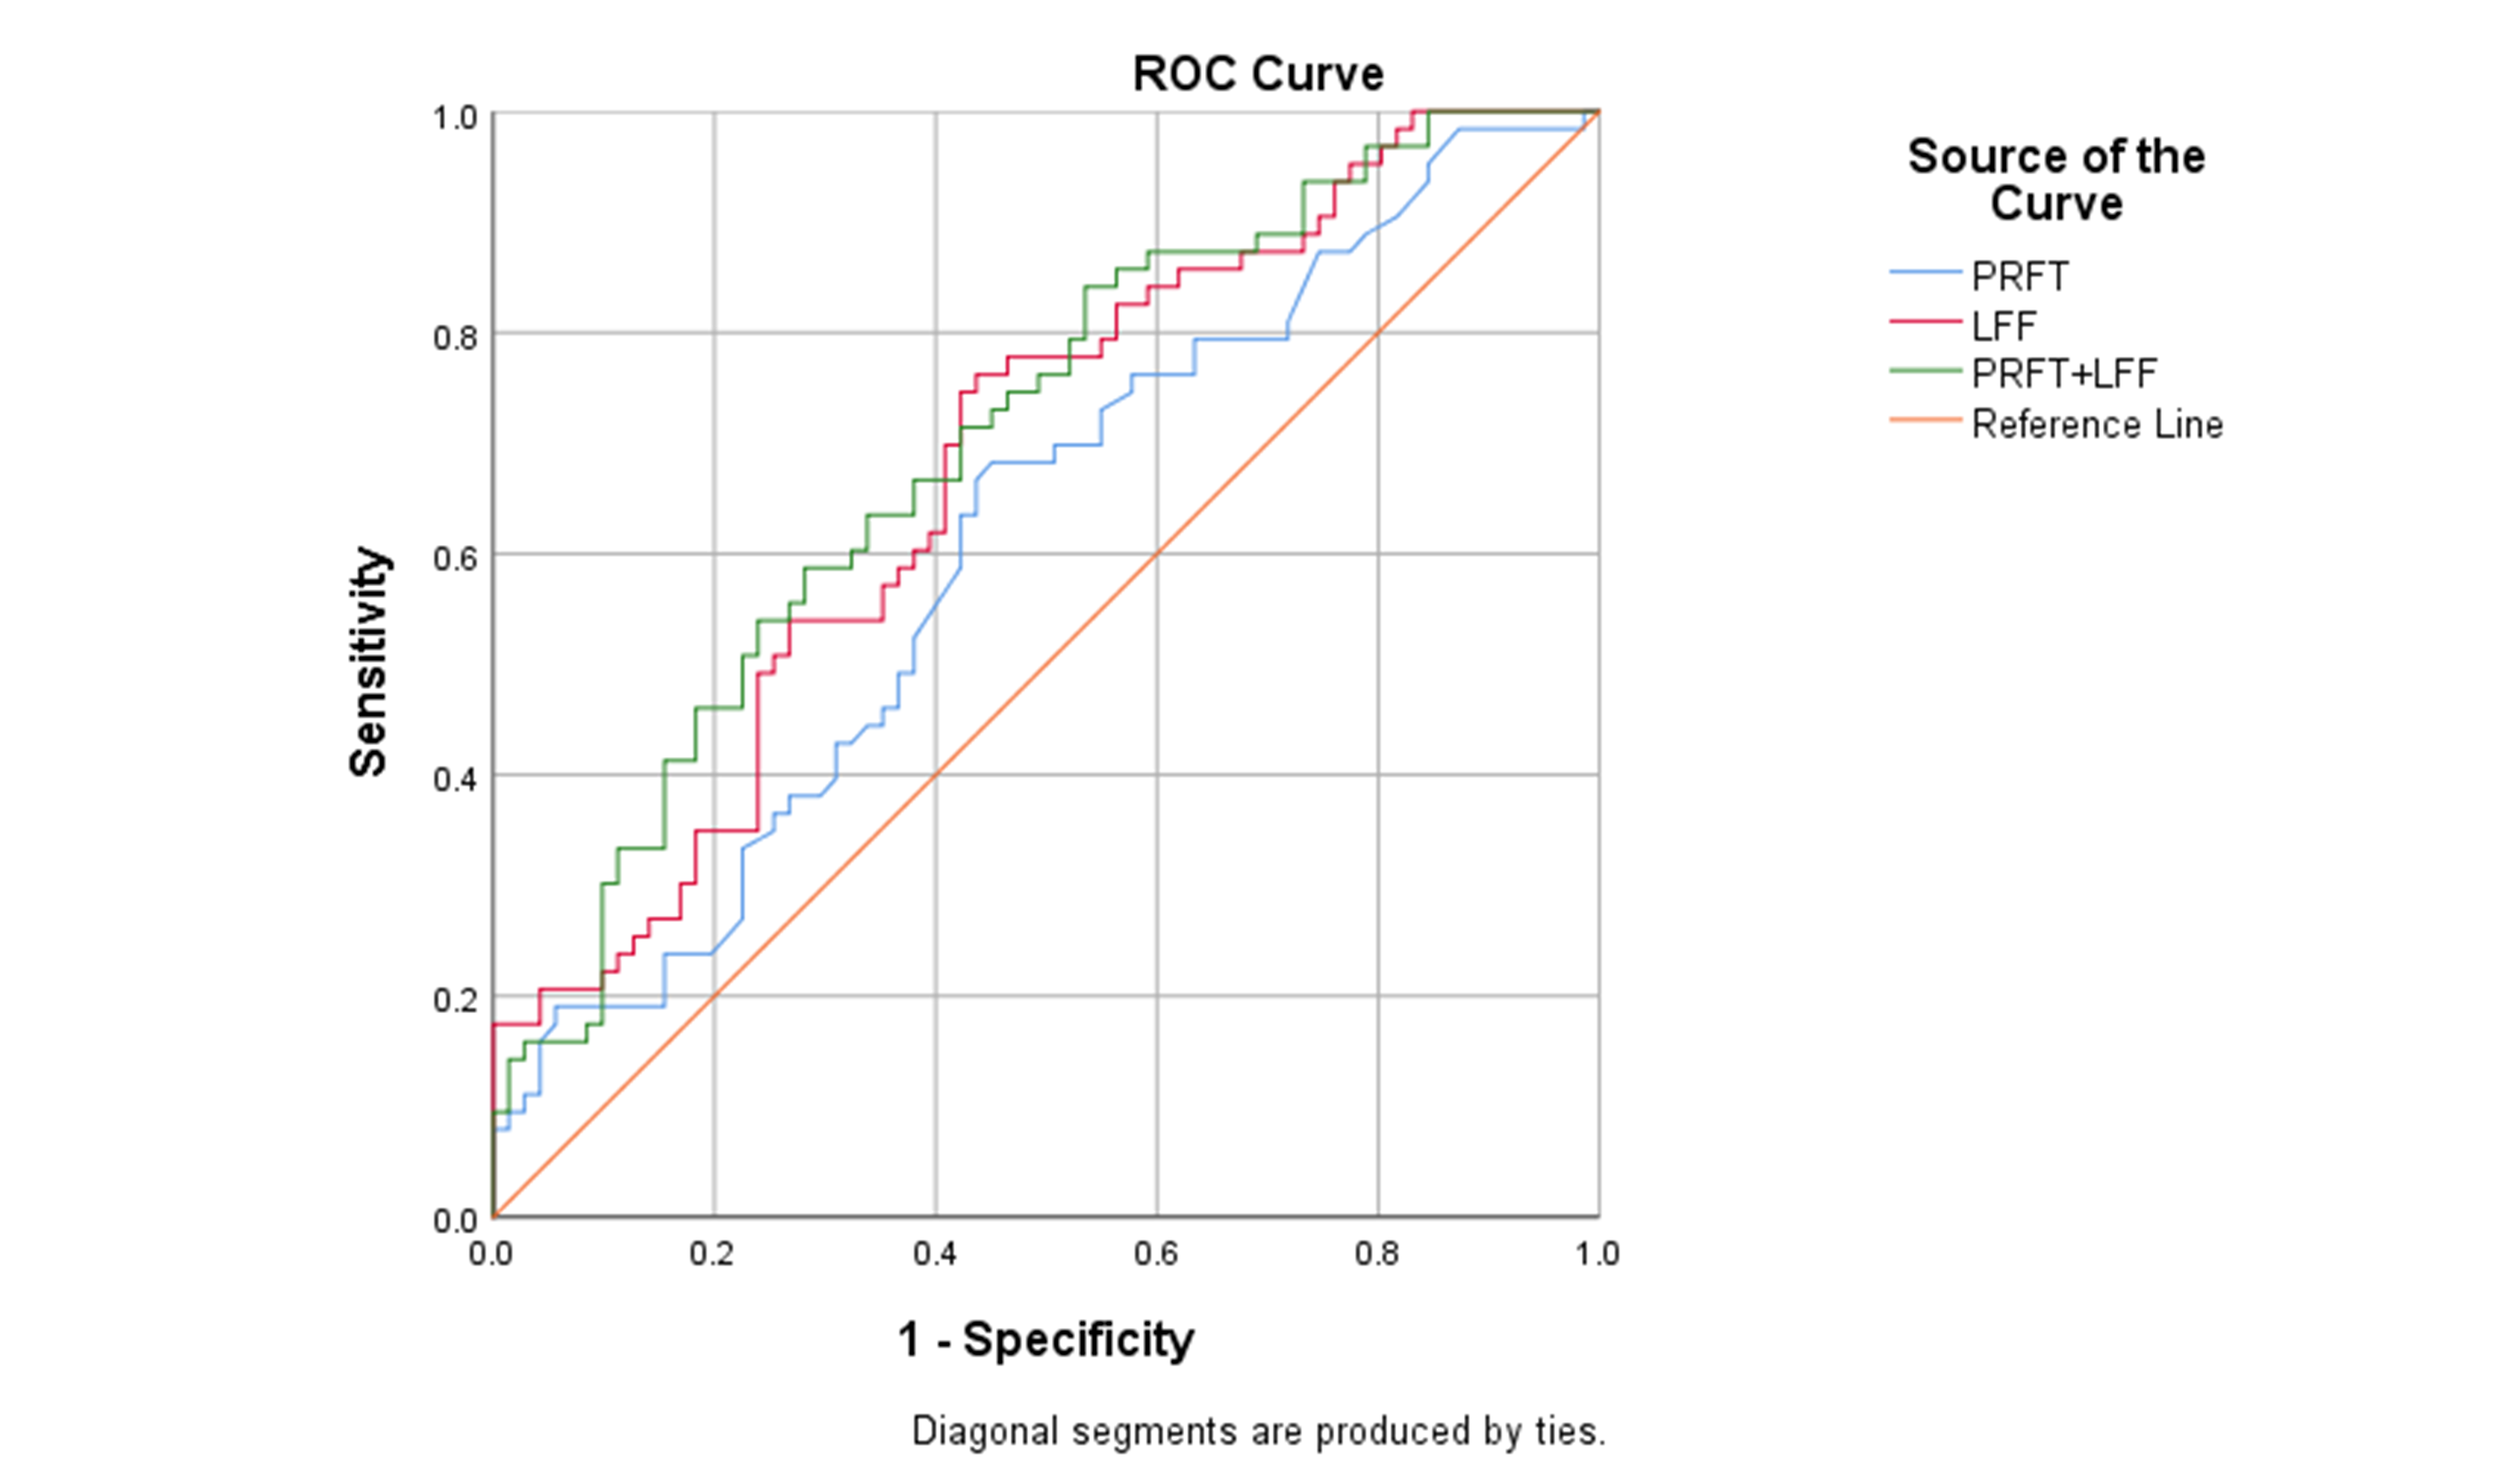
Figure 2 ROC curves for perirenal fat thickness, liver fat fraction and the combination of them. y sensibility x 1-specificity. Perirenal fat thickness and liver fat fraction as predicting value for metabolic syndrome.