3147
Preliminary Experience of 5.0 Tesla Higher Field Abdominal DWI: Agreement of Apparent Diffusion Coefficient With 3.0 Tesla Imaging
Yunfei Zhang1, Yongming Dai2, and Mengsu Zeng3
1MR Collaboration, Central Research Institute, United Imaging Healthcare, Shanghai, China, 2MR Collaboration, Central Research Institute, United Imaging Healthcare, Shanghai, China, 3Zhongshan Hospital of Fudan University, Shanghai, China
1MR Collaboration, Central Research Institute, United Imaging Healthcare, Shanghai, China, 2MR Collaboration, Central Research Institute, United Imaging Healthcare, Shanghai, China, 3Zhongshan Hospital of Fudan University, Shanghai, China
Synopsis
Keywords: New Devices, Diffusion/other diffusion imaging techniques
Recently, the 5.0 T whole-body MRI scanner was developed. This study aims to evaluate the feasibility of 5.0 T high field DWI and assess the agreement of the apparent diffusion coefficient (ADC) with that from 3.0 T DWI. The results showed that 5.0 T DWI displayed an increase in subjective image quality score. Both the inter-field and inter-observer agreements of ADC values were substantial to excellent. The substantial to excellent agreements between the ADC values measured with 3.0 T and 5.0 T DWI for liver, pancreas, spleen and kidney suggested that 5.0 T DWI can be applied for abdominal imaging.Introduction
The clinical potential of Diffusion Weighted-MRI (DWI) is challenged by the following issues: 1) DWI is prone to susceptibility artifacts, eddy current effects, image distortion and ghosting; 2) Signal to noise ratio (SNR) of SE-EPI based DWI is limited, especially at high b values; 3) SNR-related issues result in the difficulty in accessing high-resolution DWI and 4) Striking a satisfactory balance among the acquisition time, sufficient SNR and imaging resolution is difficult. High field MRI may be useful in addressing these issues.At 7.0 T, MRI is currently mainly restricted to the head and extremities due to technical challenges containing the field inhomogeneity, high specific absorption ratio (SAR) for certain sequences, fast decay rate of transverse magnetization and artifacts (1-3). Consequently, 7.0 T MRI may not contribute to yielding enough extra clinical gain for abdominal imaging. Recently, a 5.0 T whole-body MRI scanner was developed, which may provide advantages for abdominal DWI.
The apparent diffusion coefficient (ADC) derived from routine DWI examination is an important image marker in clinical application. Before abdominal DWI is performed at 5.0 T, the agreement between the ADC values of 3.0 T and 5.0 T DWI should likewise be determined.
The aim of this study was to examine the inter-field agreement between the ADC values for abdominal organs including liver, pancreas, spleen and kidney at 3.0 T and 5.0 T.
Methods
A total of nine volunteer were included in this study. Each subject underwent DWI at both 3.0 T and 5.0 T with a 3.0 T scanner (uMR 780, United Imaging Healthcare Co Ltd) and a 5.0 T scanner (uMR Jupiter, United Imaging Healthcare Co Ltd). The detailed imaging parameters of 5.0 T DWI were as follows: repetition time (TR): ~5302.0 ms (influenced by the respiratory cycle), echo time (TE): 48.2 ms, flip angle: 90°, field of view: 300×380 mm2, scanning matrix: 101×128, reconstruction matrix: 202×256, slice thickness: 6 mm, inter-slice gap: 20%, b values: 0 s/mm2 (2 averages) and 800 s/mm2 (6 averages). The imaging parameters of 3.0 T DWI were identical. The subjective image quality of 3.0 T DWI and 5.0 T DWI were independently scored with the 5-point scoring system. For each subject, a total of 12 paired ROIs (3 in liver, 3 in pancreas, 3 in spleen and 3 in kidney) were defined by each radiologist for 3.0 T DWI and 5.0 T DWI. The paired ROIs between the two scans were then utilized for evaluating the inter-field agreement. Additionally, the averages of the 3 measurements for each anatomic location given by the radiologists were utilized to evaluate the inter-observer agreements.Results
Representative DWI images of 3.0 T and 5.0 T were displayed in Figure 1-3. 5.0 T DWI displayed an increase in subjective image quality score compared to 3.0 T DWI without the significant difference (3.0 T DWI: 3.50±0.47, 5.0 T DWI: 3.72±0.42, p = 0.157). Both the inter-field and inter-observer agreements of ADC values were substantial to excellent (ICCs = 0.640 – 0.902). For all four upper abdominal organs, there were no significant differences between the ADC values measured by two observers and between the ADC values of 3.0 T and 5.0 T DWI (p = 0.134 – 1.000) (Figure 4). The CVs of ADC measurements from 3.0 T and 5.0 T DWI were all less than 15.0% (6.7% – 14.2%). Bland-Altman plots are shown in Figure 5 and show that the mean inter-field differences of ADC values (ADC5.0T – ADC3.0T) for liver, pancreas, spleen and kidney were -7.8 μm2/s (95% CI: -234.2 – 218.7 μm2/s), -21.8 μm2/s (95% CI: -274.0 – 230.5 μm2/s), 54.4 μm2/s (95% CI: -141.0 – 249.8 μm2/s) and 18.6 μm2/s (95% CI: -160.3 – 197.5 μm2/s).Discussion
In this study, two radiologists independently measured the ADC values of four abdominal organs: liver, spleen, pancreas and kidney. The inter-observer agreements of ADC measurements from both 3.0 T and 5.0 T were determined as substantial to excellent. Furthermore, our study indicated that there were no significant differences between the ADC measurements from 3.0 T and 5.0 T DWI. The inter-field agreement between ADCs was excellent for the kidney and substantial for the liver, spleen and pancreas. This may be due to the higher ADC of the kidney and to it being less vulnerable to respiratory motion artifact. The above results are in concordance with previous studies at 1.5 T and 3.0 T DWI.Conclusion
The substantial to excellent agreements between the ADC values measured with 3.0 T and 5.0 T DWI for liver, pancreas, spleen and kidney suggested that 5.0 T DWI can be applied for abdominal imaging. The ADC values from 5.0 T abdominal DWI hold the potential to serve as the quantitative markers for clinical investigations.Acknowledgements
1. Kraff O, Theysohn J, Maderwald S, Saylor C, Ladd S, Ladd M, et al., editors. MRI of the knee at 7.0 Tesla. Röfo-Fortschritte auf dem Gebiet der Röntgenstrahlen und der bildgebenden Verfahren; 2007: © Georg Thieme Verlag KG Stuttgart· New York.2. Karamat MI, Darvish-Molla S, Santos-Diaz A. Opportunities and challenges of 7 tesla magnetic resonance imaging: a review. Critical Reviews™ in Biomedical Engineering. 2016;44(1-2).
3. Winter L, Özerdem C, Hoffmann W, Santoro D, Müller A, Waiczies H, et al. Design and evaluation of a hybrid radiofrequency applicator for magnetic resonance imaging and RF induced hyperthermia: electromagnetic field simulations up to 14.0 Tesla and proof-of-concept at 7.0 Tesla. PloS one. 2013;8(4):e61661.
References
No reference found.Figures

Figure 1. Abdominal DWI images from 3.0 T and 5.0 T MRI examinations of a male volunteer with cysts of liver and kidney. Note: The arrows refer to the cysts.
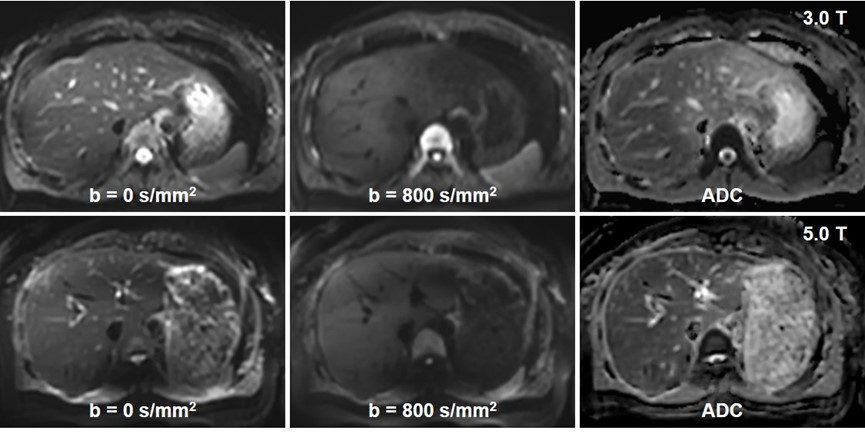
FIGURE 2. Example abdominal DWI images from 3.0 T and 5.0 T MRI examinations of a female volunteer.
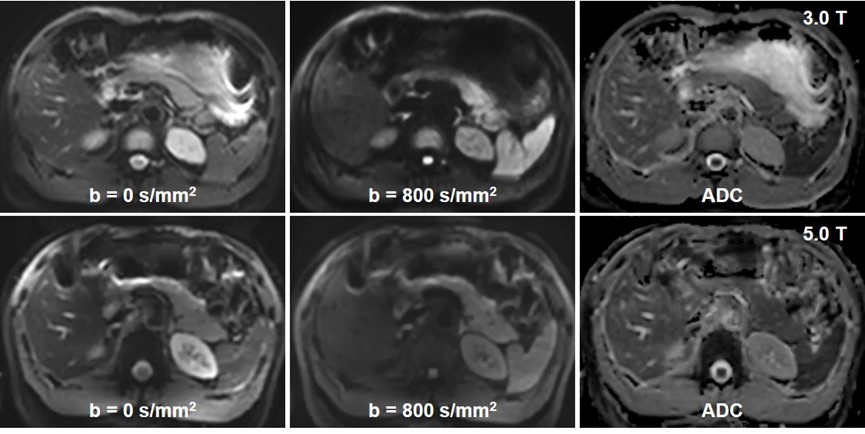
FIGURE 3. Example abdominal DWI images from 3.0 T and 5.0 T MRI examinations of a male volunteer.
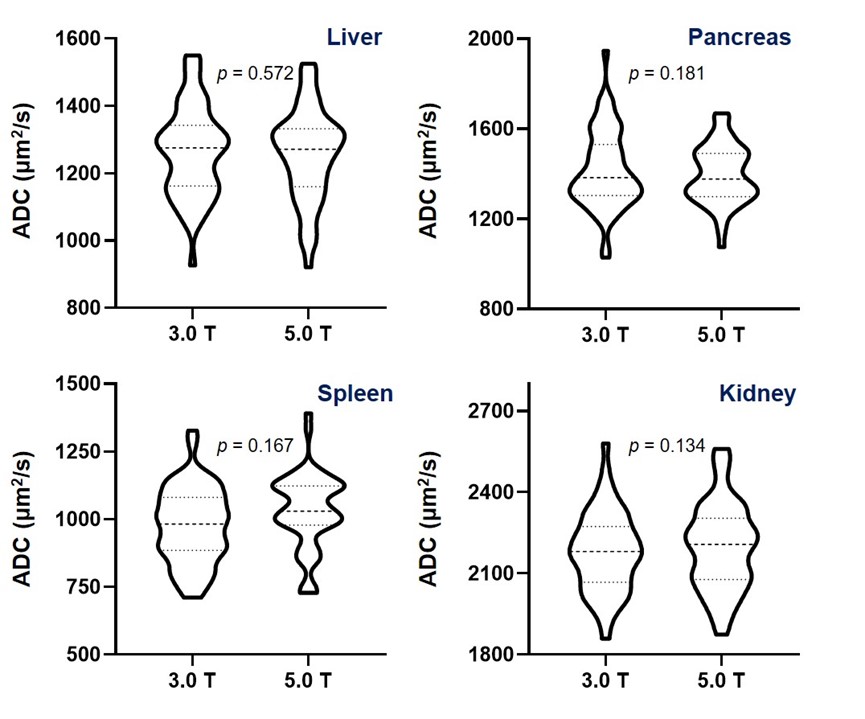
Figure 4. Inter-field
comparison of ADC values for liver, pancreas, spleen and kidney with the violin
plots.
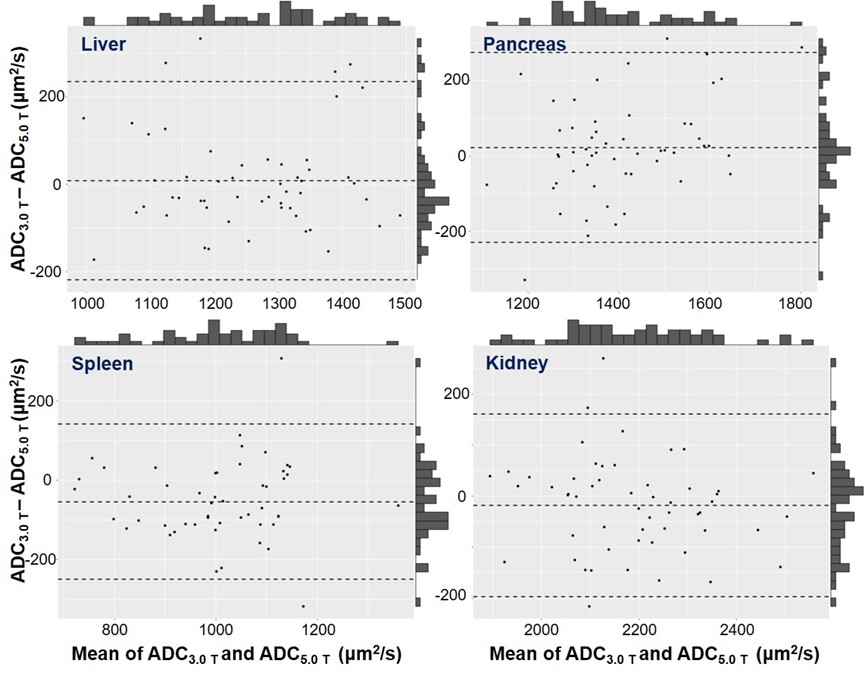
Figure 5. The
inter-field comparison of ADC values for liver, pancreas, spleen and kidney
with Bland Altman plots.
DOI: https://doi.org/10.58530/2023/3147