3145
Assessment of association between body composition contents and liver fibrosis in the patients with sarcopenic obesity
Tae-Hoon Kim1, Chang-Won Jeong1, ChungSub Lee1, SiHyeong Noh1, DongWook Lim1, Youe Ree Kim2, and Young Hwan Lee2
1Medical Convergence Research Center, Wonkwang University, Iksan, Korea, Republic of, 2Radiology, Wonkwang University School of Medicine and Hospital, Iksan, Korea, Republic of
1Medical Convergence Research Center, Wonkwang University, Iksan, Korea, Republic of, 2Radiology, Wonkwang University School of Medicine and Hospital, Iksan, Korea, Republic of
Synopsis
Keywords: Liver, Quantitative Imaging
Sarcopenic obesity is a disease which associates both sarcopenia and obesity and may trigger worse clinical outcomes including hepatic manifestation of fat accumulation and musculoskeletal disabilities. It is likely that sarcopenia and obesity share common physiological pathways and are interconnected through the muscle-liver-adipose tissue axis. Assessment of muscle mass is a key for the whole-body insulin-mediated glucose metabolism and energy homeostasis. However, it is little known the interconnection between hepatic fibrosis and sarcopenic obesity. This study compared body composition contents in non-obese and sarcopenic obese patients using abdominal MRIs and investigated the relationship between hepatic fibrosis and sarcopenic obesity factors.Introduction
Recently, sarcopenia and/or sarcopenic obesity were noted as a health risk in especially geriatric populations [1]. Sarcopenic obesity is an entity which associates both sarcopenia and obesity and may trigger worse clinical outcomes including hepatic fibrosis progression and musculoskeletal disabilities [2]. Muscle mass is a key determinant of the whole-body insulin-mediated glucose metabolism and impacts fatty liver oxidation and energy homeostasis. The mechanisms drive the accumulation of ectopic fat both in the liver (steatosis, fatty liver) and in the muscle (myosteatosis). Myosteatosis rather than the muscle mass, seems to be closely associated with the severity of the liver injury [3]. Thus, it is likely that sarcopenia and obesity share common physiological pathways and are interconnected through the muscle-liver-adipose tissue axis.In assessment of sarcopenic obesity, the importance of evaluating body composition contents as muscle and fat mass is undeniable. Especially, the muscle-liver-adipose tissue axis has a pivotal role in changes of the body composition, resulting in a distinct clinical phenotype that enables the identification of the “sarcopenic fatty liver phenotype” [4]. Up to date, it is little known the interconnection between hepatic fibrosis and sarcopenic obesity.
This study compared body composition contents in non-obese and sarcopenic obese patients using abdominal MR images and investigated relationship between hepatic fibrosis and sarcopenic obesity factors.
Subjects and Methods
Consecutive patients from June 2014 to December 2020, who were over 20 years of age, who underwent abdominal MRI and who had available pathologic information and serologic tests were retrospectively identified. A total of 44 patients including of 26 non-obesity and 18 sarcopenic obesity are enrolled from June 2014 to December 2020 (Fig. 1). They complained fatigue and inactivity, and they appear weaker in maximum muscular strength. All patients underwent histopathologic investigation and they classified fibrosis stage (F0-F4) based on the Meta-analysis of Histological Data in Viral Hepatitis (METAVIR) fibrosis scoring system. Obesity was defined as a body mass index (BMI) > 25 kg/m2 (Table 1).Muscle mass and fat areas at 3rd lumber spine (L3) level were assessed by an ImageJ-based ‘sarcopenia’ plugin (Fig. 2). The variation in the muscle area (MA), subcutaneous fat area (SA), and visceral fat area (VA) among fibrosis stages was analyzed with an independent two sample T-test. Association between hepatic fibrosis and sarcopenic obesity factors were analyzed with Spearman’s correlation test.
Results
Table 2 and Figure 3 shows areas and ratios of body composition contents at L3 level in non-obese and obese groups. There were significant differences in SA (p=0.001) and VA (p<0.001), whereas there was no difference in MA (p=0.234). Regarding the ratios, there were significant differences in MA/SA (p=0.048), MA/VA (p<0.001), and MA/(SA+VA) (p<0.001).Table 3 shows association between hepatic fibrosis scores (METAVIR score) and other sarcopenic factors. In all the patients, hepatic fibrosis positively correlated with serum aspartate aminotransferase level (AST; p=0.003). Especially in sarcopenic obese patients, hepatic fibrosis positively correlated with body mass index (BMI; p=0.014), AST level (p=0.010) and SA (p=0.009). However, there was no correlation in non-obese patients.
Conclusion
This study demonstrated that patients with sarcopenic obesity are larger in SA and VA than non-obese patients. The hepatic fibrosis in sarcopenic obesity positively correlated with body visceral fat composition in combination with traditional BMI and AST level. These findings would be useful for understanding the relationship between hepatic manifestation of fibrosis and body fat composition in sarcopenic obesity and sarcopenia.Acknowledgements
This study was supported by the grant of the Korea Health Technology R&D Project through the Korea Health Industry Development Institute (KHIDI), funded by the Ministry of Health & Welfare, South Korea (HI18C1216), and by the grant of National Research Foundation of Korea (NRF) (2020R1I1A1A01073871).References
1. Cruz-Jentoft AJ, et al., Age Aging, 2010; 39: 412-23.
2. Roh E, et al., Front Endocrinol, 2020; 11: 332.
3. Bunchorntavakul C, et al., Aliment Pharmacol Ther, 2020; 51: 64-77.
4. Younossi ZM. J Hepatol, 2019; 70: 531-44.
Figures
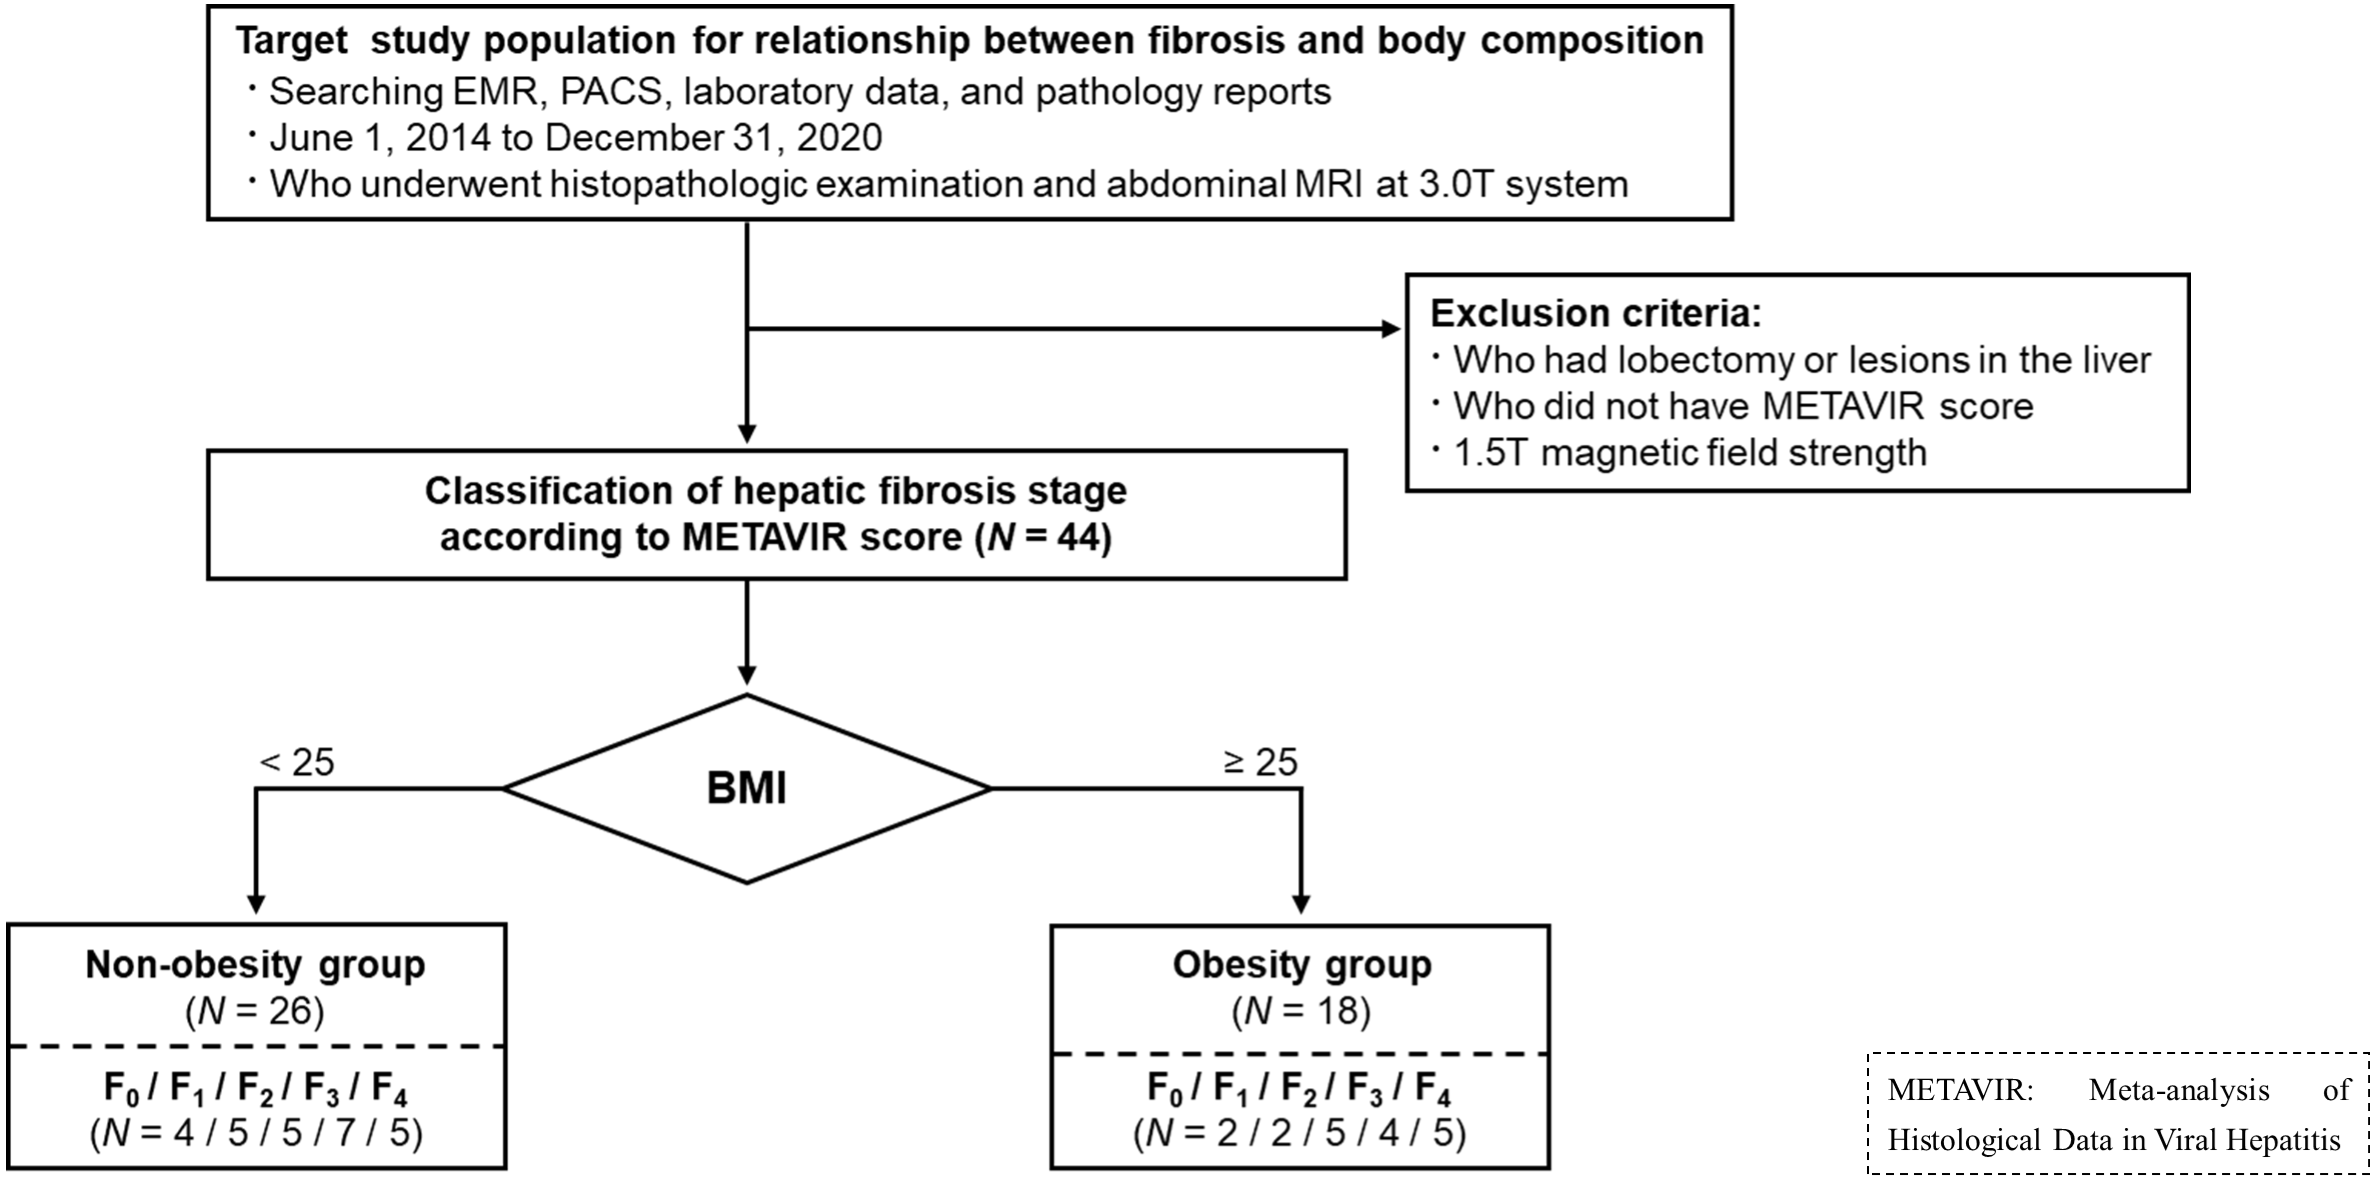
Figure 1. Flowcharts
of study population for inclusion.
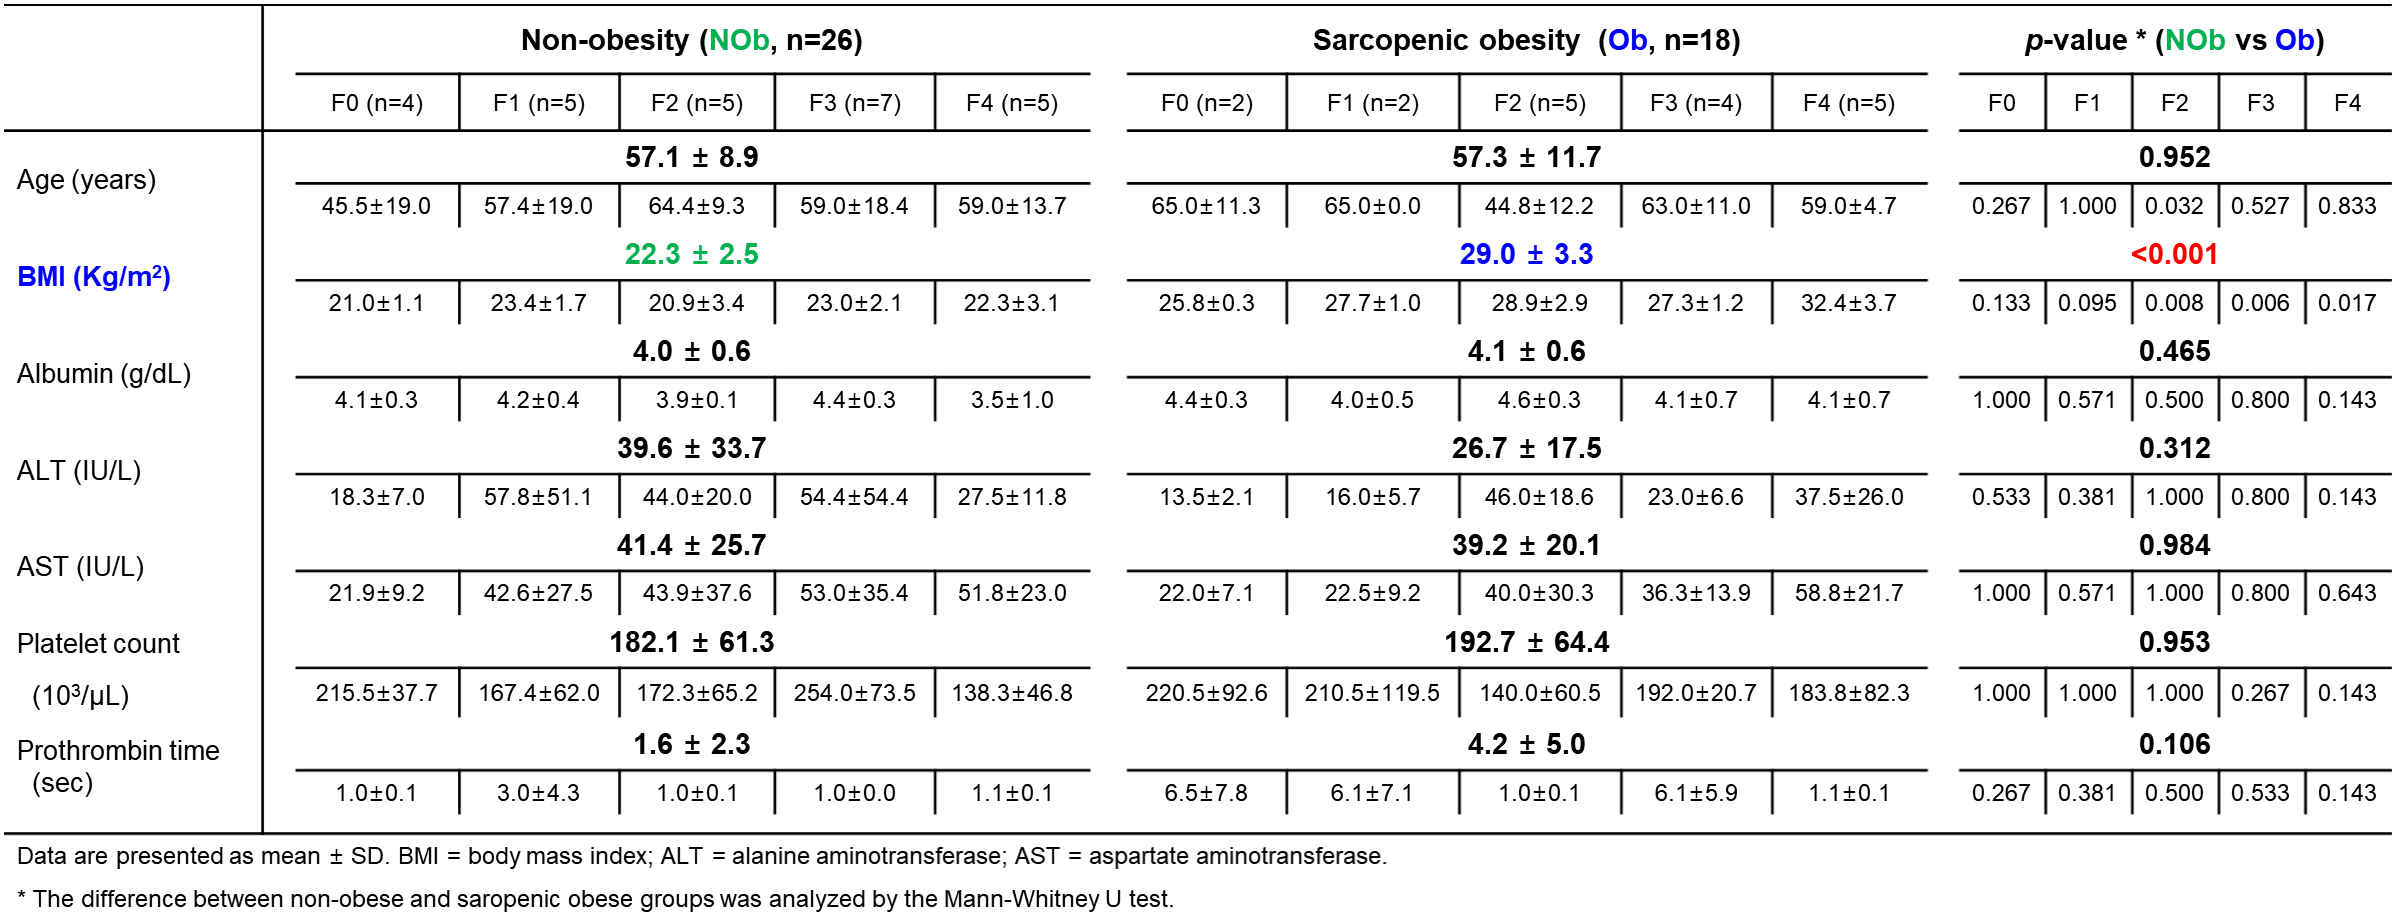
Table 1. Clinical characteristics
in both non-obesity and obesity groups according to
hepatic fibrosis stage (F, METAVIR score)
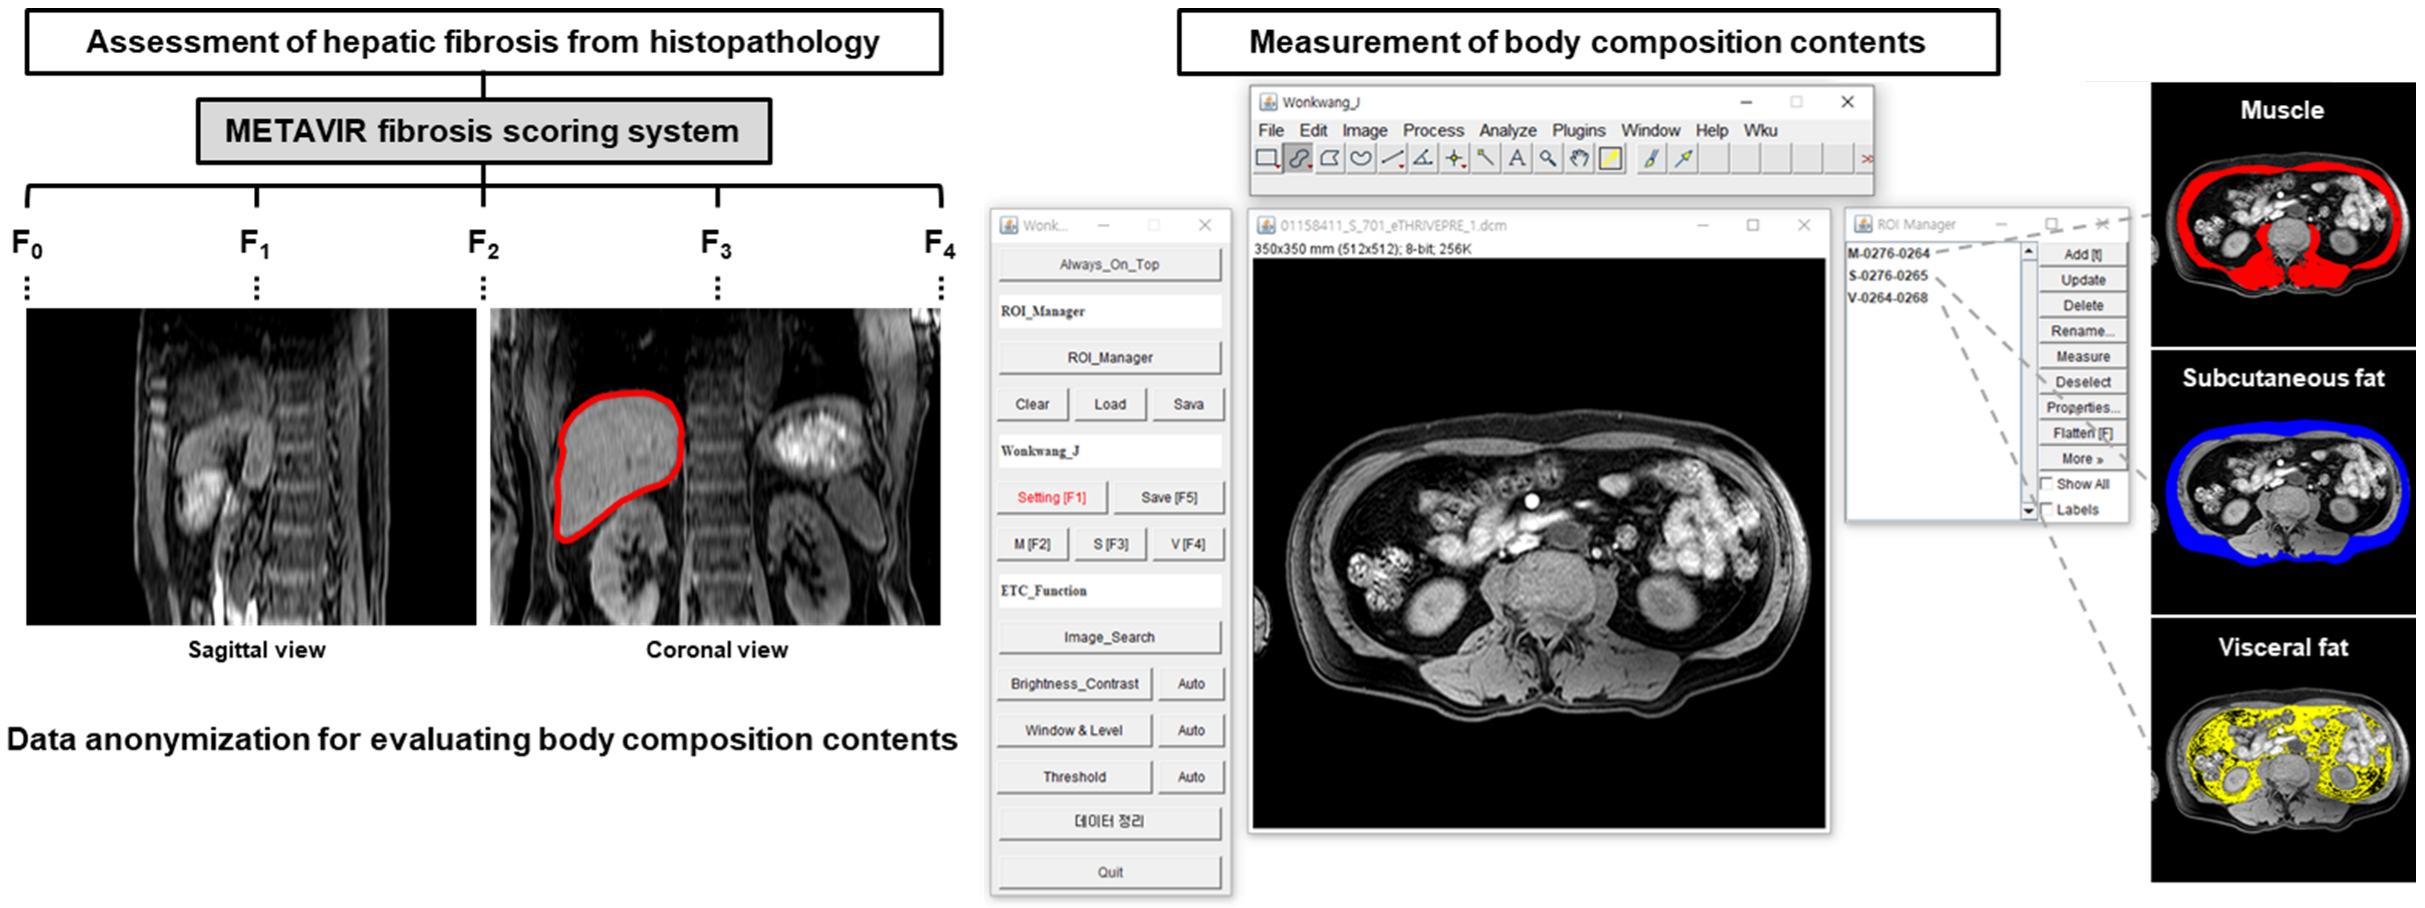
Figure 2. Representative
measurement of body composition contents (muscle, subcutaneous fat, and
visceral fat) on abdominal MR images at third lumbar spine (L3, inside red-line)
level using imageJ based ‘sarcopenia plug-in’ software.
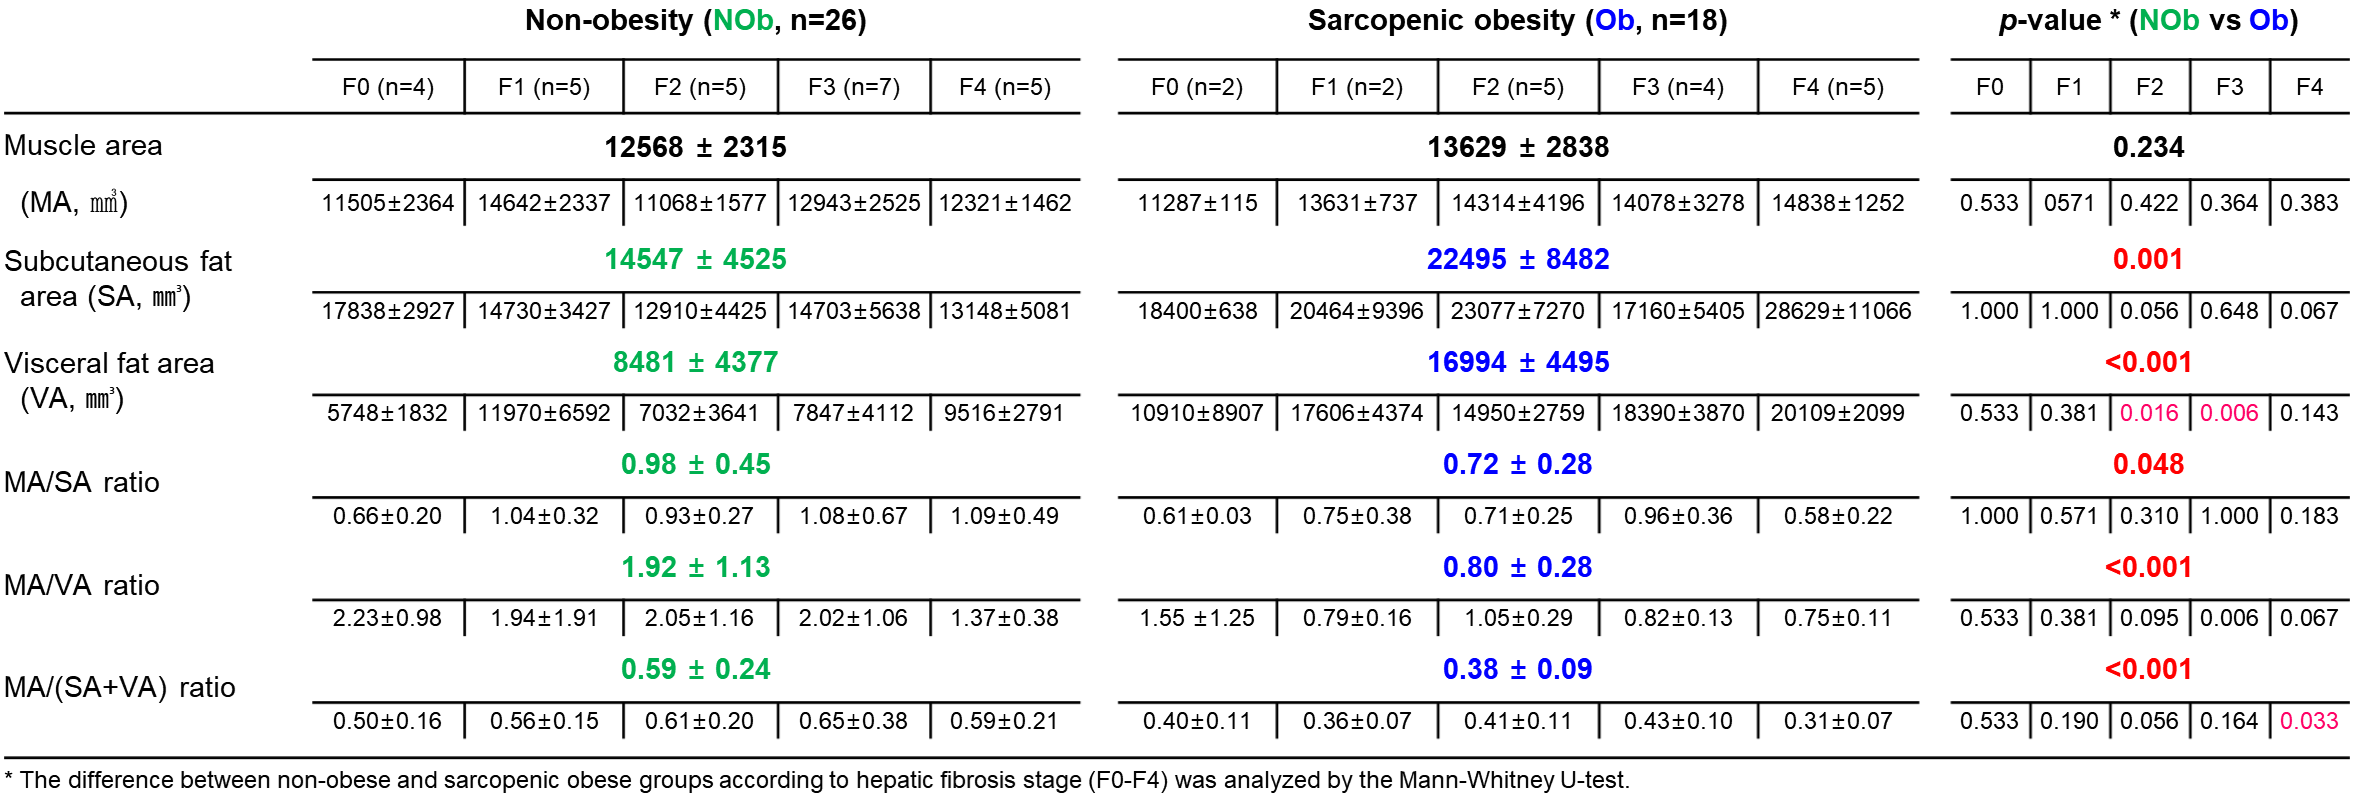
Table 2. Comparisons
of body composition contents at L3 level in non-obese and obese groups
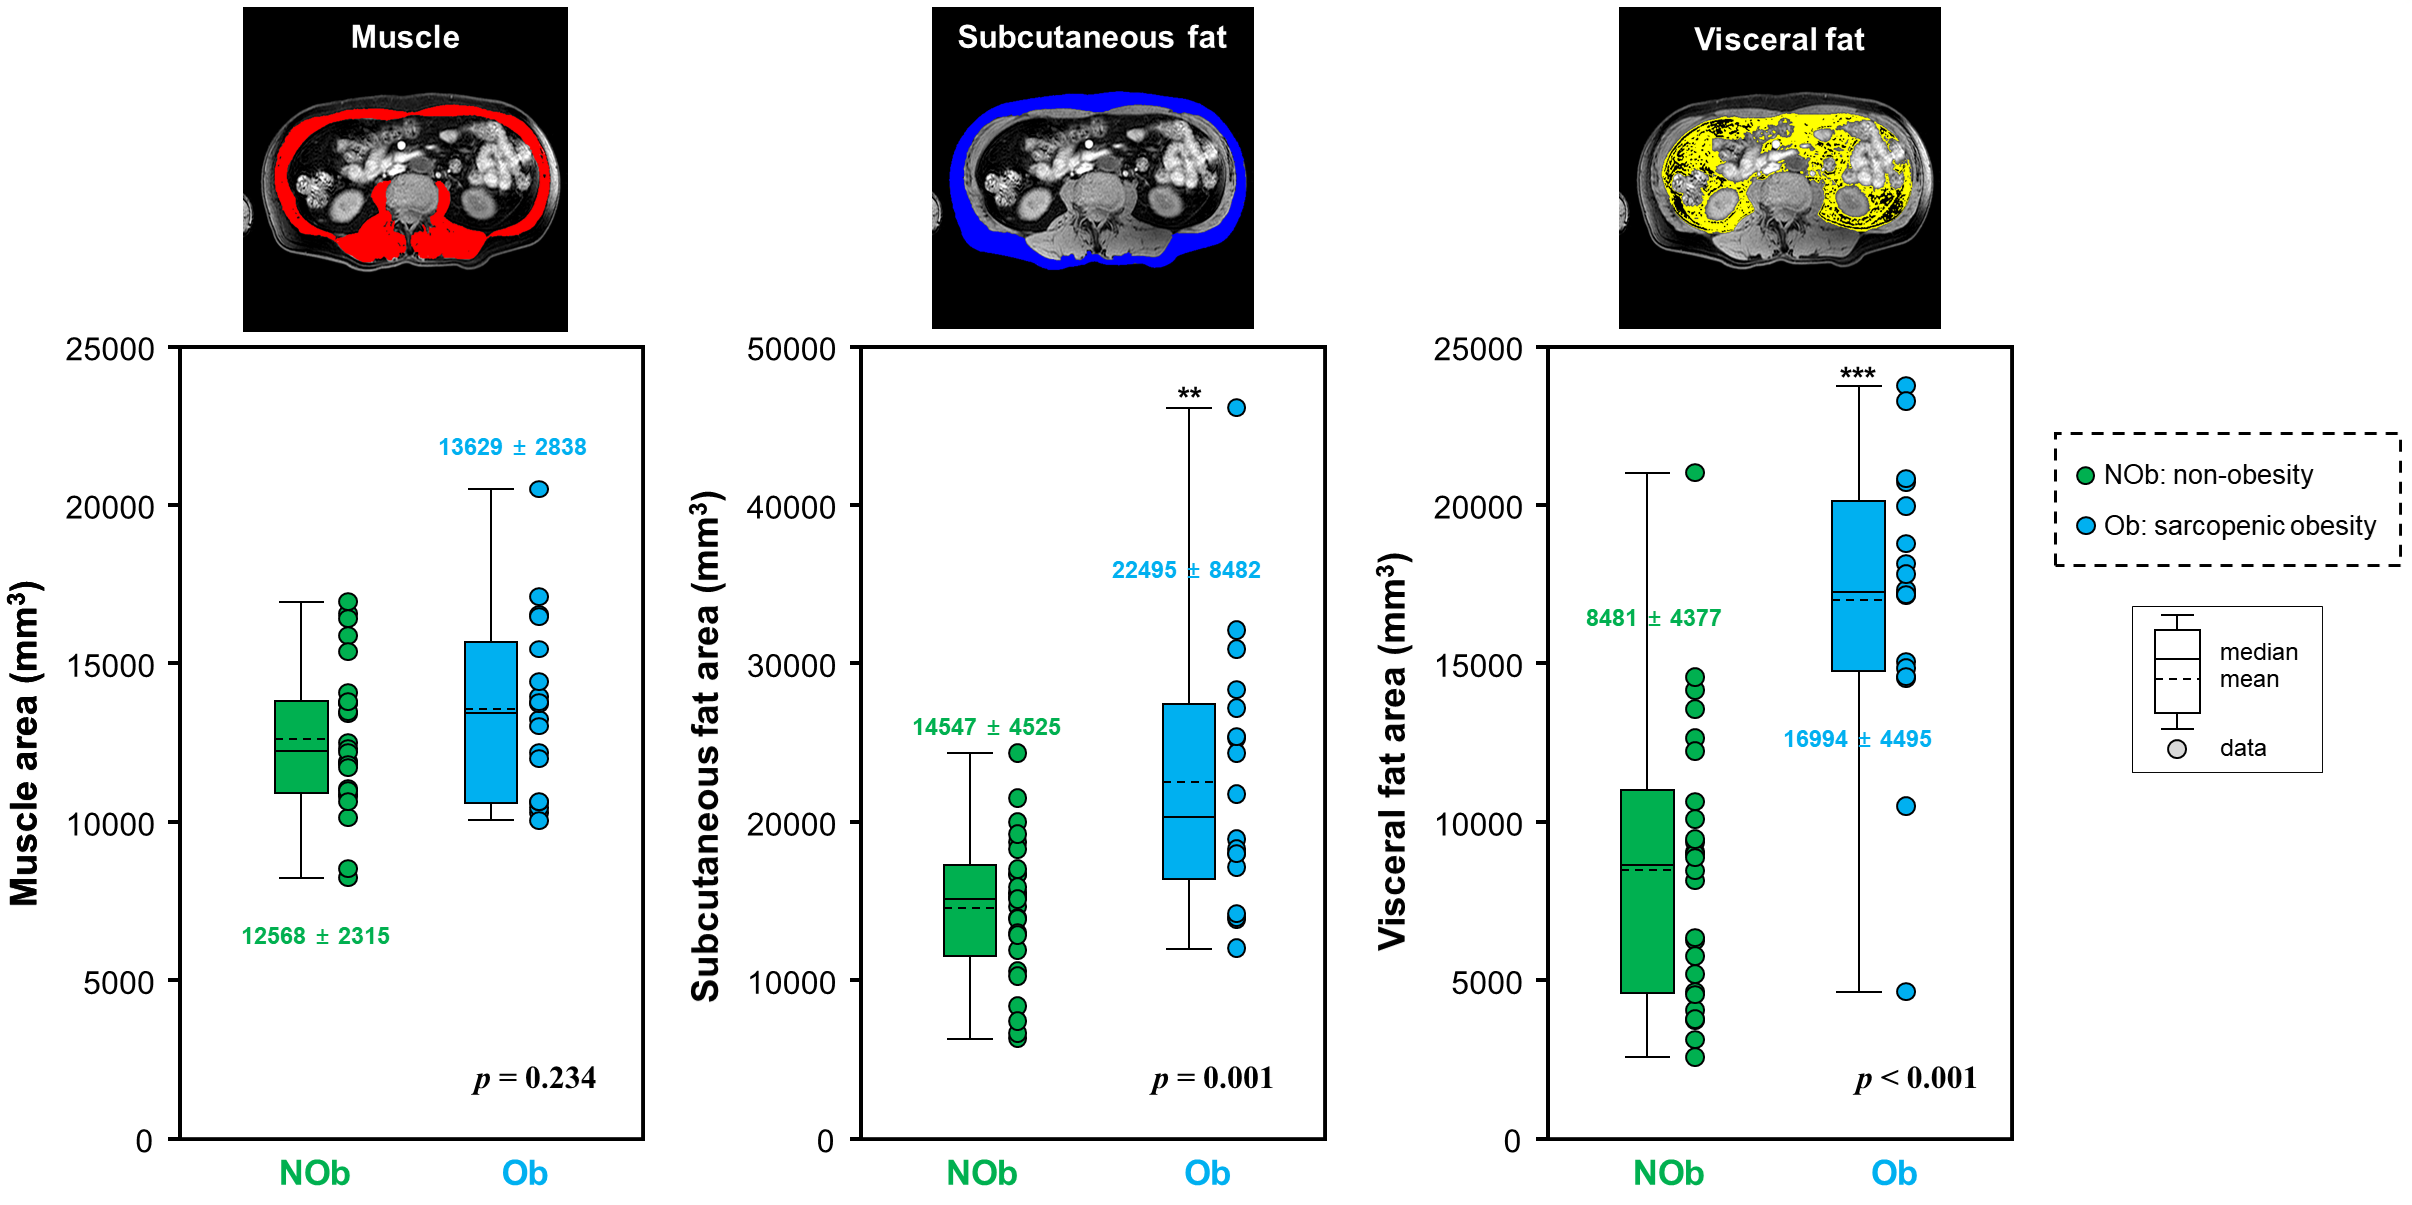
Figure 3A. Box plots
demonstrated the areas of muscle (MA), subcutaneous fat (SA), visceral
fat (VA) in non-obesity and obesity
groups
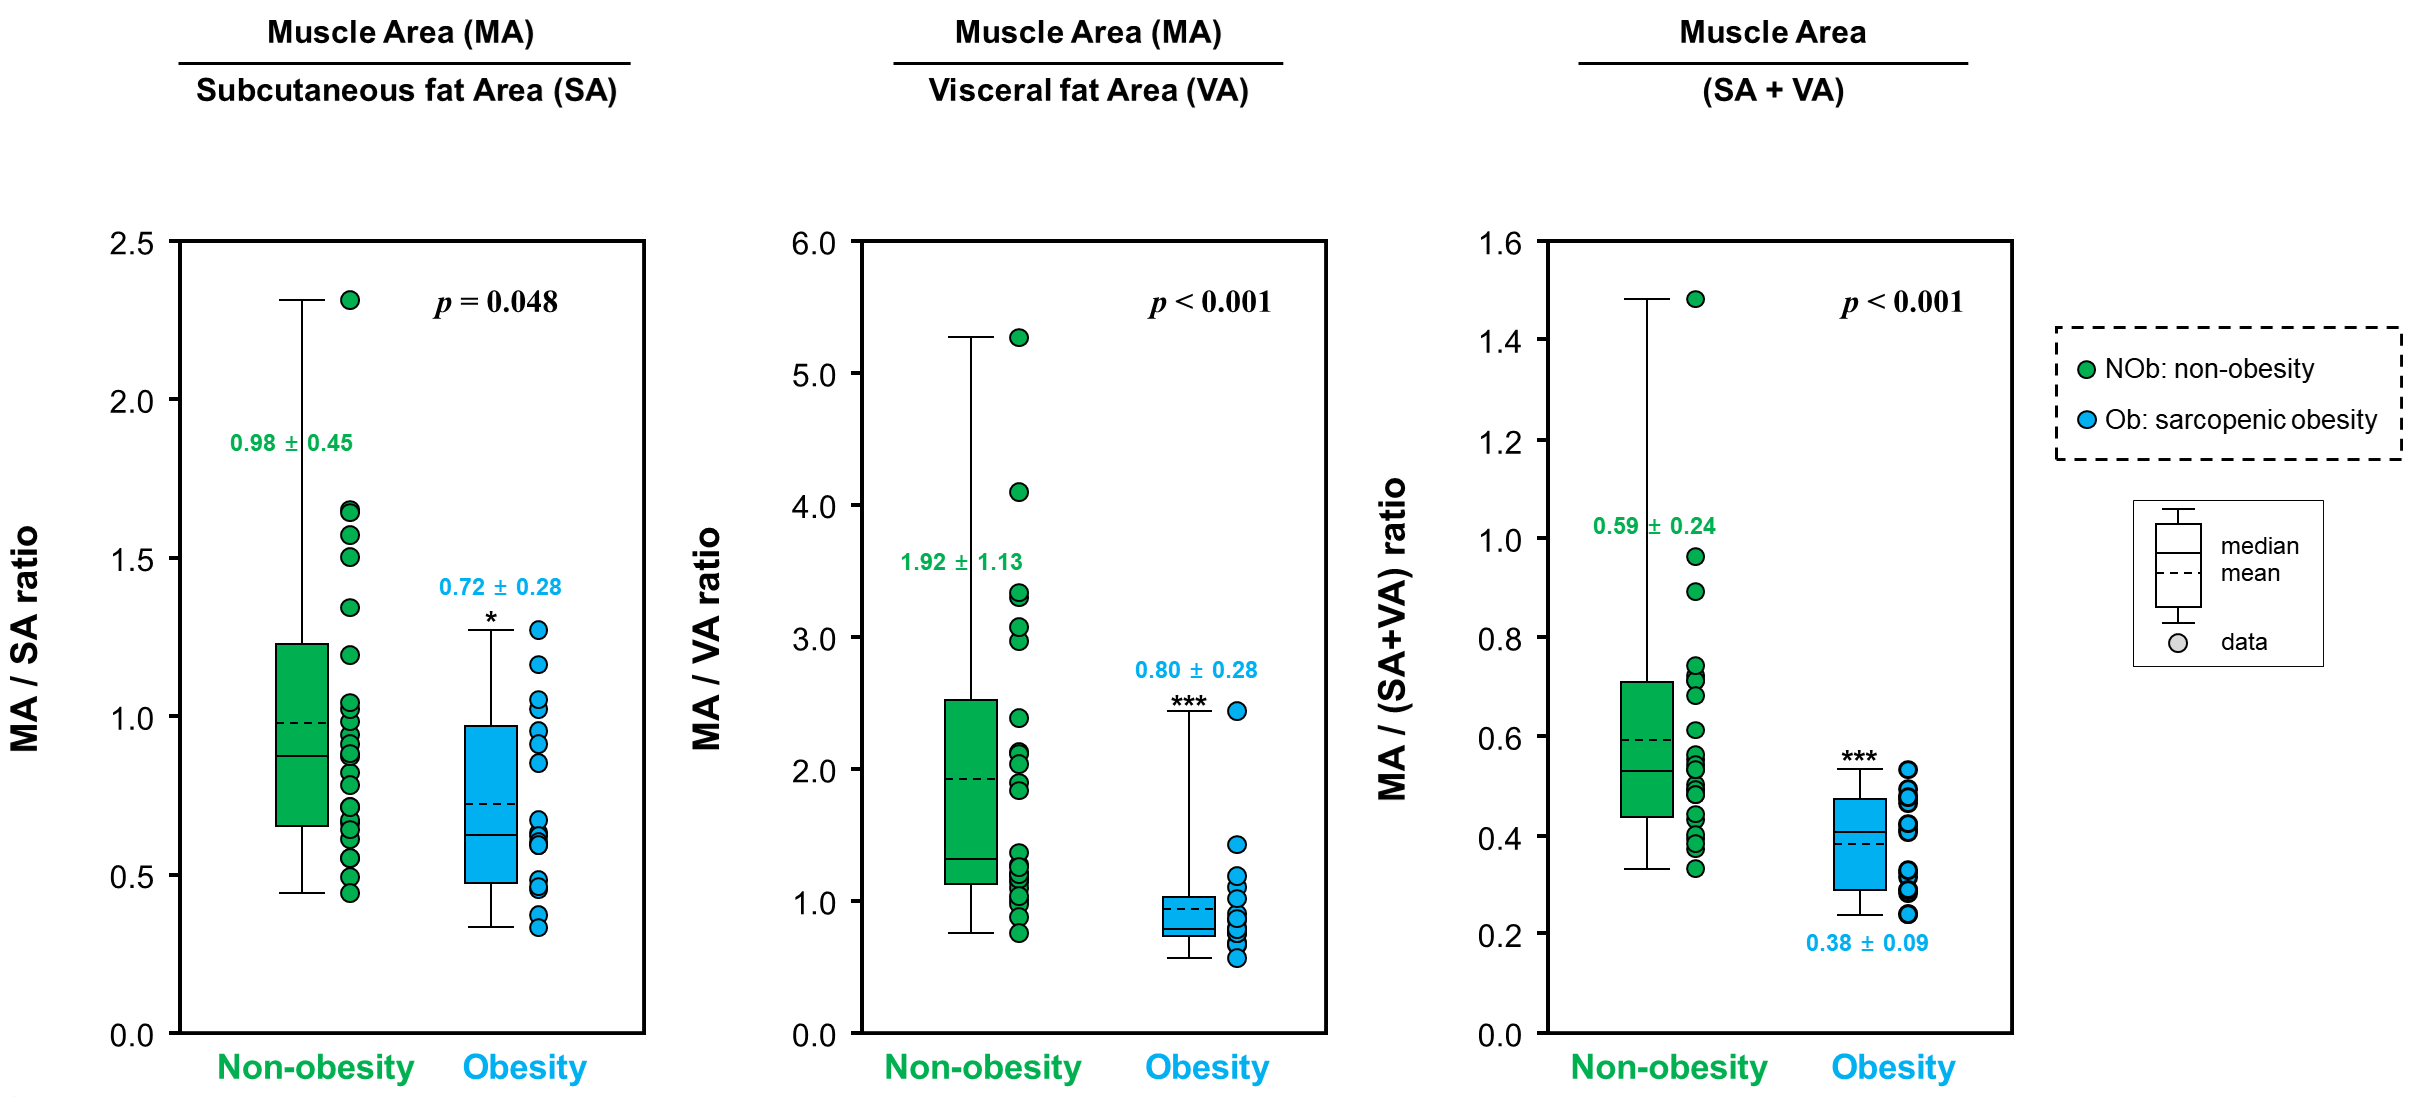
Figure 3B. Box plots
demonstrated the ratios as MA/SA, MA/VA, MA/(SA + VA) in non-obesity
and obesity groups.
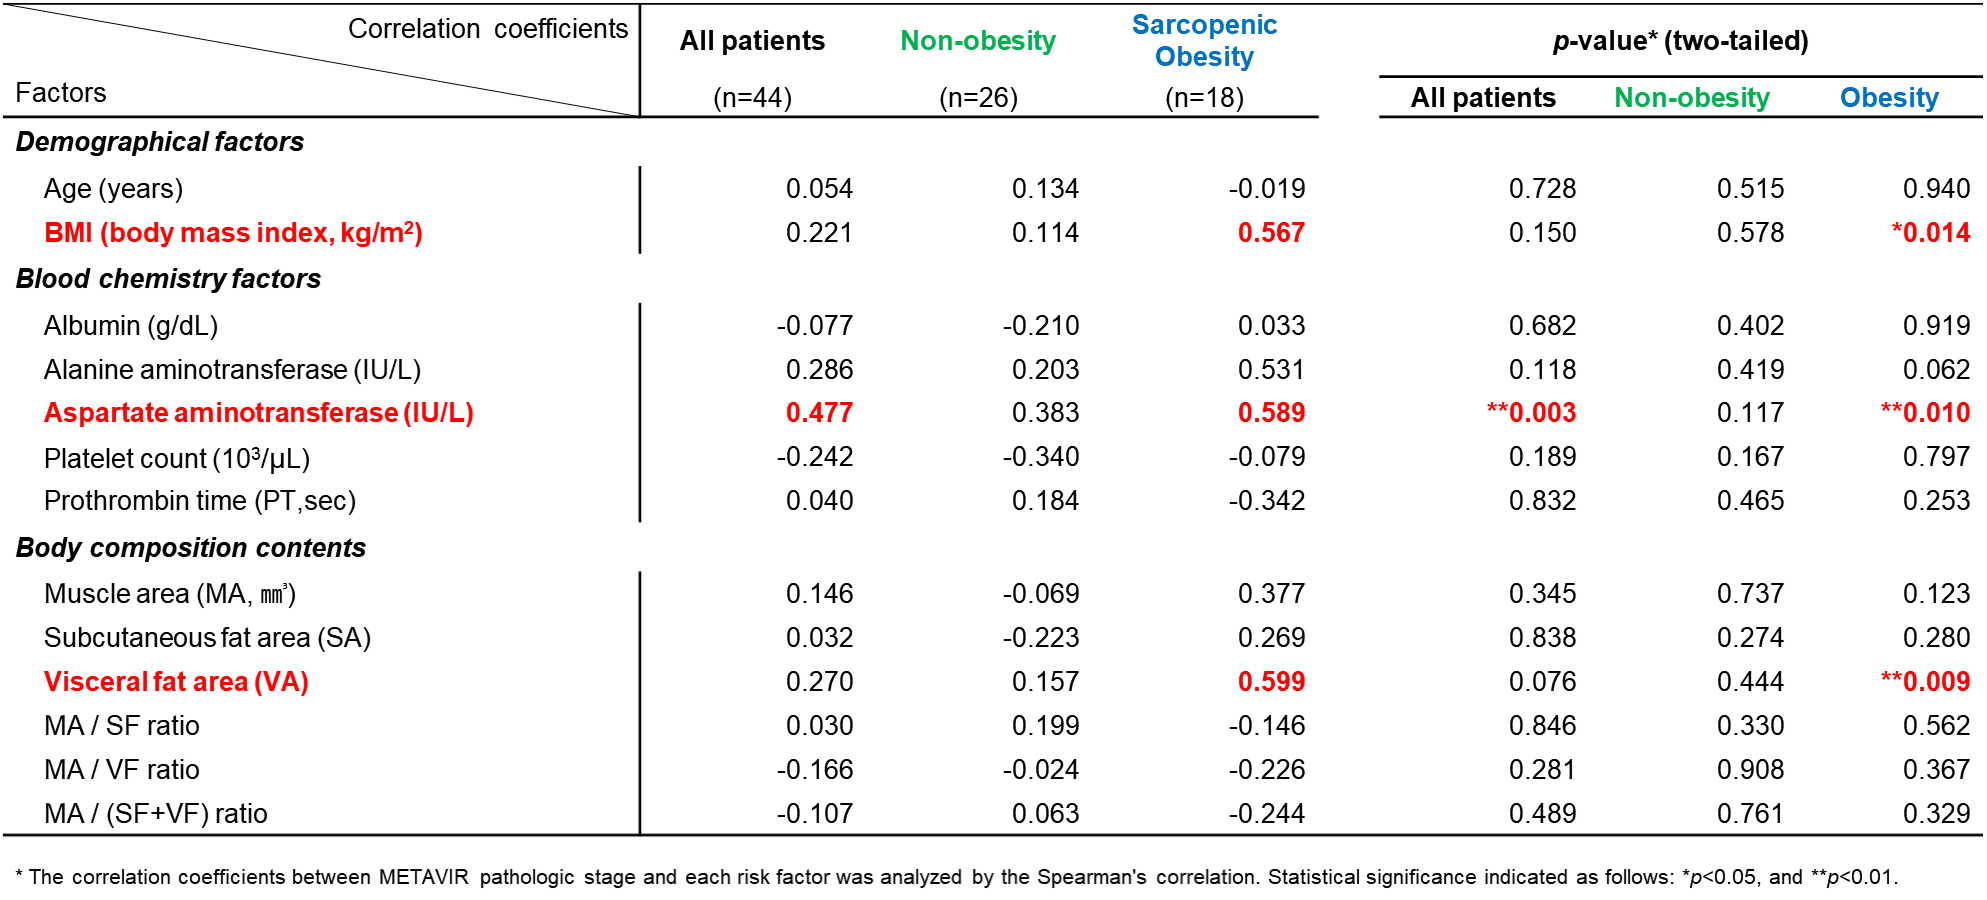
Table 3. Correlation
between METAVIR fibrosis scores and other factors
DOI: https://doi.org/10.58530/2023/3145