3144
Diffusion Metrics for Staging Liver Fibrosis: An Experimental Study in Rats with Bile Duct Ligation and Carbon Tetrachloride at 11.7 T MRI1Xinhua Hospital affiliated to Shanghai Jiao Tong University School of Medicine, Shanghai, China, 2Institute of Science and Technology for Brain-Inspired Intelligence, Fudan University, shanghai, China, 3Xinhua Hospital affiliated to Shanghai Jiao Tong University School of Medicine, shanghai, China
Synopsis
Keywords: Liver, Diffusion/other diffusion imaging techniques
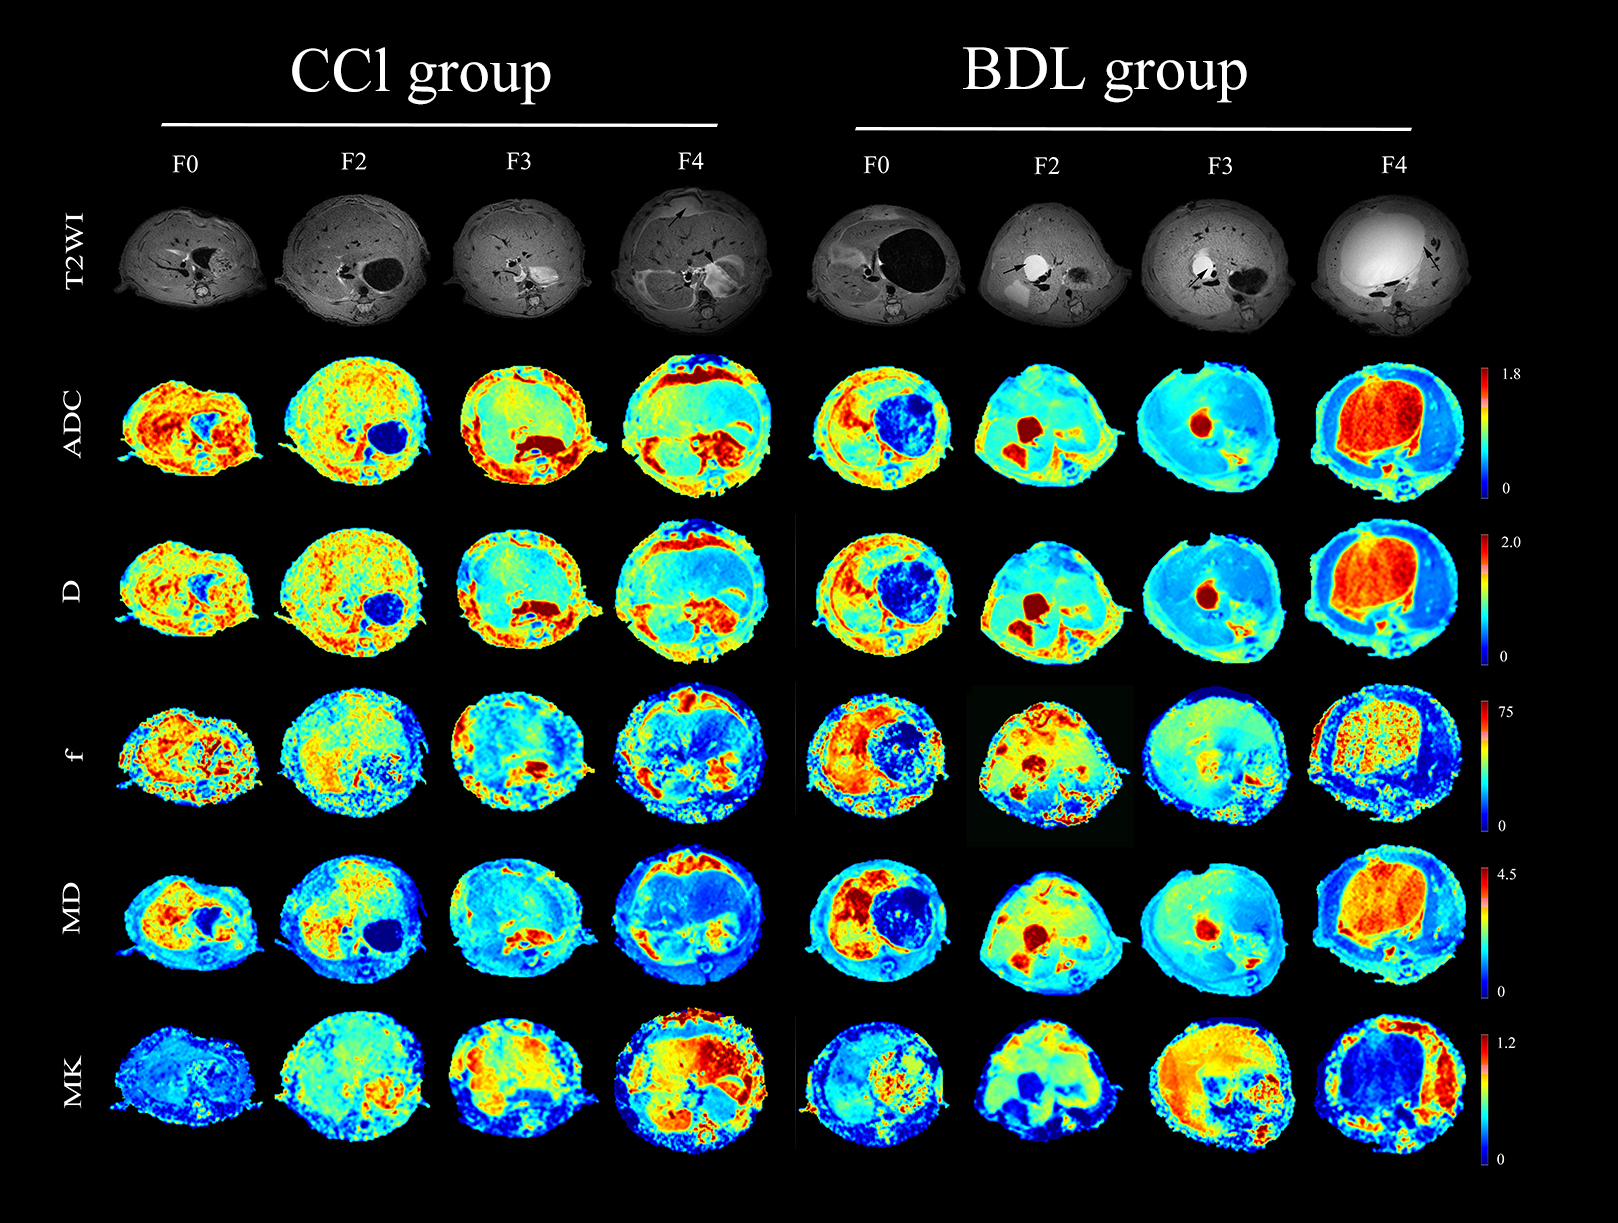
As a common pathological feature of chronic liver diseases, liver fibrosis is a significant cause of global morbidity and mortality. An accurate assessment of the fibrosis stage and early detection of hepatic fibrosis are essential for preventing further adverse consequences. Our study suggests diffusion metrics are useful tools for noninvasively staging liver fibrosis. Among them, MK is a more valuable imaging biomarker for evaluating the degree of liver fibrosis, and f is less consistent in our two fibrosis models.Purpose
To investigate and compare the performances of diffusion metrics (DWI, IVIM, and DKI) for noninvasively staging liver fibrosis in bile duct ligation (BDL) or carbon tetrachloride (CCl4) modelMaterials and Methods
Different degrees of liver fibrosis was induced by the bile duct ligation (BDL) and carbon tetrachloride (CCl4) in 120 rats. The fibrosis stages (F0-F4), inflammatory activity grades (A0-A3), steatosis content, iron deposition (0-3), and cytokeratin 19 (CK19) expression were semi-quantified by using histology staining. To test differences in quantitative parameters and tissue analyses among groups by using one-way ANOVA. To explore independent influencing factors of quantitative parameters by using multiple regression analysis. The interaction between the two animal models on each quantitative parameter was tested by factorial design ANOVA. The performance of each quantitative parameters to stage liver fibrosis was quantified by using receiver operating characteristic (ROC) curve analysis.Results
As liver fibrosis worsened, ADC, D, f, and MD all showed a downward trend, and MK values gradually increased. D* showed no significant statistical difference in all fibrotic stages. Spearman ’s correlation analysis showed that MK was strongly positively correlated with fibrosis stages in all fibrosis models (rCCl4 model = 0.773, rBDL model = 0.731, rtotal cohort = 0.757; all P <0.001). ADC, D and MD values were moderately negatively correlated with liver fibrosis stages (r = -0.421 ~ -0.695, all P <0.01). The f value was weakly correlated with the fibrosis stages in the CCl4 model (r = -0.383, P <.001), while it was moderately correlated with the fibrosis stages in the BDL model (r = 0.532, P <0.01). Among all diffusion parameters, the consistency of MK and MD in the two fibrosis models is better, and the consistency of f value in the two fibrosis models is slightly worse. ROC curve analysis showed that the diagnostic efficacy of MK was higher than other diffusion parameters (AUCCCl4 model = 0.91, AUCBDL model = 0.90, AUC total cohort = 0.91).Conclusion
Multiple MRI quantitative parameters are related to liver fibrosis stages, but they behave differently in different fibrosis models. Among them, MK is a more valuable imaging biomarker for monitoring the degree of liver fibrosis. f is less consistent in the two fibrosis models.Acknowledgements
We thank the National Natural Science Foundation of China (No.82001762) for financial support. We are also grateful to Dr. Xiaoying Wang (Department of Pathology, Xinhua Hospital) for the pathological analysis of liver specimens, and Xi Zhang, Ph.D. (Clinical Research Unite, Xinhua Hospital, Shanghai Jiao Tong University School of Medicine, Shanghai, China) for her statistical support of this study.References
[1] Taouli B, Koh D M. Diffusion-weighted MR imaging of the liver[J]. Radiology,2010,254(1):47-66.
[2] Zhu L, Pan Z, Ma Q, et al. Diffusion Kurtosis Imaging Study of Rectal Adenocarcinoma Associated with Histopathologic Prognostic Factors: Preliminary Findings[J]. Radiology,2017,284(1):66-76.
[3] Goshima S, Kanematsu M, Noda Y, et al. Diffusion kurtosis imaging to assess response to treatment in hypervascular hepatocellular carcinoma[J]. AJR Am J Roentgenol,2015,204(5):W543-W549.
[4] Jensen J H, Helpern J A. MRI quantification of non-Gaussian water diffusion by kurtosis analysis[J]. NMR Biomed,2010,23(7):698-710.
[5] Rosenkrantz A B, Padhani A R, Chenevert T L, et al. Body diffusion kurtosis imaging: Basic principles, applications, and considerations for clinical practice[J]. J Magn Reson Imaging,2015,42(5):1190-1202.
[6] Zhu L, Pan Z, Ma Q, et al. Diffusion Kurtosis Imaging Study of Rectal Adenocarcinoma Associated with Histopathologic Prognostic Factors: Preliminary Findings[J]. Radiology,2017,284(1):66-76.
[7] Sun K, Chen X, Chai W, et al. Breast Cancer: Diffusion Kurtosis MR Imaging-Diagnostic Accuracy and Correlation with Clinical-Pathologic Factors[J]. Radiology,2015,277(1):46-55.
[8] Y B, Y L, J T, et al. Grading of Gliomas by Using Monoexponential, Biexponential, and Stretched Exponential Diffusion-weighted MR Imaging and Diffusion Kurtosis MR Imaging.[J]. Radiology,2016,278(2):496-504.
[9] Yang L, Rao S, Wang W, et al. Staging liver fibrosis with DWI: is there an added value for diffusion kurtosis imaging?[J]. European Radiology,2018,28(7):3041-3049.
[10] Yoshimaru D, Miyati T, Suzuki Y, et al. Diffusion kurtosis imaging with the breath-hold technique for staging hepatic fibrosis: A preliminary study[J]. Magnetic Resonance Imaging,2018,47:33-38.
[11] H J, J C, R G, et al. Liver fibrosis staging with diffusion-weighted imaging: a systematic review and meta-analysis.[J]. Abdominal radiology (New York),2017,42(2):490-501.
Figures