3143
A statistical analysis of ROI weighting by area for MRE derived liver stiffness measurements
Justin Yu1, Alvin C Silva1, Annelise Silva2, Matthew Doan1, and Anshuman Panda1
1Mayo Clinic Arizona, Phoenix, AZ, United States, 2Wright State University, Fairborn, OH, United States
1Mayo Clinic Arizona, Phoenix, AZ, United States, 2Wright State University, Fairborn, OH, United States
Synopsis
Keywords: Liver, Elastography
MR elastography (MRE) derived liver stiffness measurements (LSMs) require manual drawing of ROIs on elastogram images. These ROIs may differ in size, and some clinicians suggest that reporting mean stiffness weighted by ROI area is more accurate than the unweighted mean. In this study the unweighted and weighted mean liver stiffness were calculated for 161 patients undergoing liver MRE exams using various scanning hardware/field strengths, and the statistical significance of the difference between the two sets of LSMs was tested using a paired two-tailed t-test. No statistically significant differences were found between weighted and unweighted LSMs.Introduction
MR Elastography (MRE) is a widely utilized noninvasive quantitative biomarker for liver stiffness1. However, obtaining liver stiffness measurements (LSMs) requires manual drawing of appropriate ROIs by a trained individual. Some clinicians suggest that because the sizes of the ROIs obtained for MRE can differ significantly, the weighted mean stiffness should be used for clinical reporting instead of the unweighted mean stiffness2. Calculating the weighted mean stiffness requires an additional step of noting each ROI area, with the increasing potential for transcription error because the weighted mean formula has more input variables than the unweighted formula. In contrast, the unweighted mean stiffness is calculated simply by drawing the ROIs and averaging the ROI stiffnesses, which is faster and less prone to calculation error. This study seeks to elucidate the differences between weighted and unweighted LSM, and to individually analyze this relationship by scanner field strength, choice of pulse sequence type, and scanner manufacturer.Methods
Liver stiffness measurements (LSM) were calculated on MRE exams at Mayo Clinic Arizona. MRE exams were performed on four different scanning platforms: a 1.5T scanner from Vendor A, a 1.5T scanner from Vendor B, a 3T scanner from Vendor A, and a 3T scanner from Vendor B. Both gradient echo (GRE) and spin echo (SE) sequences were among those tested. The vendor A 1.5T GRE sequence had TE of 20.2ms, TR of 50ms, slice thickness of 10mm, matrix 224x64, and FOV of 40x40cm. The Vendor A 3T SE sequence had TE of 54.9ms, TR of 1000ms, slice thickness of 10mm, matrix 64x64, and FOV of 44x44cm. The Vendor B 1.5T SE sequence had a TE of 47ms, TR of 1200ms, slice thickness of 8mm, matrix 100x100, and FOV of 42x42cm. The Vendor B 3T SE sequence had a TE of 47ms, TR of 1200ms, slice thickness of 7mm, matrix 100x100, and FOV of 42x42cm. Only cases where a measurement was made on each of the 4 slices of the MRE acquisition were included for analysis.All ROIs were drawn on the elastograms by the interpreting radiologist. The unweighted LSM was calculated as $$$AM = \frac{m_1+m_2+m_3+m_4}{4}$$$, and the weighted LSM was calculated by $$$AM_w = \frac{m_1w_1+m_2w_2+m_3w_3+m_4w_4}{w_1+w_2+w_3+w_4}$$$, where m and w are the mean stiffnesses and areas of the measurement ROIs, respectively. A two tailed paired t-test was used to calculate the significance of the difference between the unweighted and weighted LSMs for each grouping of MRE exams, with a significance threshold of p<0.05. The data were individually tested for significance by field strength, pulse sequence type, and scanner manufacturer. The percentage difference between each of the unweighted and weighted LSM pairs was calculated. A total of 161 exams were analyzed; the exams were then further subdivided by either field strength, GRE vs SE sequence, or scanner manufacturer and had the same significance test performed on each subdivided data set.
Results
The paired t-test for the entire dataset calculated a p-value of 0.567, showing no significant different between weighted and unweighted liver stiffnesses. The same result was found for the subsets of data grouped together by field strength (1.5T p=0.543, 3T p=0.649), sequence type (GRE p=0.971, SE p=0.324), or scanner manufacturer (Vendor A p=0.958, Vendor B p=0.350). The average percentage difference between weighted and unweighted LSM was 1% for 3T (N = 109), spin echo (N = 120), and Vendor B (N = 114) subsets; the average percentage difference was 2% for 1.5T (N = 52), gradient echo (N = 41), and Vendor A (N = 47) subsets.Discussion
Our results do not support the hypothesis that weighting individual ROIs by area for an MRE acquisition significantly alters the final LSM measurement. Differences between the weighted and unweighted LSM was small for most of the analyzed cases. For cases that have a larger difference between the two (>10%), inspection of the original MRE images showed that these acquisitions may have suffered from image artifact issues. For example, some of the slices had very small amounts (<5cm2) of high confidence (>95% CI) area in the elastogram to draw an ROI. A small value for w in this situation will affect the calculation of the weighted mean but not the unweighted mean. Additionally, some ROIs showed elevated stiffness in one slice but not the adjacent slices. This may be a sign of elastogram reconstruction issues, and the m value for that slice will affect the weighted LSM, but also the unweighted LSM in this case. Further study with additional subjects at 1.5T/GRE exams may augment the statistical significance.Conclusion
Calculating the weighted mean liver stiffness may not hold an advantage over the unweighted mean liver stiffness when interpreting liver MRE images. ROI drawing and calculation remains a manual process for MR elastography; automatic segmentation software packages (e.g. MREPlus, LiverLab) specifically tailored to liver imaging may streamline this process and reduce the potential for human error when reporting MRE data.Acknowledgements
No acknowledgement found.References
- Ozturk, A., Olson, M.C., Samir, A.E. et al. Liver fibrosis assessment: MR and US elastography. Abdom Radiol 47, 3037–3050 (2022). https://doi.org/10.1007/s00261-021-03269-4
- Guglielmo FF, Venkatesh SK, Mitchell DG. Liver MR Elastography Technique and Image Interpretation: Pearls and Pitfalls. Radiographics. 2019 Nov-Dec;39(7):1983-2002. doi: 10.1148/rg.2019190034. Epub 2019 Oct 18. PMID: 31626569.
Figures
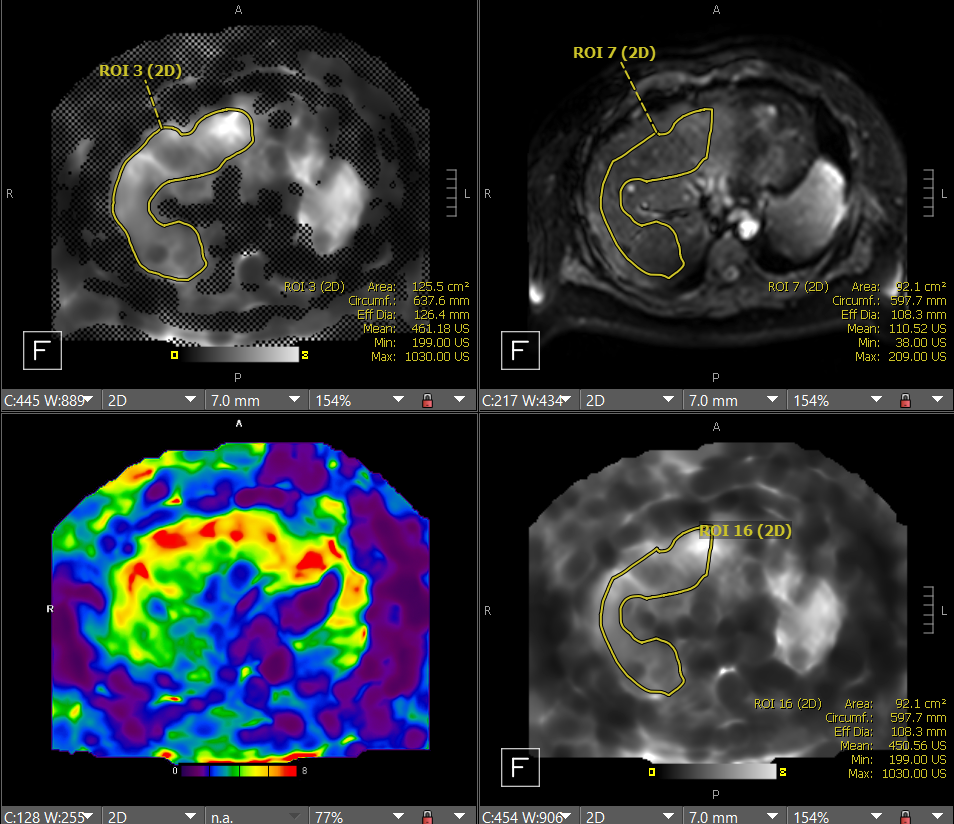
Figure 1: Example of ROIs used to calculate LSM. CW from top left: masked elastogram, MRE magnitude image, unmasked elastogram, and RBG unmasked elastogram. ROIs are first drawn on the masked elastogram, pasted on the magnitude image and cropped to the liver, then pasted to the unmasked elastogram for final stiffness and area measurement (bottom right of the viewing window).
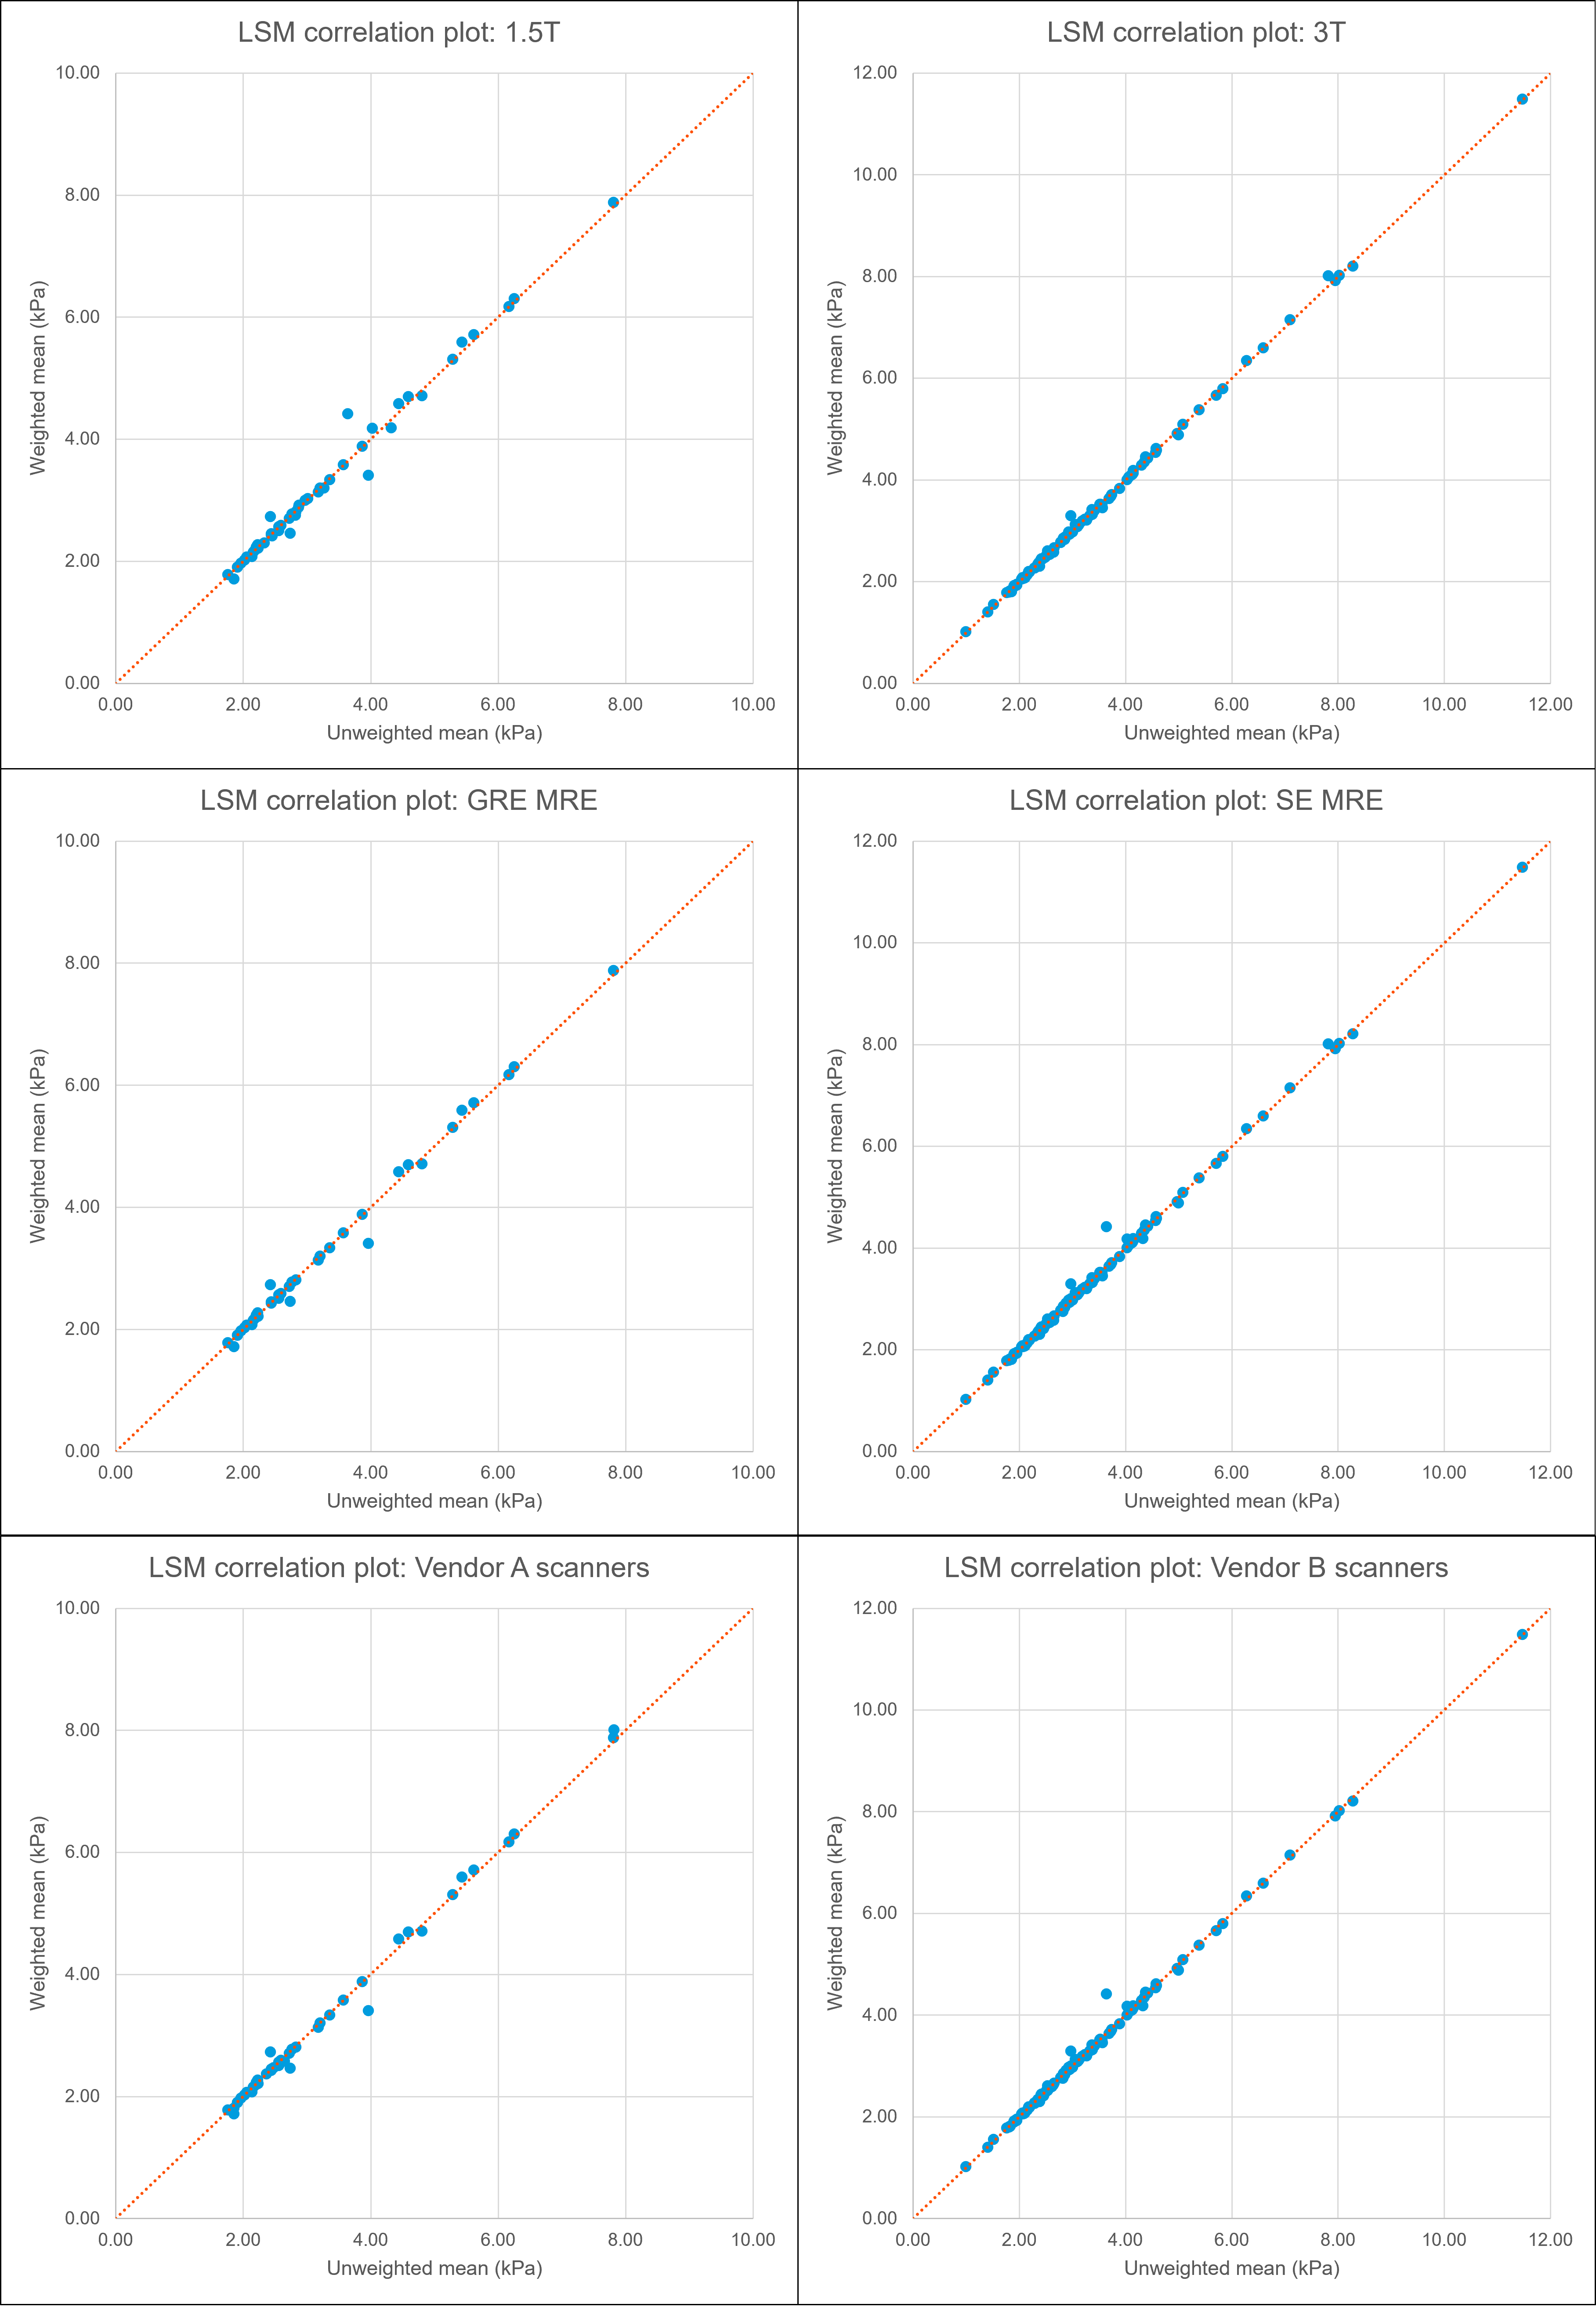
Figure 2: Correlation plot of unweighted and weighted LSM data for each analyzed patient. The data is subdivided by field strength (top row), MRE sequence type (middle row), and scanner manufacturer (bottom row). The orange trendline marks the y=x boundary, indicating where the unweighted and weighted LSMs are exactly the same; points occurring above/below this line show discrepancies between the two calculation methods.
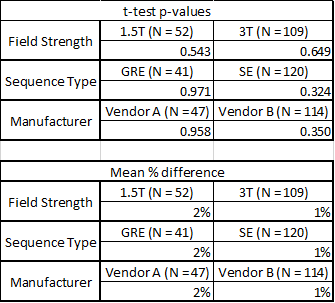
Figure 3: Summary table of p-values and calculated percentage difference of each test group.
DOI: https://doi.org/10.58530/2023/3143