3142
Pharmacokinetic Modelling of Gd-EOB-DPTA Uptake: Early Progression of NASH in A Clinically Relevant Cohort, at 1.5 and 3 T1Department of Radiation Physics, Radiology, Department of Medical and Health Sciences, Linköping University, Linköping, Sweden, 2Department of Biomedical Engineering, Linköping University, Linköping, Sweden, 3Center for Medical Image Science and Visualization (CMIV), Linköping University, Linköping, Sweden, 4Department of Clinical Pathology and Clinical Genetics, Department of Biomedical and Clinical Sciences, Linköping University, Linköping, Sweden, 5Department of Gastroenterology and Hepatology, Department of Health, Medicine and Caring Sciences, Linköping University, Linköping, Sweden
Synopsis
Keywords: Liver, Contrast Agent, NAFLD,NASH, Gd-DPTA-EOB, Pharmacokinetic Modeling
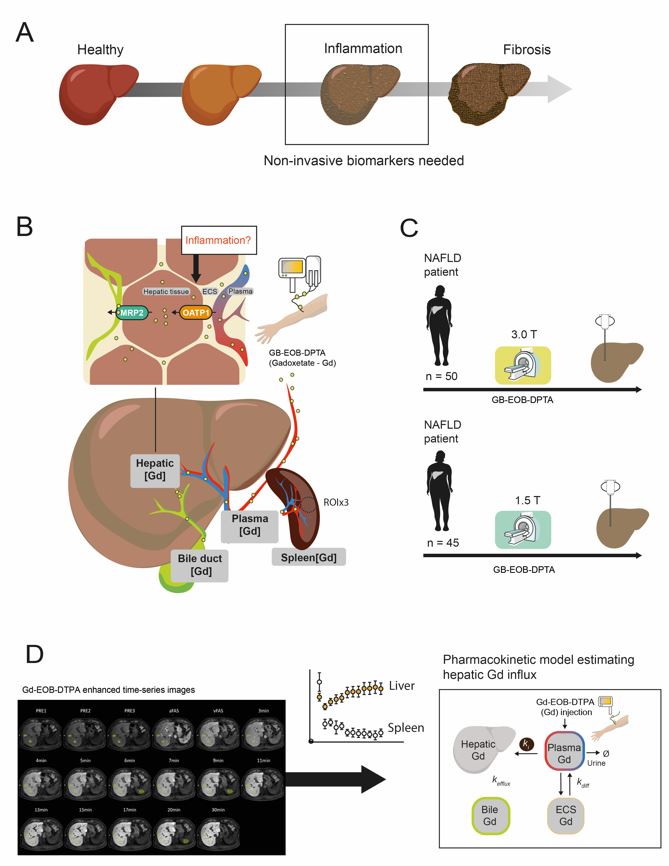
Due to the increased global prevalence of non-alcoholic fatty liver disease (NAFLD), there is a significant need for precise and non-invasive clinical methods to detect early stages of non-alcoholic steatohepatitis (NASH), which can progress to cirrhosis. We investigate the possibility of using the hepatocyte specific contrast agent Gd-EOB-DPTA based DCE-MRI in combination with mathematical modelling to assess hepatobiliary influx, as a possible biomarker for early NASH detection. We show a tentative correlation between increased portal inflammation and decreased hepatic Gd-EOB-DPTA uptake in a cohort of prospectively included patients with suspected chronic liver disease.Introduction
Due to the increased global prevalence of non-alcoholic fatty liver disease (NAFLD), there is a need for non-invasive clinical methods to detect non-alcoholic steatohepatitis (NASH) (Fig. 1A). Dynamic contrast enhanced (DCE) MRI using hepatocyte specific contrast-agent Gd-EOB-DPTA (gadoxetate) related measures have been studied in the context of NASH. Pre-clinical studies have shown that the expression of organic anion-transporter (OATP) responsible for gadoxetate-uptake (Fig. 1B) is altered in NASH [1]. For the determination of fibrosis stage and cirrhosis gadoxetate measures have been shown to be a promising imaging-based biomarker [2, 3]. Also, several studies have investigated the possibility of detecting inflammation using gadoxetate based biomarkers in NASH [4-6]. However, these studies mainly evaluated signal intensity measurements. Another common methodology is to combine high time-resolution gadoxetate images with pharmacokinetic modelling to determine hepatobiliary fluxes. Therefore, we have performed gadoxetate DCE-MRI on patients with suspected chronic liver disease undergoing liver biopsy either using a 1.5 or a 3.0 T MRI scanner. The correlation between modelling based gadoxetate biomarkers and histopathology scores for inflammation and fibrosis was investigated.Methods
Patients from two different studies of gadoxetate based DCE-MRI were included. The inclusion criteria were suspected chronic liver disease, and patients were included from both a study using 1.5 T (n=93) and from an ongoing study using 3.0 T (m=84). In this abstract we present a sub-set of these data (n=50, m=40). MRI was performed using a Philips Achieva 1.5 T or 3.0 T scanner (Philips Healthcare, Best, The Netherlands). Following a bolus injection (0.025 mmol/kg body-weight) of gadoxetate , images were acquired using a T1-weighted gradient echo two-point Dixon 3D-sequences. The post‑injection images included arterial and portal venous phases, as well as time-series images acquired e.g., between 0, and 50 minutes (Fig. 1D, left). During the same day patients underwent a liver biopsy, just after the MR-examination. In post-processing, ROIs were placed in each of the eight Couinaud-segments, plus three ROIs in the spleen by an experienced radiologist (ND). Signal intensity measurements were obtained from each ROI. From the signal intensity the T1 relaxation rate and concentration of gadoxetate was estimated for each compartment. The dataset was then used to train our previously reported whole-body pharmacokinetic model for gadoxetate hepatobiliary fluxes [7, 8], the model parameter representing the hepatic influx, ki was then used for comparison of different histopathology scores (Fig 1D, Right)Results
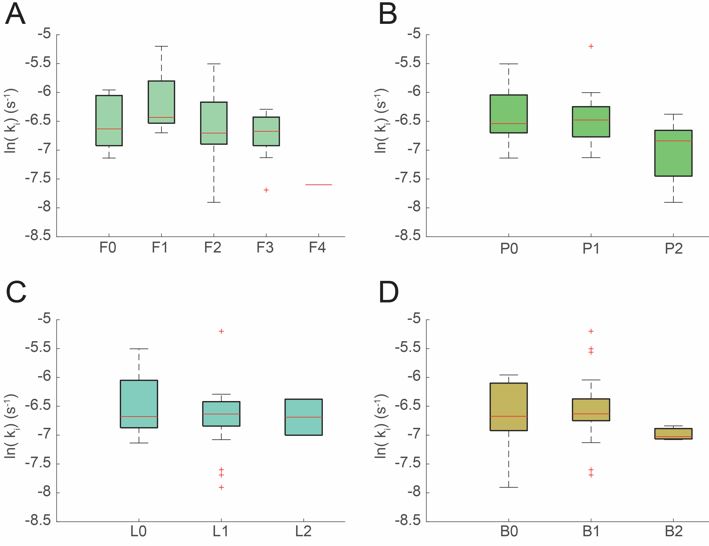
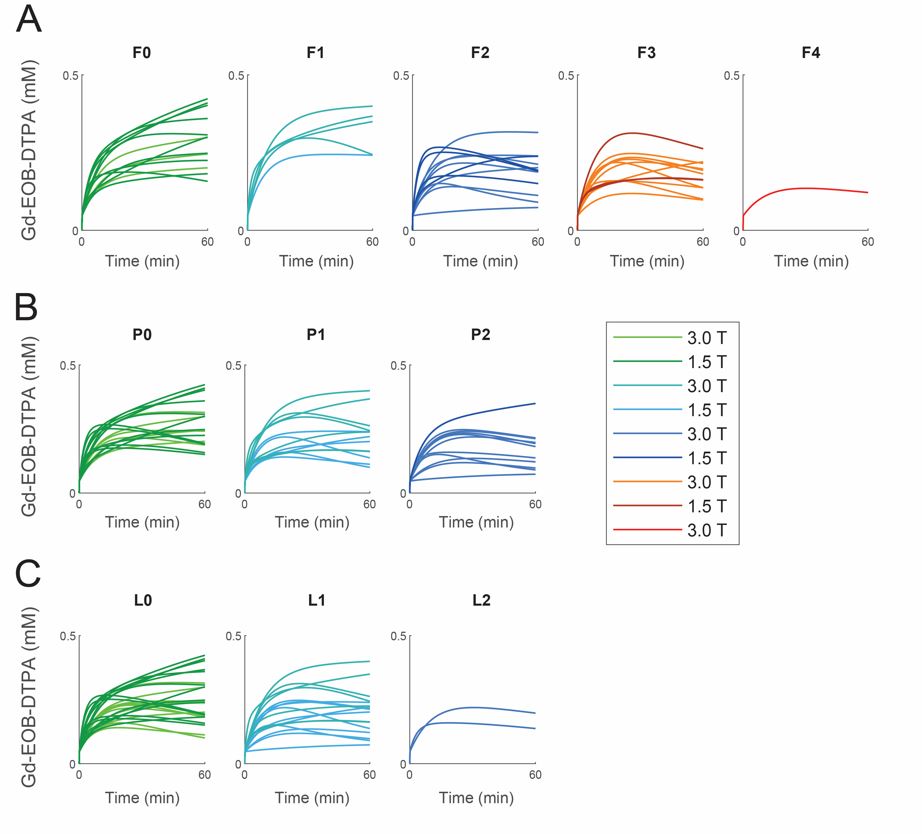
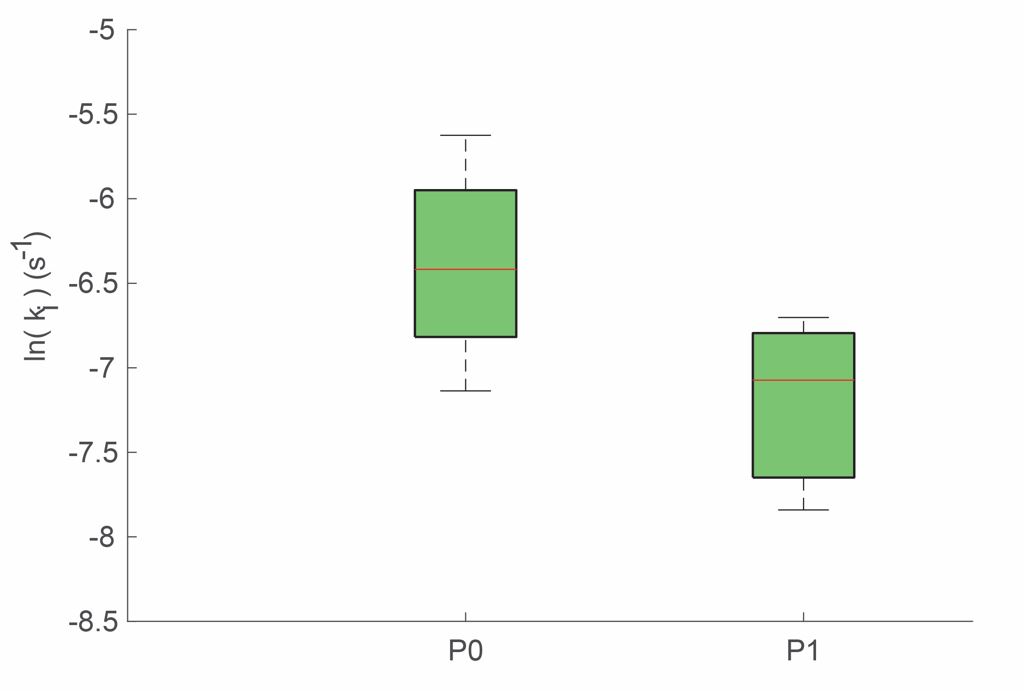
To study the effect of NAFLD related inflammation on gadoxetate uptake, patients with NAFLD were selected (n=21, m=22). The pharmacokinetic model was trained on data to yield a patient specific ki value. The ki values for all patients were included in a groupwise comparison with grouping based on histological evaluation; i.e. fibrosis stage, and grade of portal inflammation, lobular inflammation, and ballooning (Fig 2A-D). As shown, there are no significant associations. However, for higher grades of portal inflammation, a trend for a negative correlation can be seen. To investigate any differences in the dynamic of the gadoxetate uptake curve, we plotted all model simulations for the NAFLD patients using the same group-wise comparison (Fig 3A-D). No apparent difference can be seen in the uptake curve dynamics, although there seems to be a trend for lower maximal gadoxetate concentration at higher histology scores, most noticeable with increasing fibrosis stage (Fig. 3A). Simulations based on data from the 3.0 T is shown in lighter colors, and simulations based on 1.5 T data is in darker colors. No apparent differences can be seen between data acquired from different fields of strengths. Because fibrosis could be a contributing factor to changes in gadoxetate uptake, and to study the effect of only inflammation, we included all patients in the study (with various liver diseases e.g., ALD, DILI, PSC, AIH) without histological signs of fibrosis (i.e. fibrosis stage 0, n =28). Here, we could see a clear difference in ki values between the groups based on the portal inflammation (Fig. 4). However, no other associations were observed for grades of ballooning or lobular inflammation.Discussion
We have investigated the use of gadoxetate based imaging in combination with pharmacokinetic modelling as a possible biomarker for histopathological scores related to NASH. There was a negative trend between model parameter ki, and portal inflammation in the NAFLD-group; a lower ki value reflects a slower uptake rate. In comparison, in patients with F0 only (thus excluding F1 and larger), a similar trend was observed. Even mild portal inflammation suggests severe liver-disease and progression of NASH. Because of the possibly spatial heterogeneity of the disease, and because we here only focus on the overall uptake rates (the mean value of all ROIs placed in the liver), the reduced influx suggests a restricted access, i.e., fibrosis in other parts of the liver. However, hepatocyte damage caused by portal inflammation may also reduce hepatic uptake function. In conclusion, the effects of inflammation on hepatic gadoxetate uptake suggests that more investigations need to be performed, especially when we have a focus on early signs of inflammation. Thus, in future work we will include up to 200 subjects. Alternative intensity-based measures of liver uptake function also need to be explored.Acknowledgements
No acknowledgement found.References
Clarke, J.D., et al., Synergistic interaction between genetics and disease on pravastatin disposition. Journal of Hepatology, 2014. 61(1): p. 139-147.
2. Verloh, N., et al., Detecting liver fibrosis with Gd-EOB-DTPA-enhanced MRI: A confirmatory study. Scientific Reports, 2018. 8(1): p. 6207.
3. Norén, B., et al., Separation of advanced from mild hepatic fibrosis by quantification of the hepatobiliary uptake of Gd-EOB-DTPA. Eur Radiol, 2013. 23(1): p. 174-181.
4. Amorim, V.B., et al., Can gadoxetic acid–enhanced magnetic resonance imaging be used to avoid liver biopsy in patients with nonalcoholic fatty liver disease? World Journal of Hepatology, 2020. 12(9): p. 661-671.
5. Bastati, N., et al., Noninvasive Differentiation of Simple Steatosis and Steatohepatitis by Using Gadoxetic Acid–enhanced MR Imaging in Patients with Nonalcoholic Fatty Liver Disease: A Proof-of-Concept Study. Radiology, 2014. 271(3): p. 739-747.
6. Verloh, N., et al., Influence of hepatic fibrosis and inflammation: Correlation between histopathological changes and Gd-EOB-DTPA-enhanced MR imaging. PLoS One, 2019. 14(5): p. e0215752.
7. Forsgren, M.F., et al., Physiologically realistic and validated mathematical liver model revels hepatobiliary transfer rates for Gd-EOB-DTPA using human DCE-MRI data. PLoS ONE, 2014. 9(4): p. e104570.
8. Forsgren, M.F., et al., Model-inferred mechanisms of liver function from magnetic resonance imaging data: Validation and variation across a clinically relevant cohort. PLOS Computational Biology, 2019. 15(6): p. e1007157.
Figures