3141
Stratification of Liver Histologic Fibrosis using Machine Learning on MRI Radiomic Data and Clinical Features1Cincinnati Children's Hospital Medical Center, Cincinnati, OH, United States, 2University of Wisconsin-Madison, Madison, WI, United States, 3Michigan Medicine, University of Michigan, Ann Arbor, MI, United States, 4NYU Langone Health, New York, NY, United States
Synopsis
Keywords: Liver, Liver, Liver fibrosis, biopsy
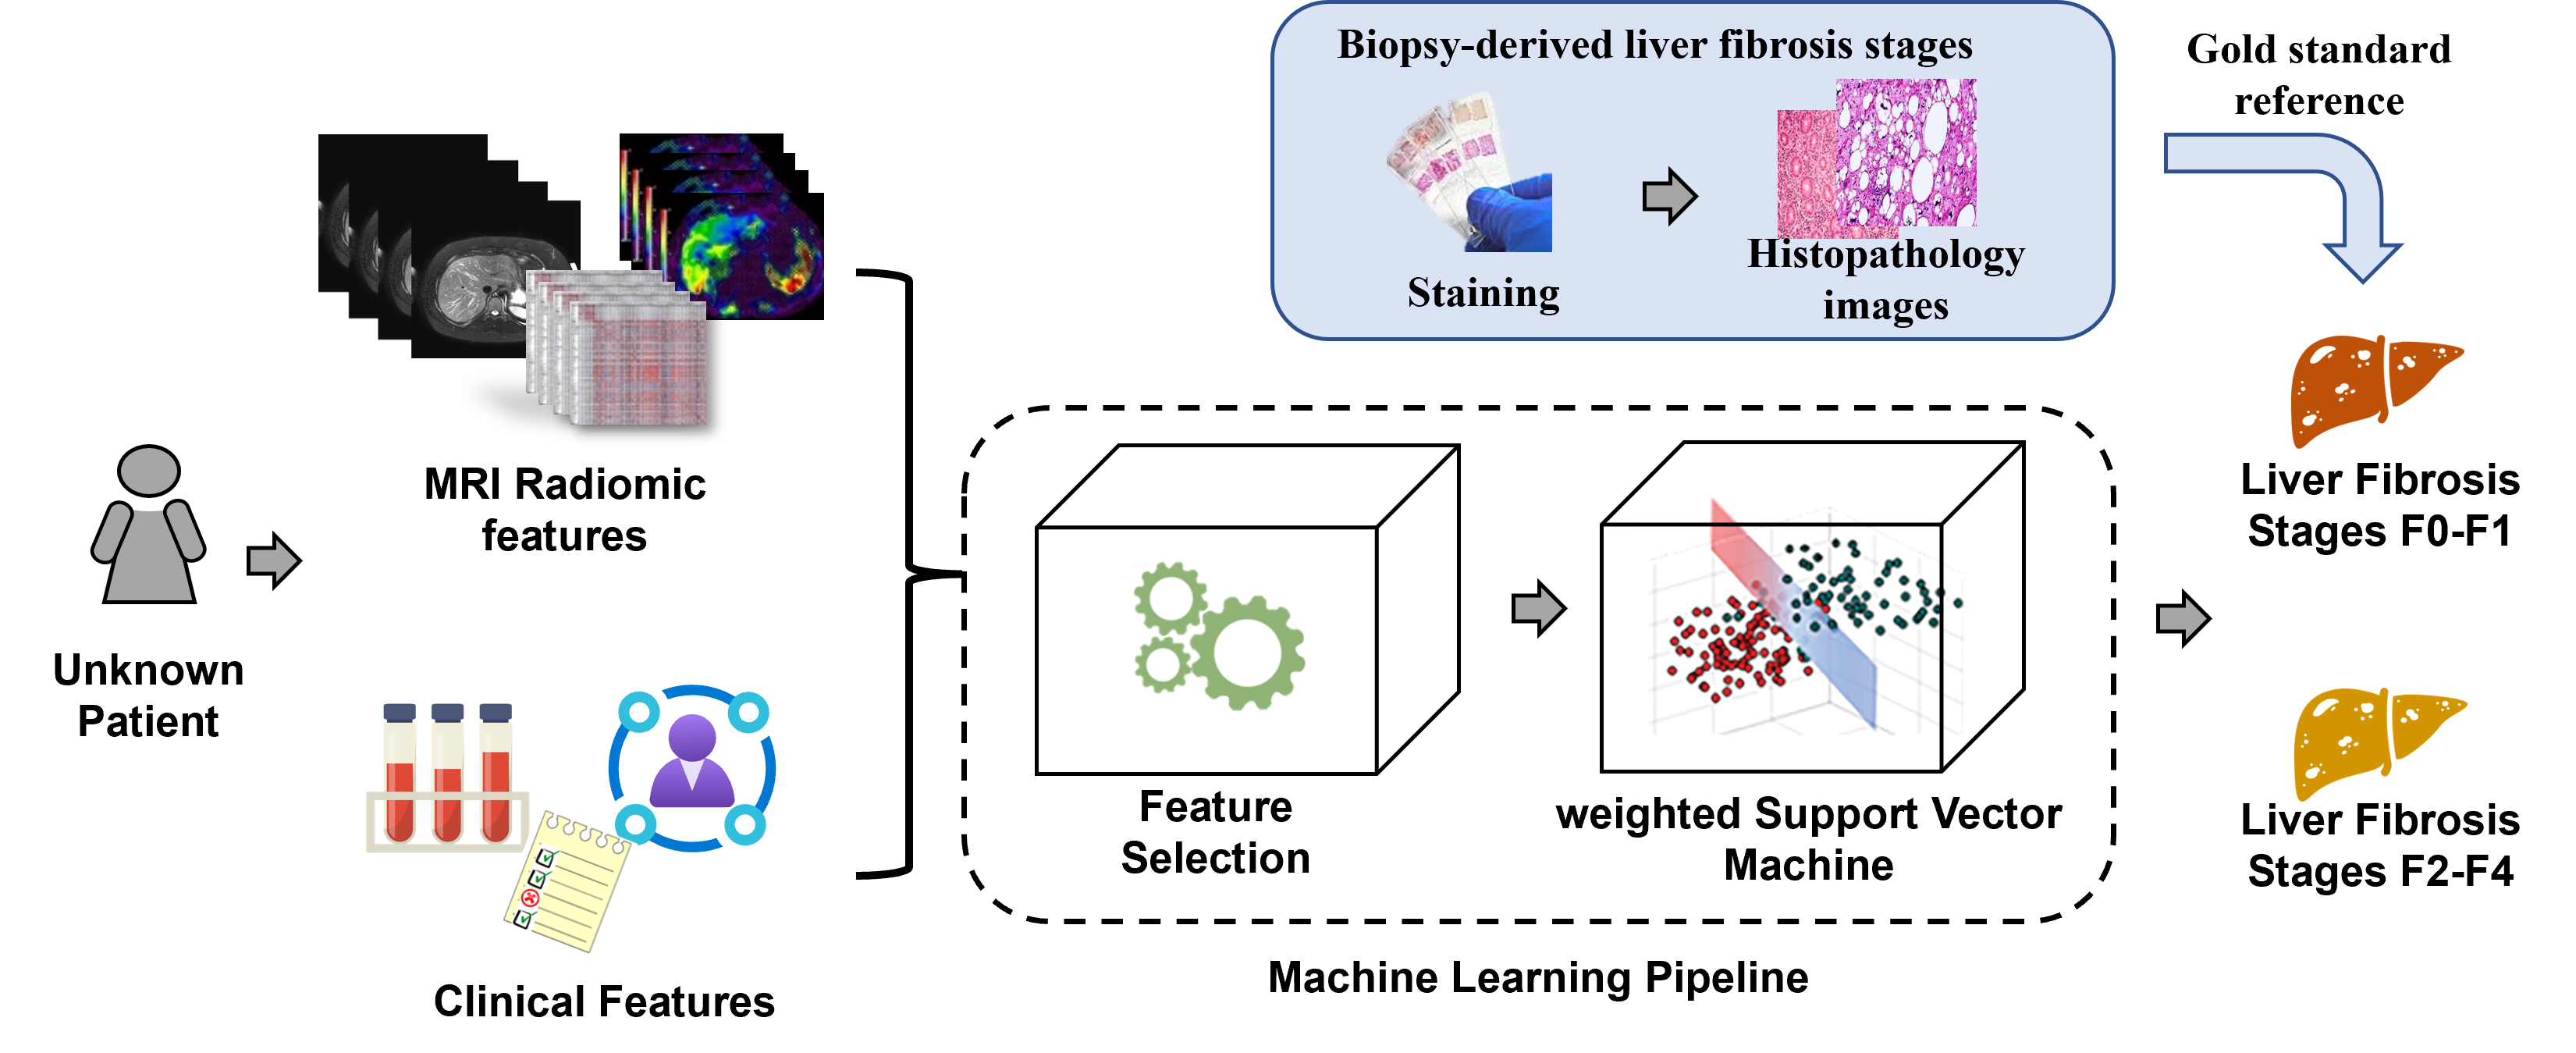
Chronic liver diseases can lead to variable amounts of liver fibrosis, which impacts patient management and outcomes. Percutaneous liver biopsy is the clinical reference standard for assessment of liver fibrosis. However, biopsy is subject to sampling errors and poor patient acceptance. The aim of this study is to develop machine learning models to stratify the severity of biopsy-derived liver fibrosis using MR radiomic data and clinical data. Using clinical, routinely collected MRI and clinical data, our machine learning was able to stratify the severity of liver fibrosis with an AUROC of 0.71, demonstrating the feasibility of the machine learning approaches.Introduction
Chronic liver disease (CLD) is a common cause of morbidity and mortality in both children and adults [1-3]. In the current clinical practice, CLD is often assessed using a combination of clinical history, physical examination, laboratory testing, biopsy with histopathologic assessment, and imaging [3]. Most forms of CLD can lead to progressive liver fibrosis, the single histological feature that predicts outcomes and drives treatment decisions [4]. Percutaneous liver biopsy is the clinical reference standard for assessing liver fibrosis, although it suffers from sampling variability, and is invasive with a risk of bleeding, infection, and injury. There is increasing published literature showing that machine learning techniques can be used to evaluate radiologic images [5-8]. This study aims to develop machine learning models to stratify the severity of biopsy-derived liver histologic fibrosis using MR radiomic data and clinical features from pediatric and young adult patients (Figure 1).Methods
Study cohortThis HIPAA-compliant retrospective study was institutional review board-approved, and a waiver of informed consent was granted. By matching electronic medical records from our institutional Department of Radiology Picture Archiving and Communication System (PACS) system and Department of Pathology records, we identified a cohort of 174 subjects, who had related MRI data, clinical data, and liver biopsy tissue all available. (Table 1)
Biopsy-derived liver fibrosis staging
For each patient, the METAVIR histologic liver fibrosis score (F0-F4) was determined by a fellowship-trained liver pathologist. Specifically, tissue specimens were recut from stored paraffin blocks and underwent staining in a batch using a fibrosis-specific Masson’s trichrome stain. We placed subjects into two groups: no/mild liver fibrosis (F0-F1) or moderate/severe liver fibrosis (F2-F4), which served as the reference standard for machine learning model development.
MR radiomic data
We considered both prior knowledge-based and agnostic MR radiomic data [9]. Prior knowledge-based features are those biomarkers investigated by prior research studies. In this work, we retrieved liver volume (ml), Proton Density Fat Fraction (PDFF, %), and liver shear stiffness (kPa). Liver volume was calculated using axial T2-weighted fast spin-echo fat-saturated MRI images. PDFF was acquired using a 3D confounder-corrected chemical shift-encoded Dixon technique (mDixon Quant, Philips Healthcare and IDEAL IQ, GE Healthcare) [10]. Liver stiffness was estimated from the mean of four anatomic sections through the mid liver using an MR elastography (MRE) technique [11].
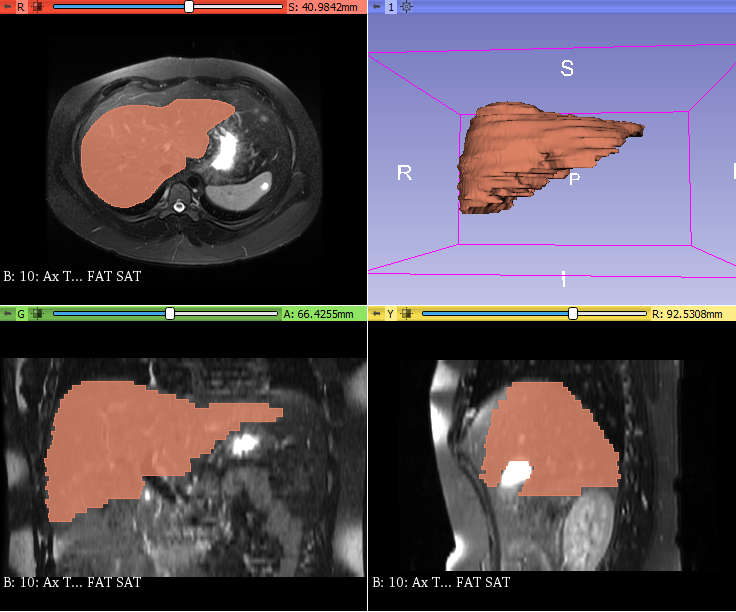
Agnostic MR radiomic features are mathematically extracted quantitative features. A data analyst supervised by a board-certified radiologist manually segmented livers on axial T2-weighted fast spin-echo fat-saturated MRI images using 3D Slicer (version 4.11). (Figure 2) Then, we used PyRadiomics (version 3.0.1) to extract 100 agnostic features from segmented livers. This resulted in 14 shape features, 18 first-order histogram features of signal intensity distribution, and 68 second-order texture features (i.e., 14 features from the gray-level dependence matrix, 22 features from the gray-level co-occurrence matrix, 16 features from the gray-level run-length matrix, and 16 features from the gray-level size zone matrix).
Clinical data
For each patient, 34 clinical features within 12 months of the MRI examination were retrieved. Clinical features were mainly from three categories: demographic and anthropomorphic data (e.g., age, sex, and weight), medical history / diagnoses (e.g., nonalcoholic fatty liver disease), and laboratory blood testing (e.g., aspartate aminotransferase, bilirubin, and albumin).
Machine learning models
MRI radiomic data and clinical features were utilized for machine learning models. To prevent model overfitting, we conducted feature selection using LASSO model.[12] Given the selected radiomics data and liver fibrosis scores, a weighted Support Vector Machine (SVM) model was trained to classify a given patient into either a no/mild (F0-F1) or moderate/severe (F2-F4) liver fibrosis group. We applied a nested 10-fold cross-validation and repeated 50 cross-validation experiments, and assessed the model using accuracy, sensitivity, specificity, and AUROC.
Results
Our model using only MRI radiomic data achieved a mean accuracy of 64.7% and AUROC of 0.70. (Table 2) Using clinical features only, our model was able to achieve a mean accuracy of 62.4% and AUROC of 0.68. Using combined radiomic and clinical features, the model was able to classify patients with a mean accuracy of 66.0% and AUROC of 0.71.After model training, we performed feature ranking using the best SVM model. The top discriminative feature was the MRE-derived liver stiffness, which has been recognized to be correlated with liver fibrosis staging. The second ranked feature was the Large Dependence Low Gray Level Emphasis, an agnostic texture feature calculated from Gray Level Dependance Matrix to measure the joint distribution of large dependence with lower gray-level values. The third feature was the blood alkaline phosphatase measurement (U/L), an enzyme that increases with hepatobiliary injury.
Discussion and Conclusion
This study demonstrates a potential strategy of reducing the need for liver biopsy procedures. Using MR radiomic data and clinical data, a machine learning model was able to stratify the severity of liver fibrosis with an AUROC of 0.71. Once the strategy is validated, one can use combined non-invasive MRI and clinical data to guide the care of patients with CLD. Future studies will also incorporate additional patients from multiple centers, radiomic features from T1-weighted and diffusion-weighted images, and radiomic features from spleen into our machine-learning models.Acknowledgements
This work was supported by the National Institutes of Health [R01-EB030582, R01-EB029944, R01-NS094200, and R01-NS096037]; Academic and Research Committee (ARC) Awards of Cincinnati Children's Hospital Medical Center. The funders played no role in the design, analysis, or presentation of the findings.References
1. Chalasani, N., et al., The diagnosis and management of nonalcoholic fatty liver disease: practice guidance from the American Association for the Study of Liver Diseases. Hepatology, 2018. 67(1): p. 328-357.
2. Lavanchy, D., The global burden of hepatitis C. Liver international, 2009. 29: p. 74-81.
3. Tapper, E.B. and A.S.-F. Lok, Use of liver imaging and biopsy in clinical practice. New England Journal of Medicine, 2017. 377(8): p. 756-768.
4. Lai, M. and N.H. Afdhal, Liver Fibrosis Determination. Gastroenterol Clin North Am, 2019. 48(2): p. 281-289.
5. Li, H., et al., DeepLiverNet: a deep transfer learning model for classifying liver stiffness using clinical and T2-weighted magnetic resonance imaging data in children and young adults. Pediatr Radiol, 2020.
6. He, L., et al., Machine Learning Prediction of Liver Stiffness Using Clinical and T2-Weighted MRI Radiomic Data. American Journal of Roentgenology, 2019. 213(3): p. 1-10.
7. Trout, A.T., et al., Diagnostic performance of MR elastography for liver fibrosis in children and young adults with a spectrum of liver diseases. Radiology, 2018. 287(3): p. 824-832.
8. Wang, K., et al., Deep learning Radiomics of shear wave elastography significantly improved diagnostic performance for assessing liver fibrosis in chronic hepatitis B: a prospective multicentre study. Gut, 2019. 68(4): p. 729-741.
9. Gillies, R.J., P.E. Kinahan, and H. Hricak, Radiomics: Images Are More than Pictures, They Are Data. Radiology, 2016. 278(2): p. 563-77.
10. Dillman, J.R., et al., Quantification of Hepatic Steatosis by Ultrasound: Prospective Comparison With MRI Proton Density Fat Fraction as Reference Standard. AJR Am J Roentgenol, 2022: p. 1-8.
11. Serai, S.D., J.R. Dillman, and A.T. Trout, Spin-echo echo-planar imaging MR elastography versus gradient-echo MR elastography for assessment of liver stiffness in children and young adults suspected of having liver disease. Radiology, 2016. 282(3): p. 761-770.
12. Tibshirani, R., Regression shrinkage and selection via the lasso. Journal of the Royal Statistical Society. Series B (Methodological), 1996: p. 267-288.
Figures