3140
Characterising the effect of free breathing on abdominal MR Spectroscopy and impact on X-nuclei spectra.1University of Nottingham, Nottingham, United Kingdom, 2NIHR Nottingham Biomedical Research Centre, Nottingham University hospitals NHS trust, Nottingham, United Kingdom
Synopsis
Keywords: Liver, Spectroscopy
Multinuclear spectroscopy requires the use of free breathing acquisitions to achieve acceptable SNR. Here proton spectroscopy is used as an analogue for multinuclear MRS along with dynamic phase imaging to characterise the effect of respiration. Consistent agreement was seen between the respiratory bellows trace and the timeseries of the water peak frequency and imaging field offset, with overlapping primary frequencies on respective Fourier transforms. On free breathing a maximum frequency shift of 31Hz was measured, this equates to a 0.24ppm shift which could cause significant line broadening in the spectra of multinuclear 31P and 13C liver experiments.Introduction
Multinuclear MRS of the liver is increasingly used to understand the body’s metabolic process and characterise diseases such as Type-II-Diabetes1,2. Due to the low natural abundance of MR visible nuclei, multiple averages are needed, so spectra are usually acquired during free-breathing1,2,3. However, the impact of free breathing on the spectral line width has not been studied in detail. Here, proton (1H) spectroscopy is used as an analogue for X-nuclei to allow high SNR spectral data to be obtained for the assessment of the effects of respiration on spectral peaks. The results are corroborated with B0 field maps and extrapolated to X-nuclei applications.Methods
Acquisition: Six participants (23-30yrs, BMI 21-30kg/m3) were scanned on a Philips Achieva 3T. To model the effect of unlocalized surface coil acquisitions (as is common in multinuclear MRS scanning), proton data were collected using a butterfly 1H quadrature surface coil (Pulseteq, Surrey) placed centrally over the liver. A respiratory belt was placed over the diaphragm to record the respiratory trace.Data collected comprised: 1) Dynamic free breathing non-localised 1H spectroscopy (TR=350ms) of 1800 spectra); 2) Free-breathing single slice single echo FFE scheme images (FFE TE/TR=2/4ms, image acquisition time 532 ms to encode the breathing cycle, 1200dynamics) with magnitude and phase data saved to dynamically study respiratory-induced field offsets; 3) Dual-echo FFE (TE/DTE =2.3/2.3ms, 12 slices) scanner-generated B0 maps and magnitude data acquired on inspiration and expiration breath-holds, these data sets were collected using both the 1H decoupling coil of the 13C surface coil and the Q-body coil.
Spectral Analysis. Spectra were phase corrected in JMRUI and AMRES was used to quantify the water peak frequency. This was extracted and imported into MATLAB (MathWorks). A time series of the water peak frequency was generated (fpeak(t)) and this was overlayed on the signal from the respiratory bellows; both signals were Fourier transformed.
Image Analysis: The pipeline is shown in Fig.1. The free-breathing time-series of phase images $$$\phi \left ( r,t \right )$$$ were unwrapped4,5. The magnitude image time series was normalised and masked to remove adipose fat under the coil and voxels below the noise floor (mask generated in MRIcron). These normalised images indicated the weighting of signals from different parts of the liver in spectral signals collected with the same coil,$$$\omega\left ( r,t \right )$$$.A weighted phase evolution time series was then computed $$$ \left ( \omega\left ( r,t \right ) \phi \left ( r,t \right )\right ) $$$. A stack of line profiles through the liver across dynamics was created to demonstrate the effect of respiration. The maps of weighted phase evolution were then converted to a time-series of weighted field offsets $$$B_{0}\left ( t \right )= \frac{\sum \omega \left ( r \right )\phi \left ( r \right )}{TE\sum \omega \left ( r \right )} $$$which were overlaid on the respiratory bellows; as above, both signals were Fourier transformed. This field offset provides an imaging comparator to the frequency shift measured from the spectral analysis.
In addition, for the breath-held B0 maps collected using the 1H decoupling coil, the weighted field offset was computed between inspiration and expiration. The magnitude images from the Q-body breath-held B0 maps were segmented to determine lung volume (3-class segmentation in FAST, FSL with lung cluster identification).
Binning the spectral fpeak(t) and imaging B0(t) datasets into inspiration and expiration phases: First any point greater than two standard deviations above the mean was discarded. Next peaks/troughs that were >30% above/below the mean, which from the comparison with the bellows data corresponded to inspiration/expiration respectively, were used for moving subtractions of (inspiration – expiration) for fpeak(t) and B0(t) to compute the mean shifts during free breathing.
Results
Fig.2 shows the agreement between the bellows trace and the time-series of the water peak frequency fpeak(t) across participants, confirmed to oscillate at the same primary frequency by the Fourier transform. Fig.3 shows analogous results for the imaging field offset time-series B0(t). Mean free breathing spectral shifts ranged from 10-31Hz, and imaging field offsets ranged from 6-31Hz across subjects (Fig.4). The B0 maps collected on inspiration and expiration showed consistently larger field shifts, ranging from 16-13Hz, with changes linked to the change in lung volume between inspiration and expiration (Fig.5).Discussion
Many multinuclear spectroscopy experiments utilise free breathing to collect multiple acquisitions and increase SNR. This study investigated this approach by using the increased SNR of proton MRS to study the impact of free breathing on the spectral shift of the water peak and compare this to field offsets measured using imaging. Shifts in spectral resonant frequency and field offsets followed the respiratory cycle with good agreement, with a maximum shift during free breathing of 31Hz (0.24ppm). The field offsets were mostly smaller than the spectral frequency shifts, a likely cause being the single-slice dynamic field maps; slightly larger field shifts may occur in a different region.At 3T, 31P metabolite linewidths range from 0.34-0.73ppm6, meaning shifts of 0.24ppm during free breathing could cause significant line broadening in some experiments. This work provides key information needed to design dynamic shim systems to overcome respiratory-induced field shifts in the liver; in particular, the spatial variations in the field maps can be used to design dynamic shim gradient coils.
Acknowledgements
Thank you to the MRC IMPACT DTP for funding this project.References
1. Valkovič L, Chmelík M, Krššák M. In-vivo31P-MRS of skeletal muscle and liver: A way for non-invasive assessment of their metabolism. Anal Biochem. 2017 Jul 15;529:193-215. doi: 10.1016/j.ab.2017.01.018. Epub 2017 Jan 21. PMID: 28119063; PMCID: PMC5478074.
2. Bawden S, Stephenson M, Falcone Y, Lingaya M, Ciampi E, Hunter K, Bligh F, Schirra J, Taylor M, Morris P, Macdonald I. Increased liver fat and glycogen stores after consumption of high versus low glycaemic index food: A randomized crossover study. Diabetes, Obesity and Metabolism. 2017 Jan;19(1):70-7.
3.Bawden S, H.K., Marciani L, Glover P, Morris P, Gowland P, Surface coil sensitivity of 13C Magentic Resonance Spectroscopy at 3T: A comparison of static field approximations, phantom repositioning and MRSI data. Proceedings 20th Scientific Meeting of the British Chapter of ISMRM, 2014.
4. M. A. Herraez, D. R. Burton, M. J. Lalor, and M. A. Gdeisat, “Fast two-dimensional phase-unwrapping algorithm based on sorting by reliability following a noncontinuous path”, Applied Optics, Vol. 41, Issue 35, pp. 7437-7444 (2002).
5. M. F. Kasim, “Fast 2D phase unwrapping implementation in MATLAB”, https://github.com/mfkasim91/unwrap_phase/ (2017)
6. Schmid AI, Chmelík M, Szendroedi J, Krššák M, Brehm A, Moser E, Roden M. Quantitative ATP synthesis in human liver measured by localized 31P spectroscopy using the magnetization transfer experiment. NMR in biomedicine. 2008 Jun;21(5):437-43.
Figures
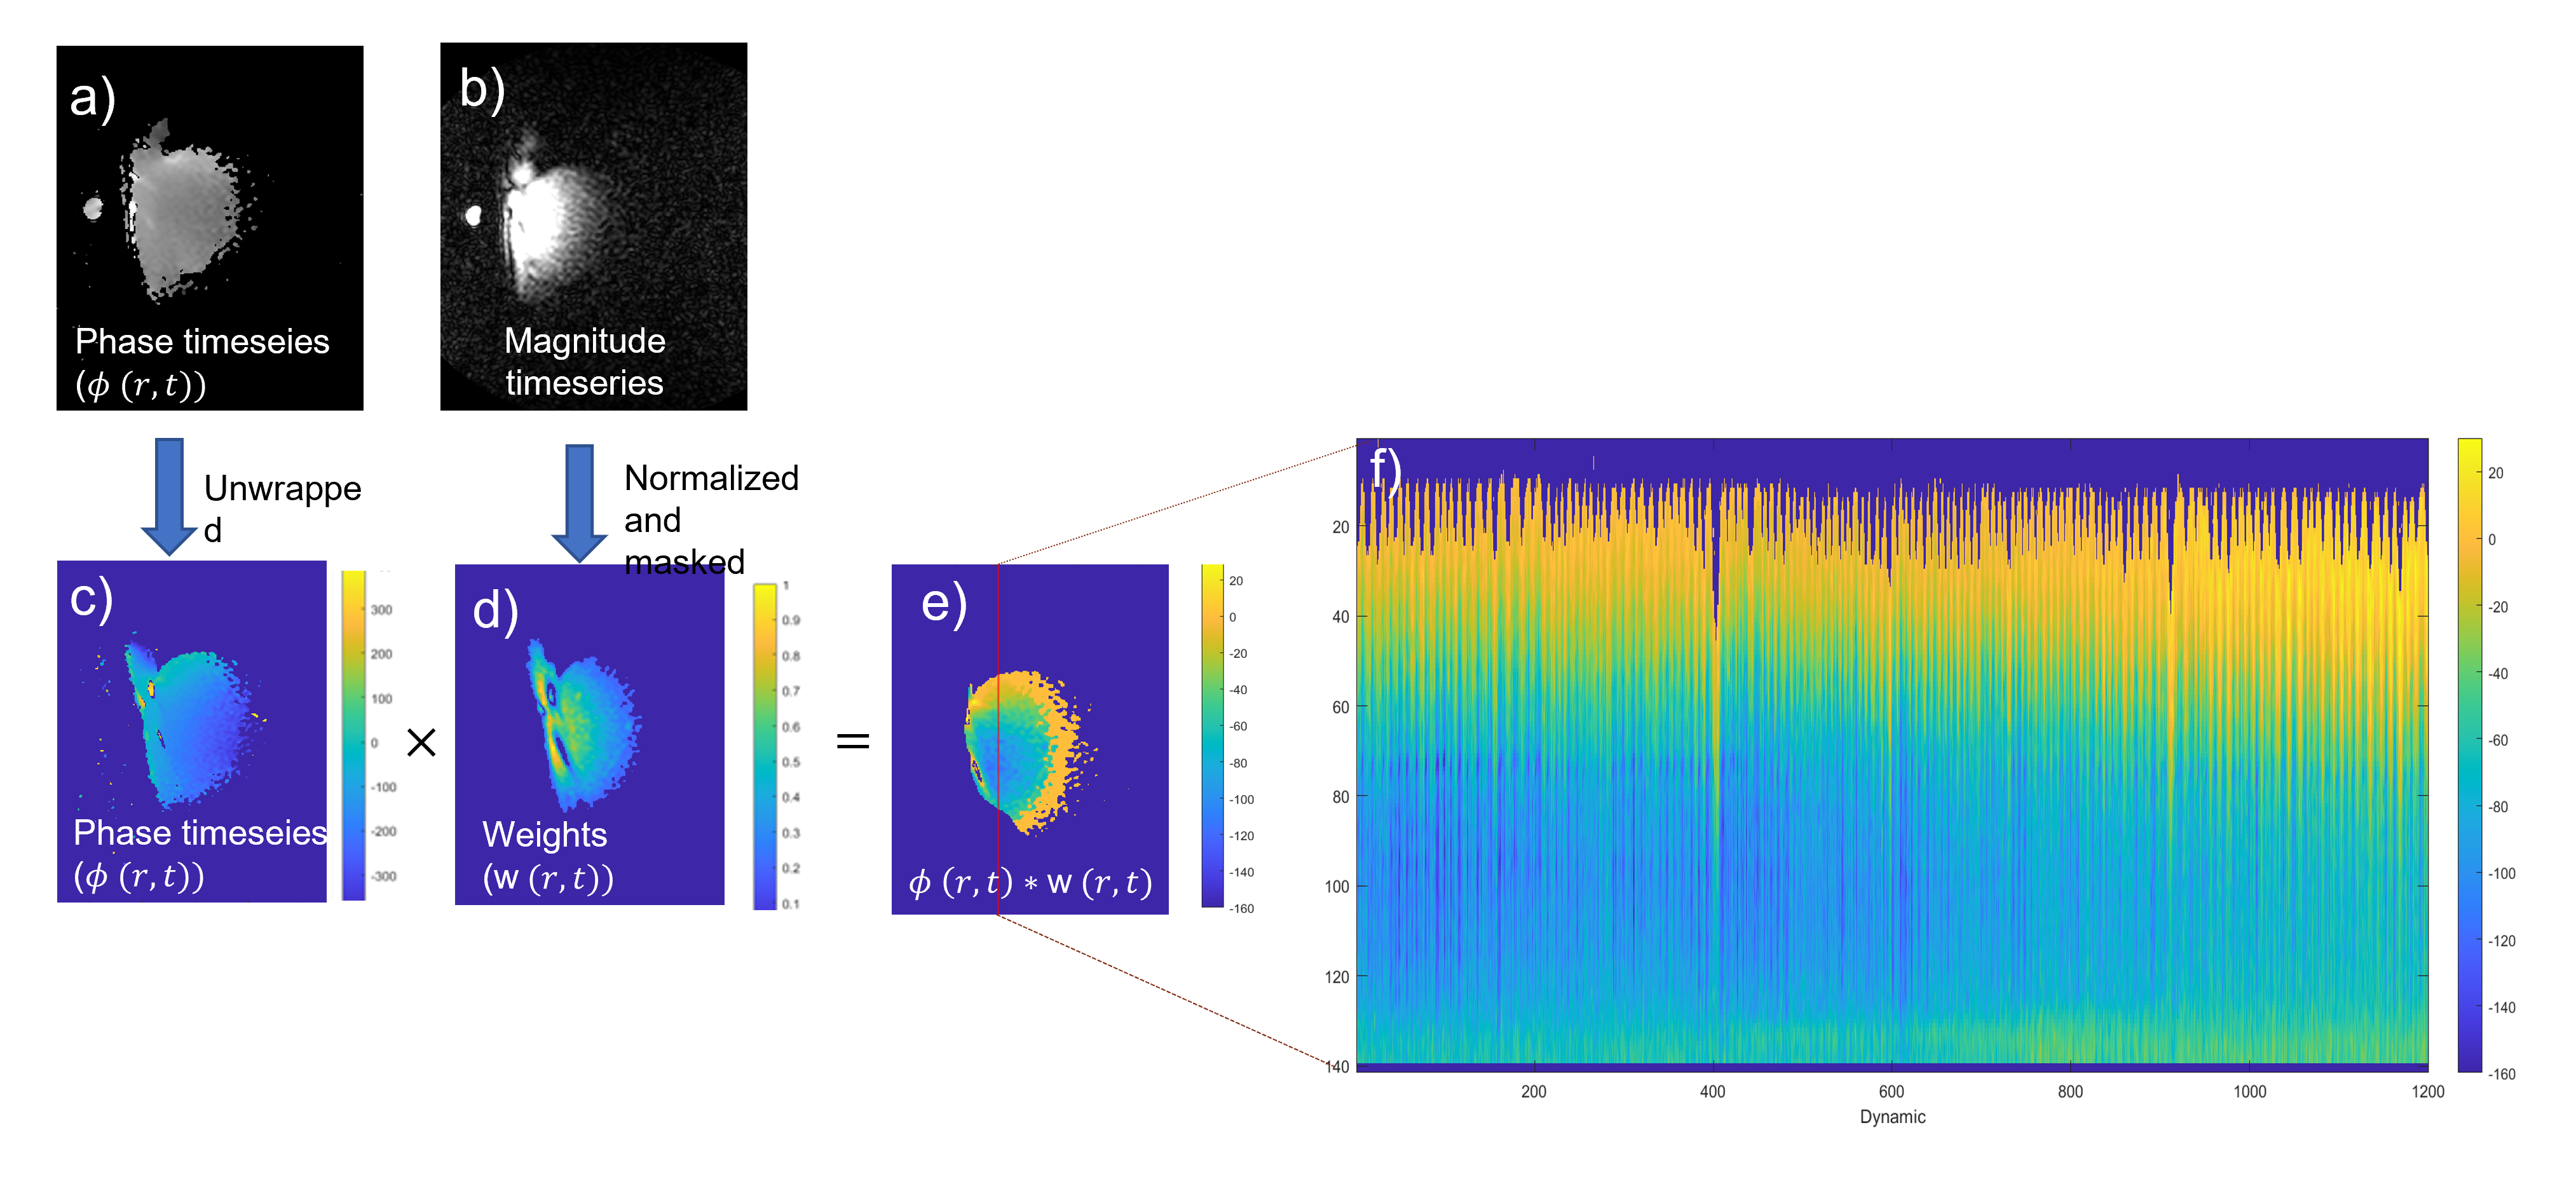
Figure 1. Analysis of free breathing imaging data showing a) phase and b) magnitude timeseries. The phase data is c) unwrapped and multiplied by d) the normalised magnitude image $$$\omega\left ( r,t \right )$$$ to generate e) a weighted phase timeseries. The red line shows the line profile used in f) to plot the time course of the weighted phase data $$$\left ( \omega\left ( r,t \right ) \phi \left ( r,t \right )\right )$$$ within the liver, which can be seen to be modulated by the respiratory cycle.
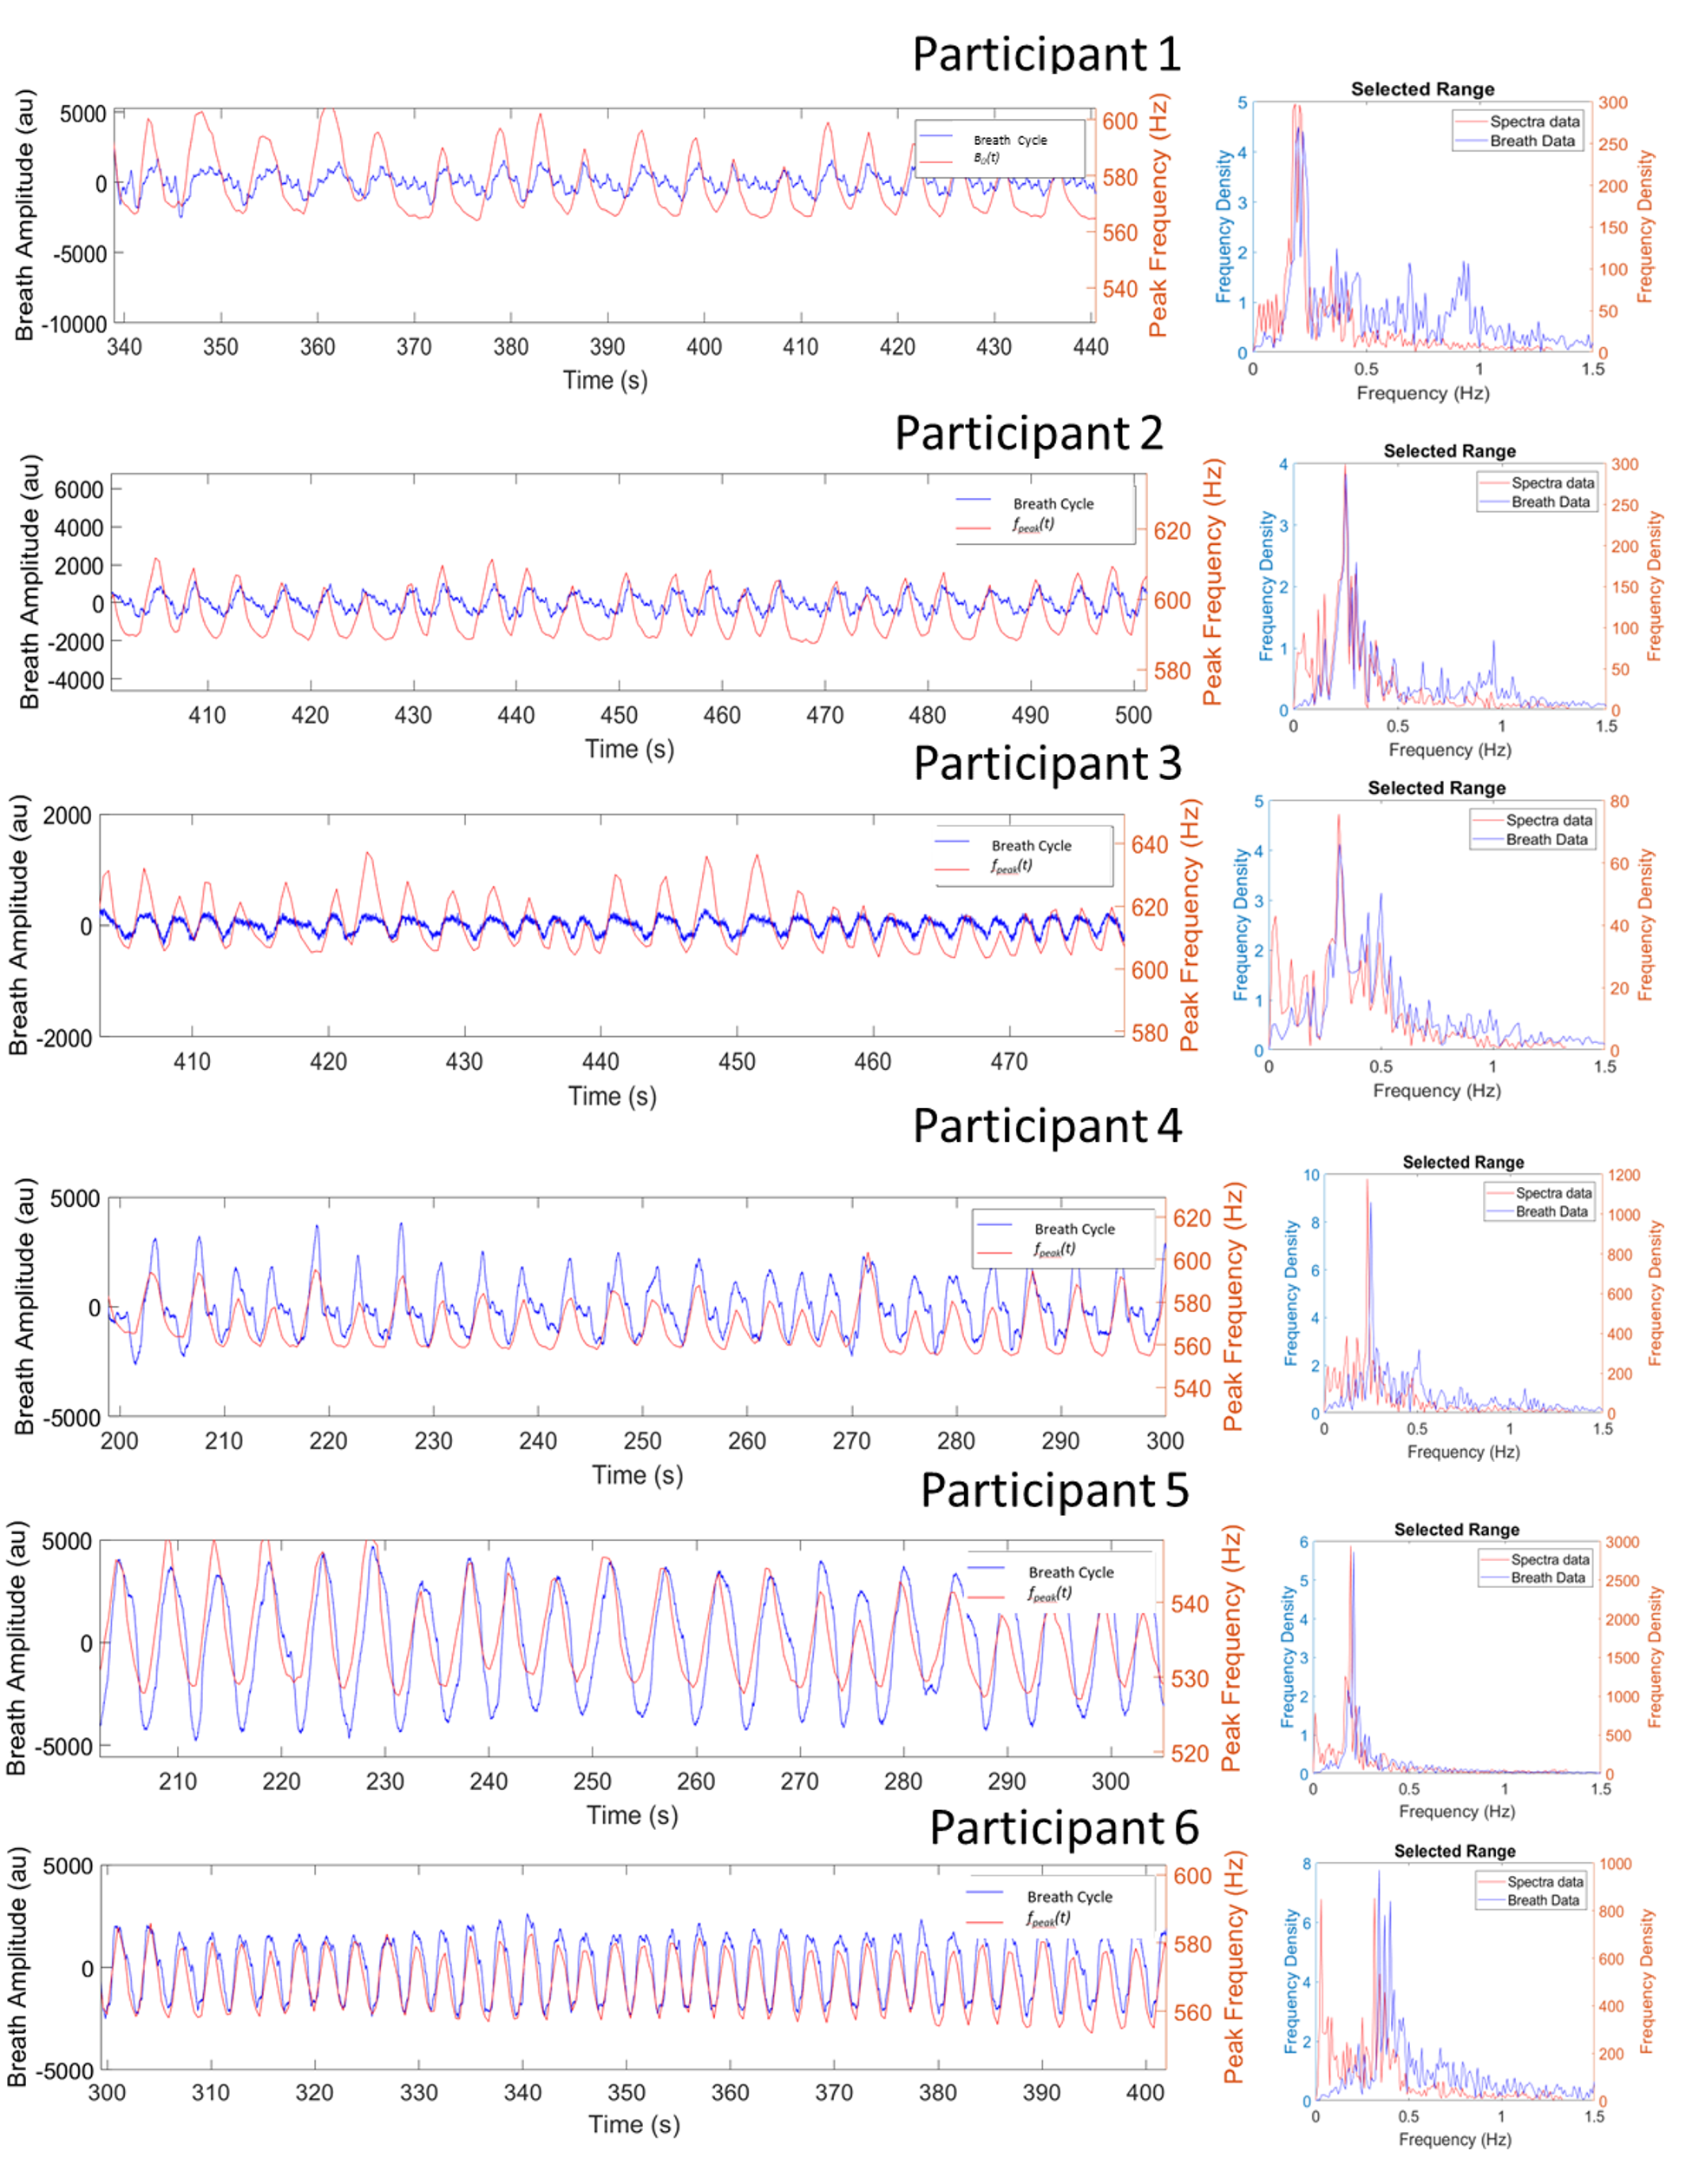
Figure 2. Alignment of each participants respiratory bellows trace and spectra water peak frequency fpeak(t) and the Fourier transform showing matched primary frequency.
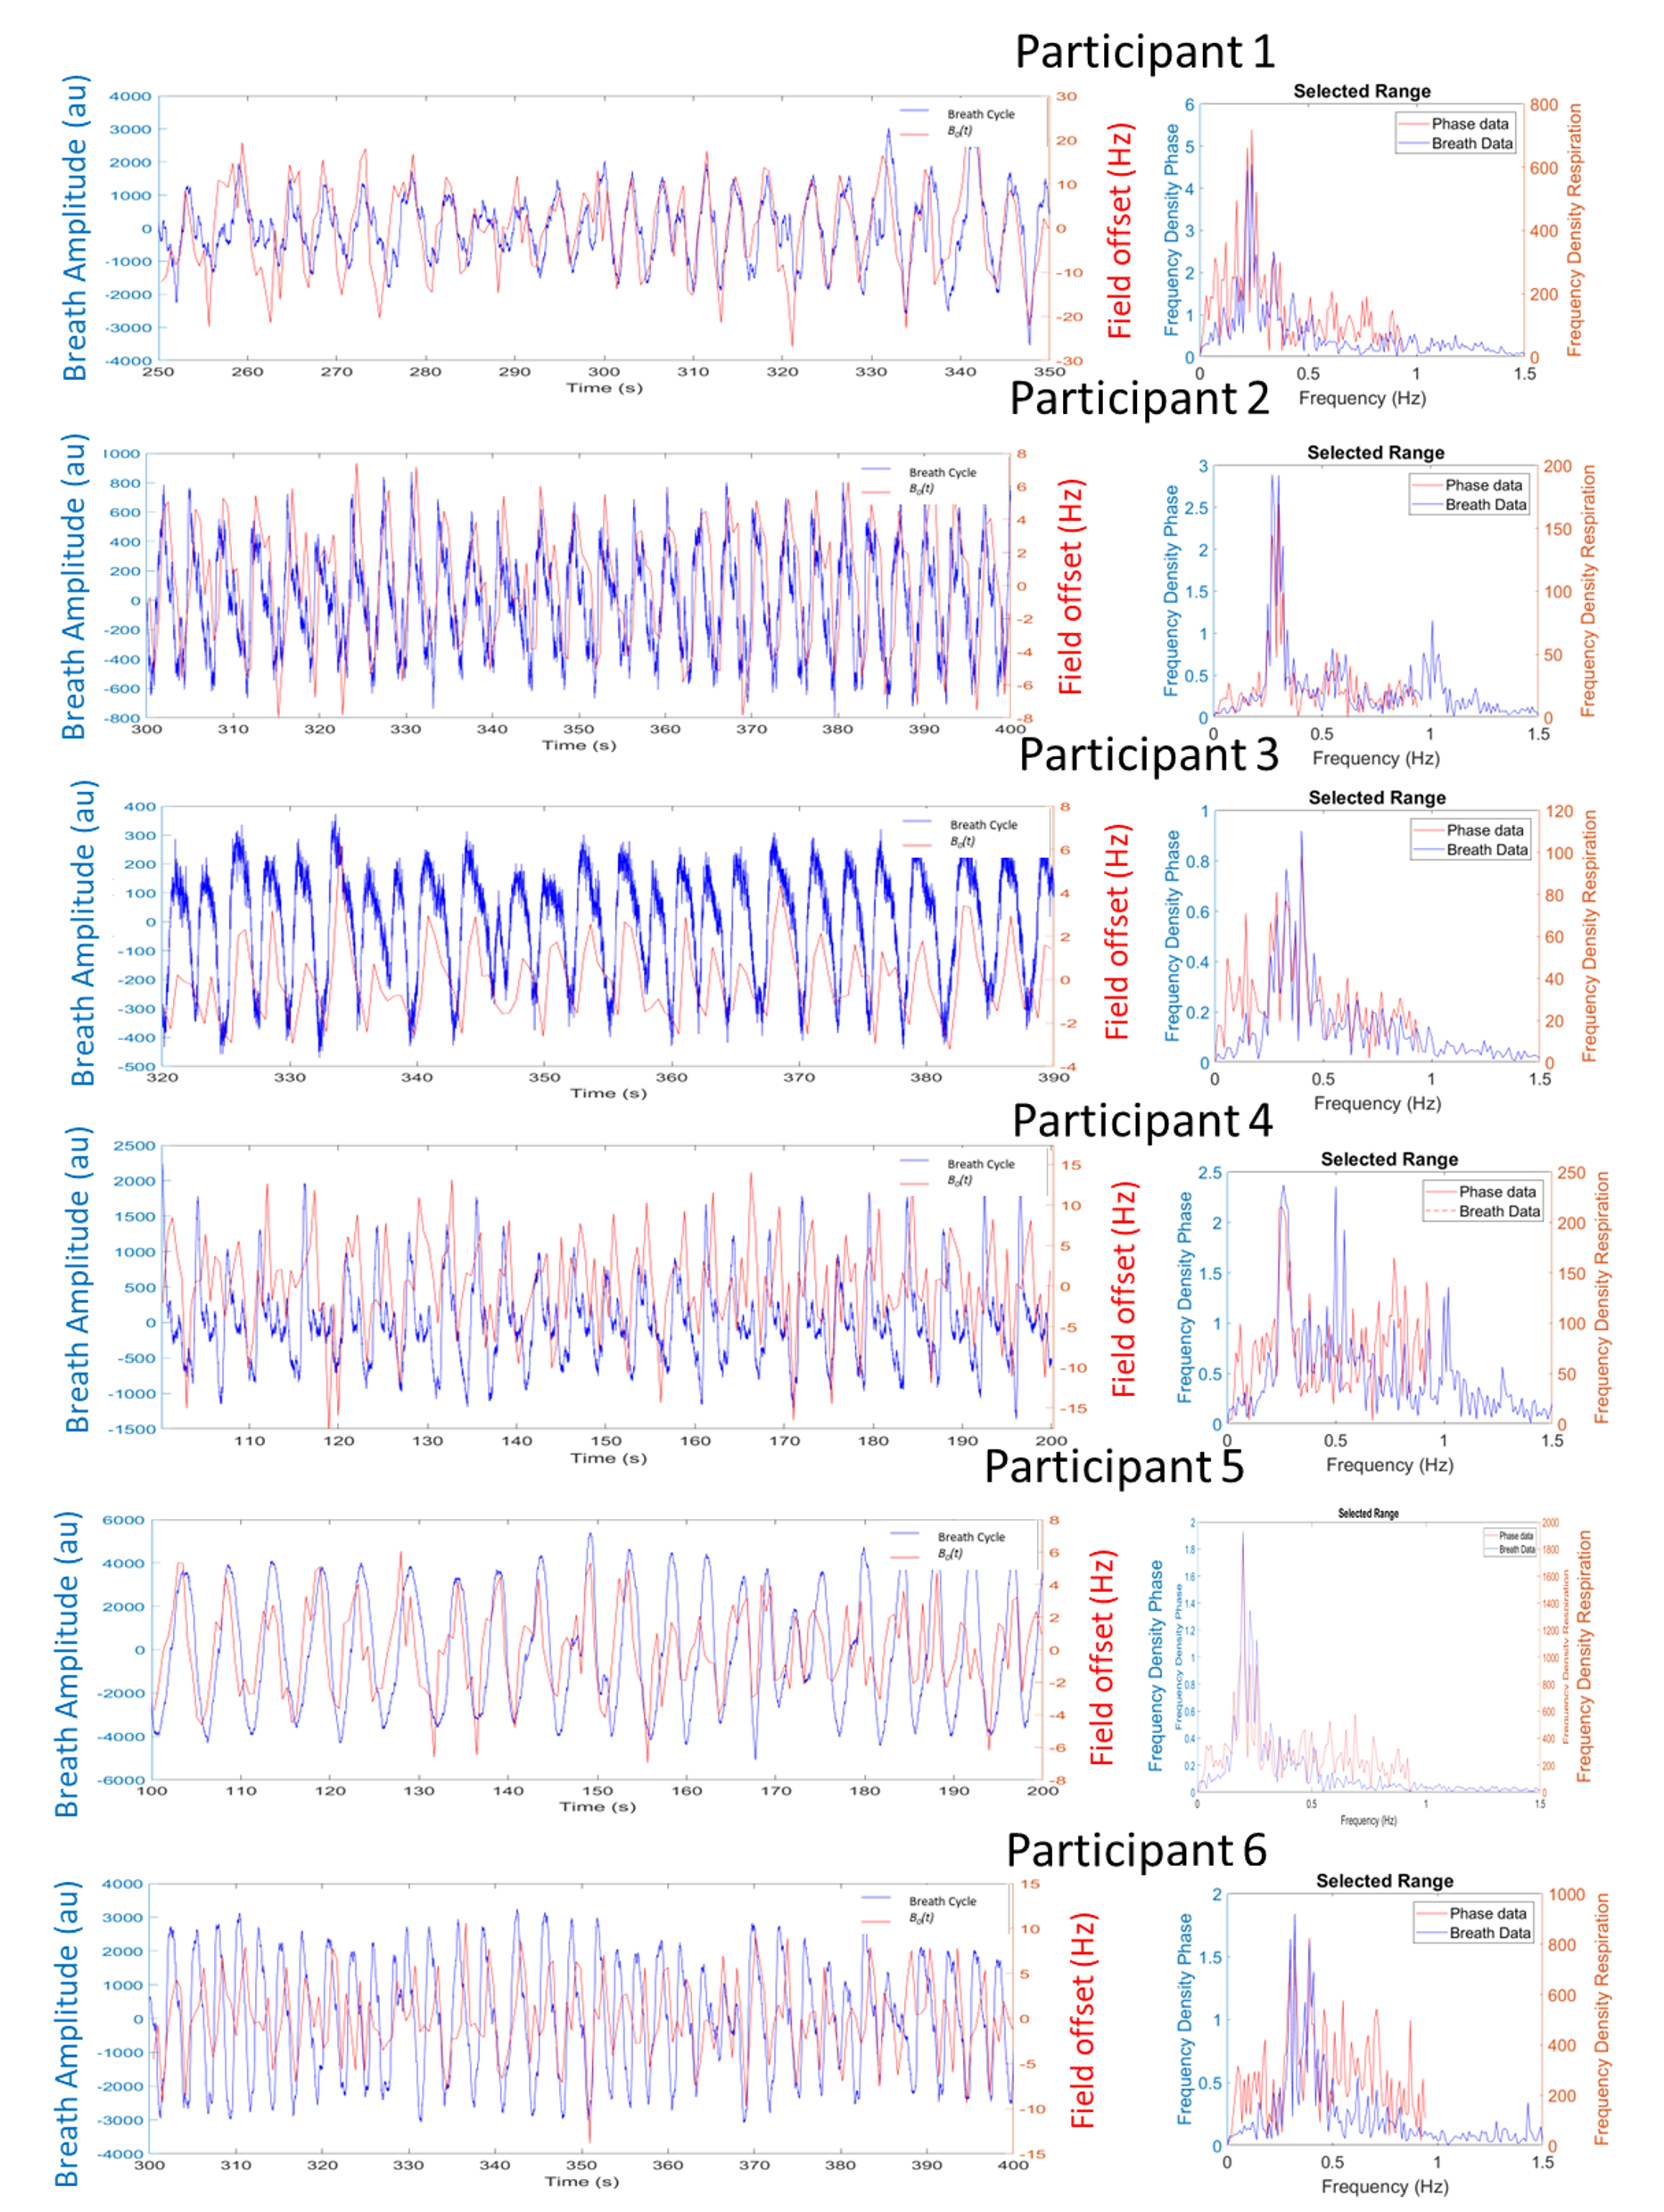
Figure 3. Alignment of each participant’s respiration trace and the field offset B0(t) measured from the dynamic imaging, the Fourier transform shows an overlap in the primary frequency.
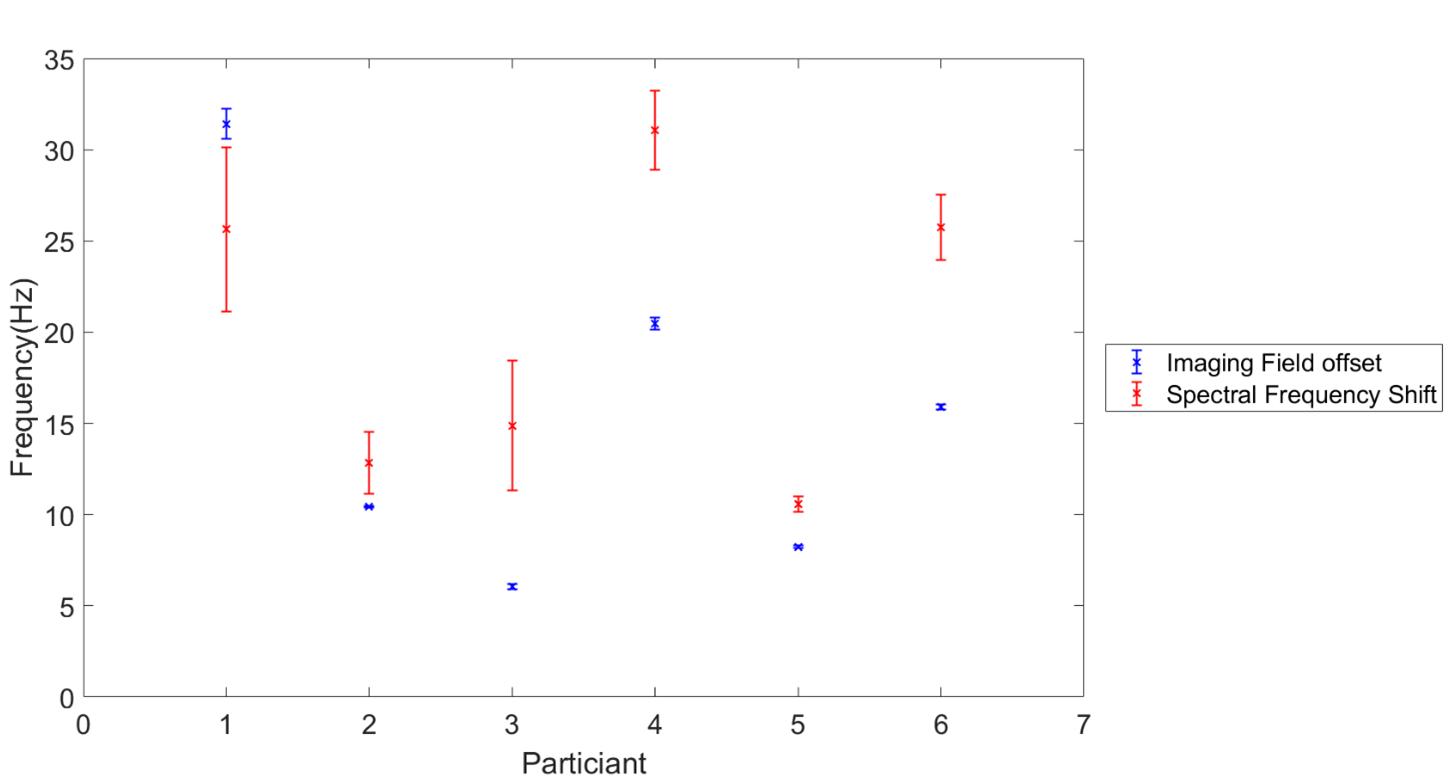
Figure 4. The free-breathing frequency shift between inspiration and expiration measured from the water spectral peak timeseries fpeak(t) (red) and dynamic imaging field offset B0(t) timeseries (blue). Mean and standard error shown.
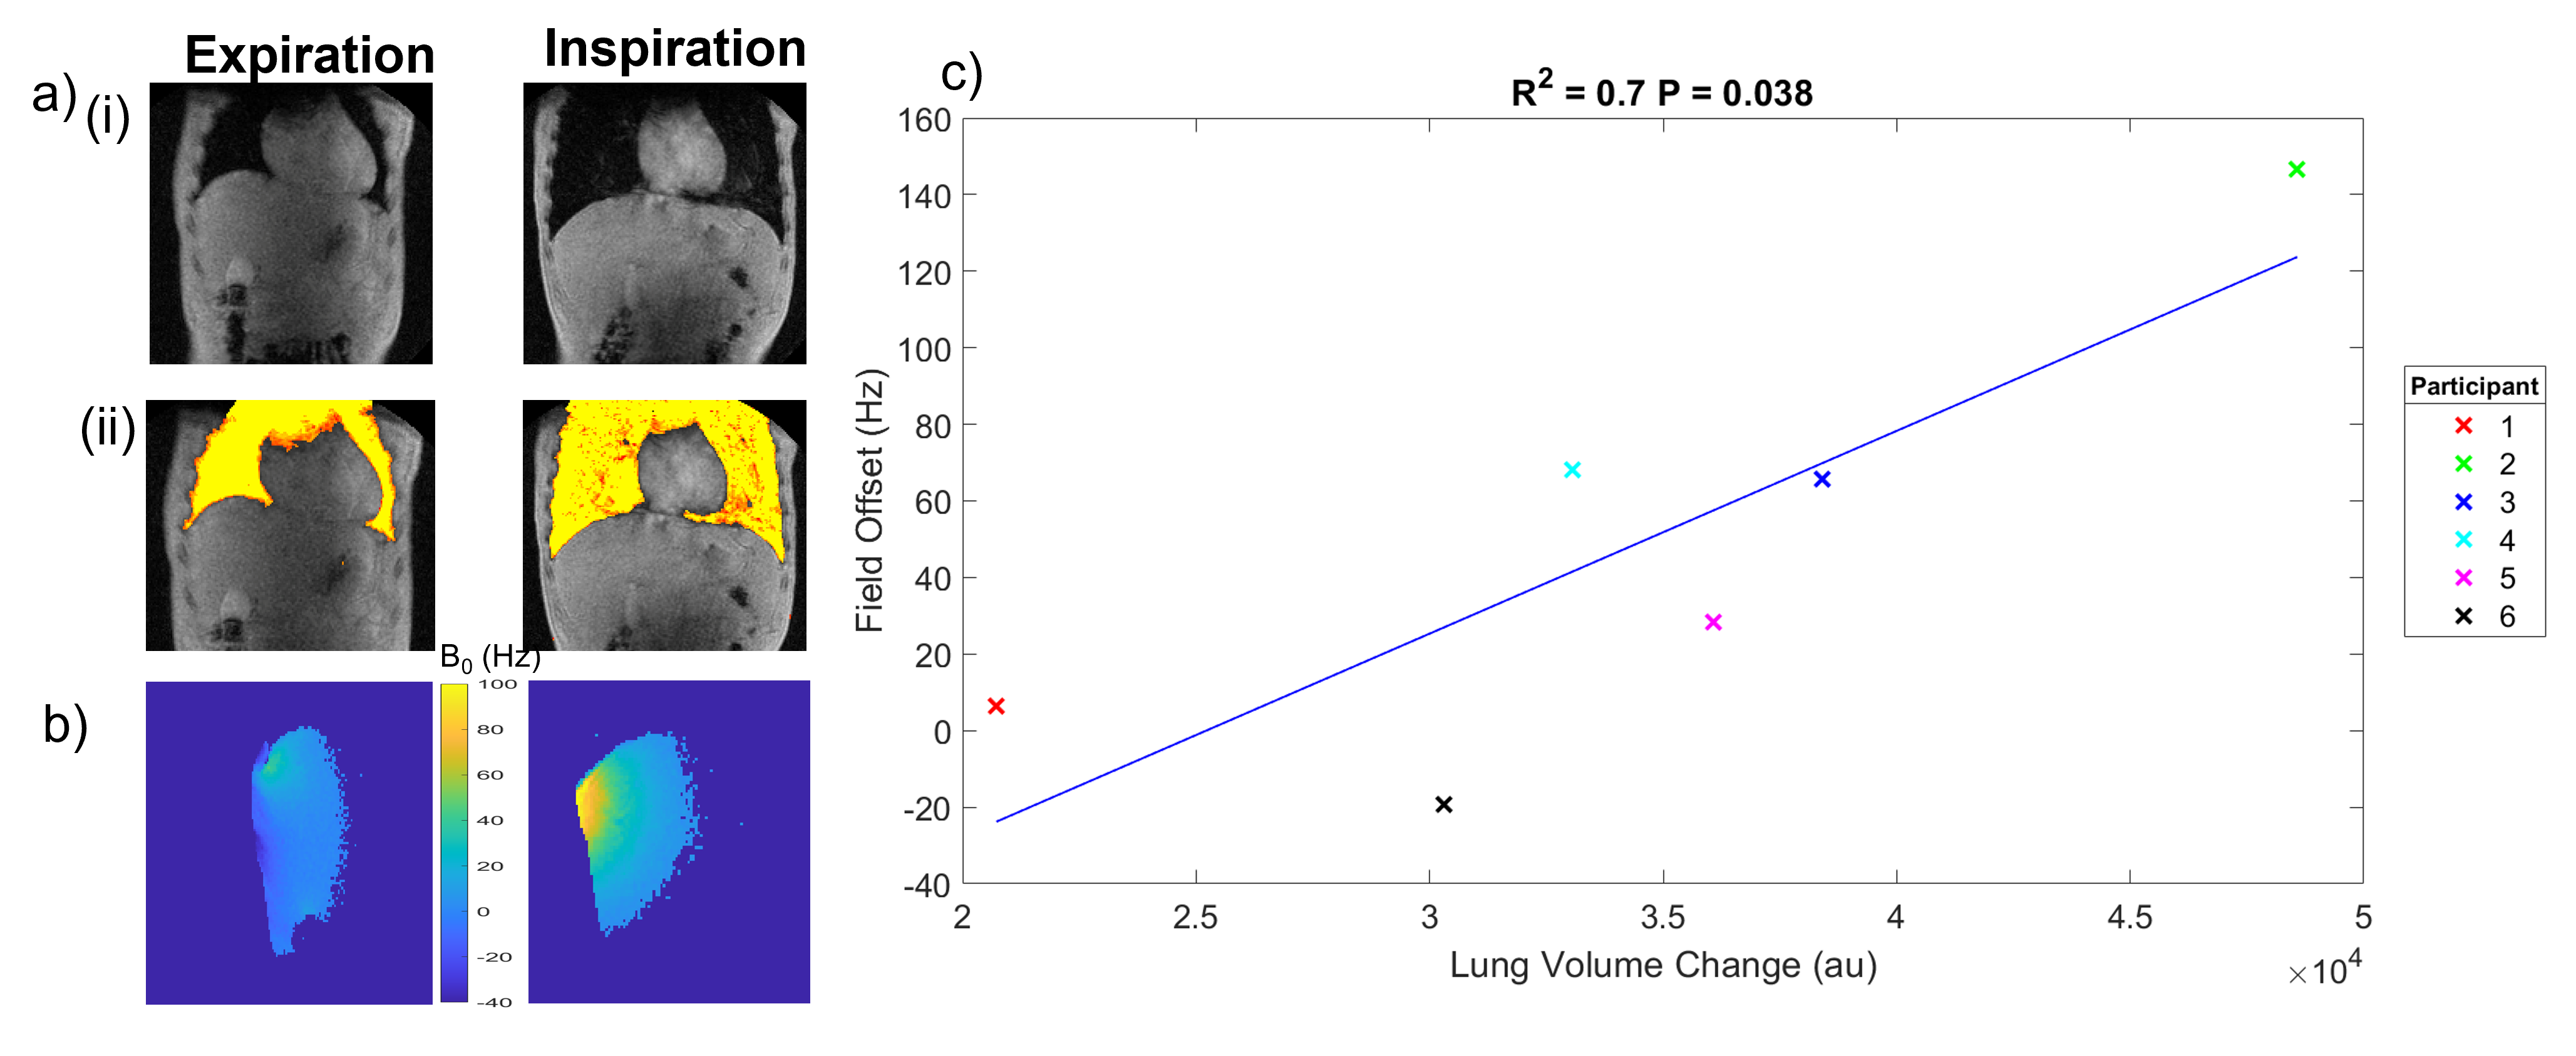
Figure 5 Example a) central slice of the multi-slice Q body (i) magnitude images and (ii) corresponding lung mask, b) central slice B0 maps from the 1H quadrature decoupling coil of the 13C surface coil illustrating the field shift between expiration and inspiration![]() c) Plot of average field offset across the 12 slices versus lung volume change between inspiration and expiration measured across the whole volume (R2=0.70, p < 0.038).
c) Plot of average field offset across the 12 slices versus lung volume change between inspiration and expiration measured across the whole volume (R2=0.70, p < 0.038).