3138
Using 13C MRS to Assess Fasted and Postprandial Glycogen Stores in Healthy Children: A Randomized Controlled Study1NIHR Nottingham Biomedical Research Centre, Nottingham University Hospitals NHS Trust and the University of Nottingham, Nottingham, UK, University of Nottingham, Nottingham, United Kingdom, 2Sir Peter Mansfield Imaging Centre, School of Physics and Astronomy, University of Nottingham, Nottingham, United Kingdom, 3Nestle Institute of Health Sciences, Lausanne, Switzerland, 4David Greenfield Human Physiology Unit, MRC/ARUK Centre for Musculoskeletal Ageing Research, University of Nottingham School of Life Sciences, University of Nottingham, Nottingham, United Kingdom
Synopsis
Keywords: Liver, Metabolism
The aim of this study was to use 13C MRS to compare hepatic glycogen levels before and after an overnight fast and following a small breakfast of varying carbohydrate quantities (0, 15.5 and 31g CHO) in children . Liver glycogen concentration decreased overnight from 378 ± 141 to 277 ± 107 mmol l-1 with a between visit coefficient of variation of 21 ± 15 %. There was also a significant difference in the postprandial AUC (P < 0.005) with a linear CHO ‘dose’ response (R=0.51, P < 0.001). This study expands knowledge of normative glycogen storage in children.Introduction
Glycogen is the primary acute-phase carbohydrate (CHO) energy store and acts to regulate blood glucose levels between meals. The majority of glycogen is stored in the muscle, but the liver provides a concentrated reservoir that contributes to ~45% of the total endogenous glucose production1. Blood glucose control and glycogen synthesis/breakdown via the liver play a key role in many metabolic diseases which are becoming an increasing global health concern2. Despite a growing knowledge of glycogen utilisation in both healthy and diseased adult populations, less work has been done in children3-5 and it is not known the extent to which liver glycogen stores are depleted following overnight fasting nor postprandial dynamics. However, this knowledge is essential in providing a foundational basis for investigating disease and interventions.The aim of this study was to use 13C MRS to compare hepatic glycogen levels before and after an overnight fast and following a small breakfast of varying carbohydrate quantities in children.
Methods
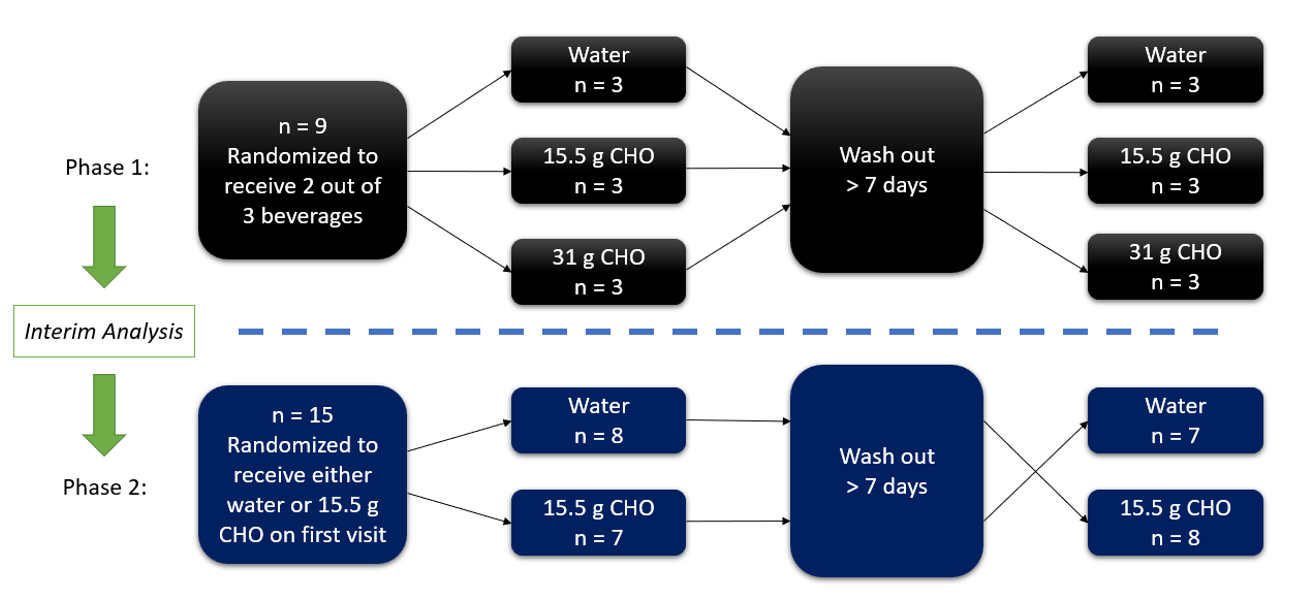
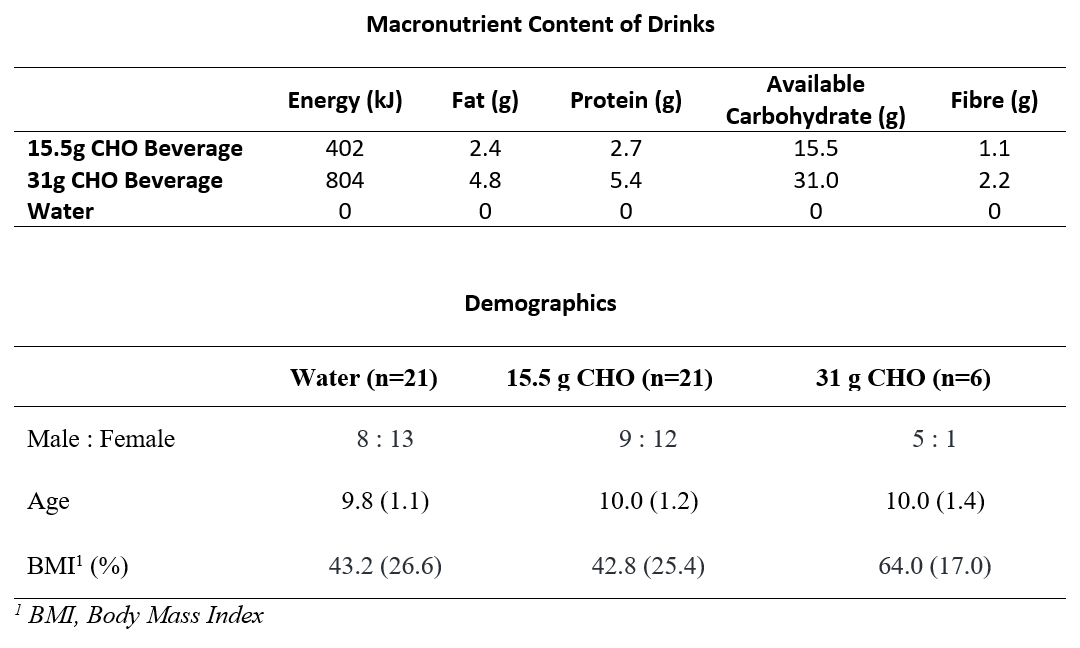
Ethics was approved and written consent obtained from guardians of participants. Healthy, normal weight children aged 8 – 12 years were recruited through local advertisements. All scans were performed on a Philips 3T Acheiva scanner using a Pulseteq 12cm single-loop 13C surface coil6 with a 13C Urea reference sample attached at the coil centre (signal at 176 ppm).Study design: Data was gathered over 2 phases as outlined in Figure 1. Participants first attended the test centre on the evening prior to test days (~20:00, 3-hours after a standardized evening meal) for liver glycogen measurements (pre-fasted). Participants returned the following morning (~8:00) for a post-fasted glycogen measurement, before consuming a 200 ml mixed-macronutrient beverage (Milo, Nestlé S.A.) containing either 0, 15.5 or 31 g CHO (Figure 2). Liver glycogen measurements were then taken immediately following consumption and hourly for 4 hours.
MR Acquisition: A surface coil was placed over the liver and scout images were first acquired to confirm correct coil placement and to measure liver-to-coil distance. Next, a short-duration long-TR 13C-Urea MRS reference scan (TR = 1500 ms, 20 spectra averaged, time = ~1 min) was acquired followed by a short-TR 13C glycogen MRS scan (TR = 280 ms, 3072 spectra averaged, time = ~15 mins) with pencil beam shimming (900 block pulse, bandwidth = 7 kHz). Gastric content volume was also measured using a fast gradient echo sequence to assess gastric emptying.
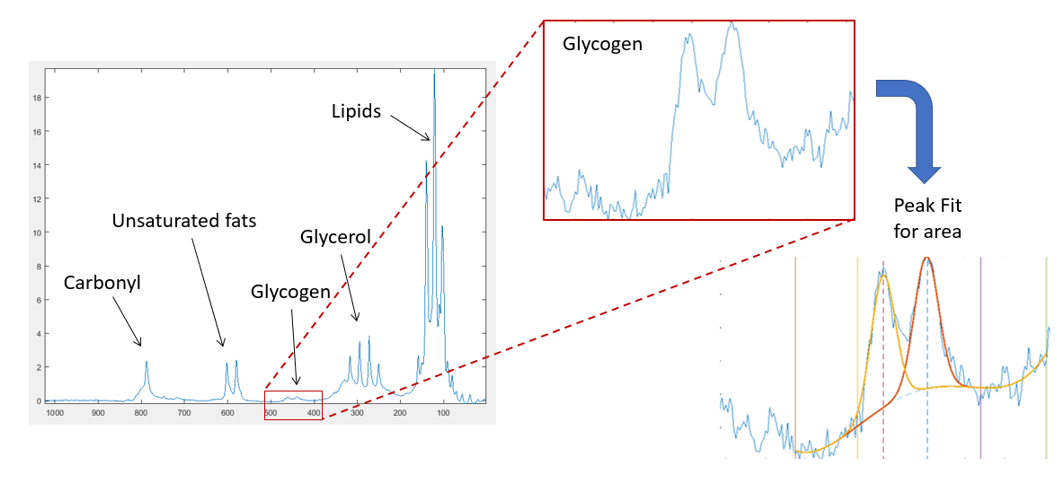
MR Analysis: The areas under the urea reference peak and the glycogen doublet (~101 ppm) were determined by fitting gaussian curves using an in-house Matlab script (Mathwork inc). Final calibrated signals where then calculated by scaling glycogen peak areas to the urea reference signal before correcting for B1 sensitivity using a Bio-savart static field model7. Glycogen concentrations were finally estimated by comparison a 200 mmol l-1 glycogen liver phantom8
Data analysis: Calibrated and B1 corrected glycogen signals for each group were plotted across time and compared. Incremental net area-under-the-curve over the 4-hours (AUC) was computed using the trapezoid method, accounting for areas both below and above the fasting glycogen values. All data was statistically analysed using SAS (SAS institute, USA). Data were initially checked for normality and then compared using an unpaired two tail t-test and correlations were analysed using linear fitting. Gastric emptying was assessed by manually drawing around gastric contents within the MRI scans using Analyze9 (Mayo) and hence calculating the volume.
Results
The demographics of participants recruited are shown in Figure 2.Acquired spectra had good SNR with well resolved glycogen signals (Figure 3).
Across all participants, the liver glycogen concentration decreased overnight from 378 ± 141 to 277 ± 107 mmol l-1 with a between visit coefficient of variation for fasted glycogen being 21 ± 15 %.
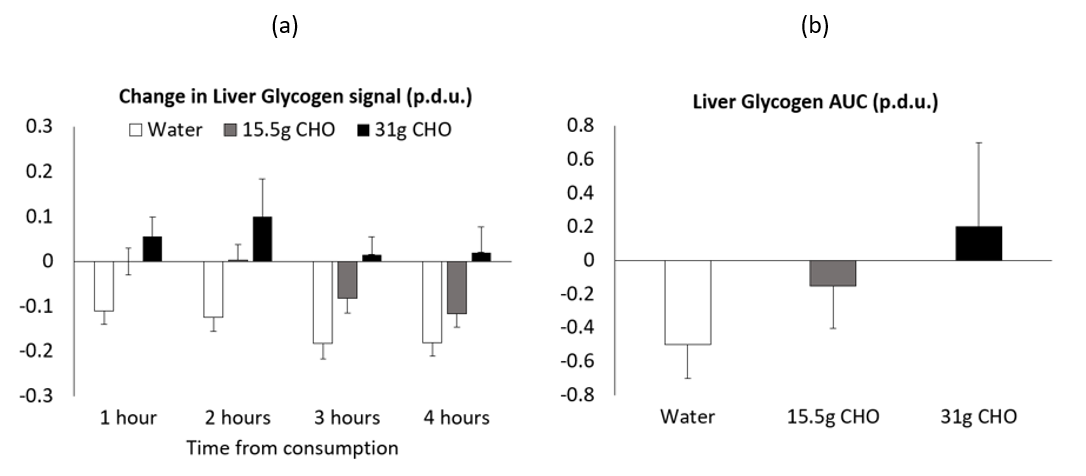
The impact of the test drink on liver glycogen is shown in Figure 4. There was a significant main effect of both drinks compared to water (P<0.05 and P<0.001 for the 15.5g and 31g CHO respectively) and a significant between group effect (time x drink: P < 0.05). There was also a significant difference in the postprandial AUC across visits (P < 0.005) with a linear CHO dose response (R=0.51, P < 0.001).
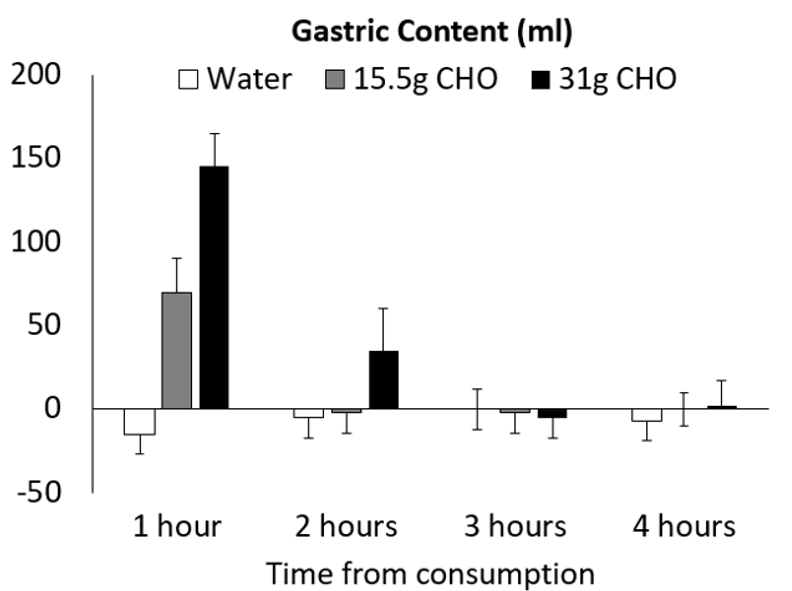
Figure 5 shows the change in gastric volume over time. At the 1 hour assessment the water appears to have completely emptied whereas the emptying is prolonged for the test products. The estimated gastric emptying half-life was 32 ± 1, 63 ± 6 and 88 ± 8 mins for the water, 15.5g and 31g CHO drinks respectively (P < 0.001).
Discussion
This study expands current knowledge of normative glycogen storage in children. 13C MRS offers a unique methodology to explore in vivo data that is otherwise inaccessible. After overnight fasting, liver glycogen levels were of similar magnitude to that reported in adults9. Subsequent consumption of 15.5 g CHO elicited a notable change in liver glycogen stores by maintaining the overnight fasted levels for 2 hours and delaying further decreases, whereas consumption of 31 g CHO prompted an increase in glycogen stores – also observed in adults8. Further work should now explore varying interventions and in patient populations.Acknowledgements
No acknowledgement found.References
1. Petersen, K.F., et al., Contribution of net hepatic glycogenolysis to glucose production during the early postprandial period. American Journal of Physiology-Endocrinology and Metabolism, 1996. 270(1): p. E186-E191.
2. Younossi, Z.M., et al., Global epidemiology of nonalcoholic fatty liver disease-Meta-analytic assessment of prevalence, incidence, and outcomes. Hepatology, 2016. 64(1): p. 73-84.
3. Foricher, J.M., et al., Effects of submaximal intensity cycle ergometry for one hour on substrate utilisation in trained prepubertal boys versus trained adults. Journal of Sports Medicine and Physical Fitness, 2003. 43(1): p. 36-43.
4. Fluck, C.E., et al., Normal hepatic glycogen storage after fasting and feeding in children and adolescents with type 1 diabetes. Pediatr Diabetes, 2003. 4(2): p. 70-6.
5. Matyka, K.A., Nocturnal hypoglycaemia in children: The effects on cognitive function. Diabetes Nutrition & Metabolism, 2002. 15(6): p. 390-394.
6. Bawden, S.J., et al., A Low Calorie Morning Meal Prevents the Decline of Hepatic Glycogen Stores: A Pilot in vivo 13C Magnetic Resonance Study. Food and Function, 2014. 5(9): p. 2237 - 2242.
7. Moyher, S.E., D.B. Vigneron, and S.J. Nelson, Surface Coil Mr-Imaging of the Human Brain with an Analytic Reception Profile Correction. Jmri-Journal of Magnetic Resonance Imaging, 1995. 5(2): p. 139-144.
8. Bawden, S., et al., Increased liver fat and glycogen stores following high compared with low glycaemic index food: a randomized cross over study. Diabetes Obes Metab, 2016.
9. Rothman, D.L., et al., Quantitation of Hepatic Glycogenolysis and Gluconeogenesis in Fasting Humans with C-13 Nmr. Science, 1991. 254(5031): p. 573-576.
Figures