3136
Translation of a non-contrast quantitative MRI protocol for portal pressure prediction1University of Nottingham, Nottingham, United Kingdom, 2NIHR Biomedical Research Centre, Nottingham, United Kingdom
Synopsis
Keywords: Liver, Liver
Most complications in liver cirrhosis arise from portal hypertension. Using a vendor-specific fat suppressed spin-echo echo planar imaging T1 mapping method along with measures of flow within the superior mesenteric artery, we previously validated MRI as a surrogate measure of portal pressure at 1.5 and 3T. Here we translate this work to three MR vendors (GE, Philips and Siemens) using commercially available sequences allowing multi-site studies of assessment of portal pressure. Importantly, this could provide a non-invasive measure of portal pressure for clinical use to replace current invasive gold standard measures.
Introduction
Most complications in liver cirrhosis arise from portal hypertension. The current gold standard method to measure portal pressure is the Hepatic Venous Pressure Gradient (HVPG)1. However, HVPG is highly invasive and can only be prescribed at specialist hepatology centres. MRI surrogates of portal pressure are now being explored using non-contrast methods of T1 mapping combined with haemodynamic measures2, or methods using more specialised imaging techniques such as 4DFlow3, or hardware for MR elastrography (MRE)4.We previously validated MRI as a surrogate measure of HVPG at 1.5T2 and 3T5 on Philips scanners using fat suppressed spin-echo echo planar imaging (SE-EPI) liver T1 and splanchnic haemodynamics through phase contrast (PC)-MRI of the superior mesenteric artery (SMA) (Figure 1A). Our prior work used a vendor-specific bespoke-coded T1 mapping scheme to collect a multi-slice respiratory triggered fat suppressed SE-EPI sequence with whole liver coverage in ~3 minutes. We showed this fat suppressed SE-EPI acquisition was superior to MOLLI for measuring liver T1, since fat significantly influences the MOLLI T1 measurement5,6 (Figure 1B). PC-MRI for assessment of SMA haemodynamics is routinely available on all clinical MRI scanners.
Here, we translate our MRI measure of portal pressure for use across vendors by using a commercially available vendor-provided SE-EPI T1 mapping sequence in a short clinically feasible time without the need for specialised hardware or sequences. To address this, we first show that a single slice SE-EPI T1 mapping measure is representative of the whole liver in portal hypertension, since when using vendor-provided sequences only single slice measures can be acquired within an acceptable time. We then build an MRI protocol using vendor-product single slice fat suppressed SE-EPI T1 mapping sequences and PC-MRI measures of SMA velocity for each of the three major MR vendors (GE, Philips, Siemens). The T1 accuracy of each vendor-product single slice SE-EPI fat-suppressed T1 mapping sequence is assessed with a phantom and in healthy volunteers.
Methods
Multi-slice T1 maps collected in our prior 3T study5 of portal hypertension were reanalyzed. The mode of the liver T1 value across all slices was compared to the mode of liver T1 from the central slice only to provide confirmation that a single slice T1 map is representative of the whole liver in patients with portal hypertension.Parameters for vendor-product sequences allowing free-breathing fat suppressed SE-EPI T1 mapping to be collected are given in Table 1. For each vendor-product T1 mapping sequence, a NIST System phantom (CalibreMRITM, CO, USA) was scanned and T1 values across the reference balls compared with their reference NIST T1 values. In addition, two healthy male volunteers were each scanned with vendor-product sequences on a 1.5T Siemens Sola, a 3T Philips Ingenia and a 3T GE Premier scanner. Our vendor-specific bespoke-coded T1 mapping scheme of a respiratory triggered inversion recovery fat-suppressed spin-echo EPI scheme was also acquired on the 3T Philips Ingenia (9 axial slices, 15 inversion times 100 – 1500 ms in 100 ms steps, 58 ms temporal slice spacing, acquired in ascending/descending slice order to increase the dynamic range of inversion times)4,5. Data were fit voxel-wise using a 3-parameter model across inversion times to compute T1 maps on the NIST phantom spheres and in vivo.
Results
Figure 2 correlates the mode of single slice liver T1 measures with the mode of the whole liver measures in patients with portal hypertension and shows a highly significant correlation (R = 0.99, p < 0.0001). Figure 3 shows the accuracy of vendor-product sequence SE-EPI T1 mapping measures against NIST phantom reference T1 values (Siemens: R=0.99, p<0.0001. Philips: R=0.99, p<0.0001. GE: R=0.99, p<0.0001). Figure 4 shows T1 maps for an example healthy subject across vendors, and the modal fits on the distribution of T1 values within an ROI within liver tissue (Siemens 1.5T: 590±34ms; GE 3T: 777±68ms; Philips 3T: 770±46ms, multislice: 783±76ms).Discussion
Here we show that, in portal hypertension patients, a single slice of the liver is representative of the whole liver, and so can be used in MRI surrogate measures of HVPG. We set-up single slice vendor-provided fat suppressed SE-EPI liver T1 schemes on each of the three major vendors - GE, Philips, and Siemens. The fat suppressed SE-EPI scheme is chosen over a MOLLI T1 mapping scheme due to the significant influence of fat on MOLLI liver T1 [6]. Cross-vendor SE-EPI T1 measures are validated on a NIST phantom. In healthy subjects, liver T1 values are shown to match literature T1 values of healthy liver tissue T1 at 1.5T: 586±39ms7 and 3T: 809±71ms8, with a ratio of 1:1.38 as predicted between 1.5:3T8. In future work we will expand this model validation across each vendor at each field strength to generate comparator studies in healthy subjects and patients with liver disease.Conclusion
We have demonstrated that a fat suppressed SE-EPI T1 protocol for evaluation of liver tissue T1 can be acquired on any major vendor at 1.5 or 3T. This work shows promise for widespread translation of prior vendor-specific SE-EPI T1 based-methods that can, together with haemodynamic information, provide a surrogate of portal pressure.Acknowledgements
This work was funded by the Nottingham NIHR Biomedical Research Centre.
References
1. Groszmann RJ, Wongcharatrawee S (2004) The hepatic venous pressure gradient: Anything worth doing should be done right. Hepatology 39:280–283 . doi: 10.1002/hep.20062
2. Palaniyappan N, Cox EF, Bradley CR, et al (2016) Non-invasive assessment of portal hypertension using quantitative magnetic resonance imaging. J Hepatol 65:1131–1139. doi: 10.1016/j.jhep.2016.07.021
3. Roldan-Alzate A, Frydrychowicz A, Niespodzany E et al (2013) In Vivo Validation of 4D Flow MRI for Assessing theHemodynamics of Portal Hypertension. J Magn Reson Imaging 37:1100-1108
4. Shi Y, Qi Y, Lan, G et al (2021) Three-dimensional MR Elastography Depicts Liver Inflammation, Fibrosis, and Portal Hypertension in Chronic Hepatitis B or C. Radiol 301:154–162
5. Bradley CR, Scott RA, Cox EF, et al (2020) Quantitaive MRI to assess portal hypertension in cirrhosis patients. Proc Intl Soc Mag Reson Med 28:0323.
6. Mozes F, Tunnicliffe E, Pavlides M et al (2016) Influence of fat on liver T1 measurements using modified Look-Locker inversion recovery (MOLLI) methods at 3T. J Magn Reson Imaging 44(1):105-111.
7. Bradley CR, Cox EF, Scott RA et al (2018) Multi-organ assessment of compensated cirrhosis patients using quantitative magnetic resonance imaging. J hepatol 69(5):1015-1024. doi: 10.1016/j.jhep.2018.05.037
8. de Bazelaire, C. M. J., Duhamel, G. D., Rofsky et al (2004). MR Imaging Relaxation Times of Abdominal and Pelvic Tissues Measured in Vivo at 3.0 T: Preliminary Results1. Radiol 230(3):652–659. https://doi.org/10.1148/RADIOL.2303021331
Figures
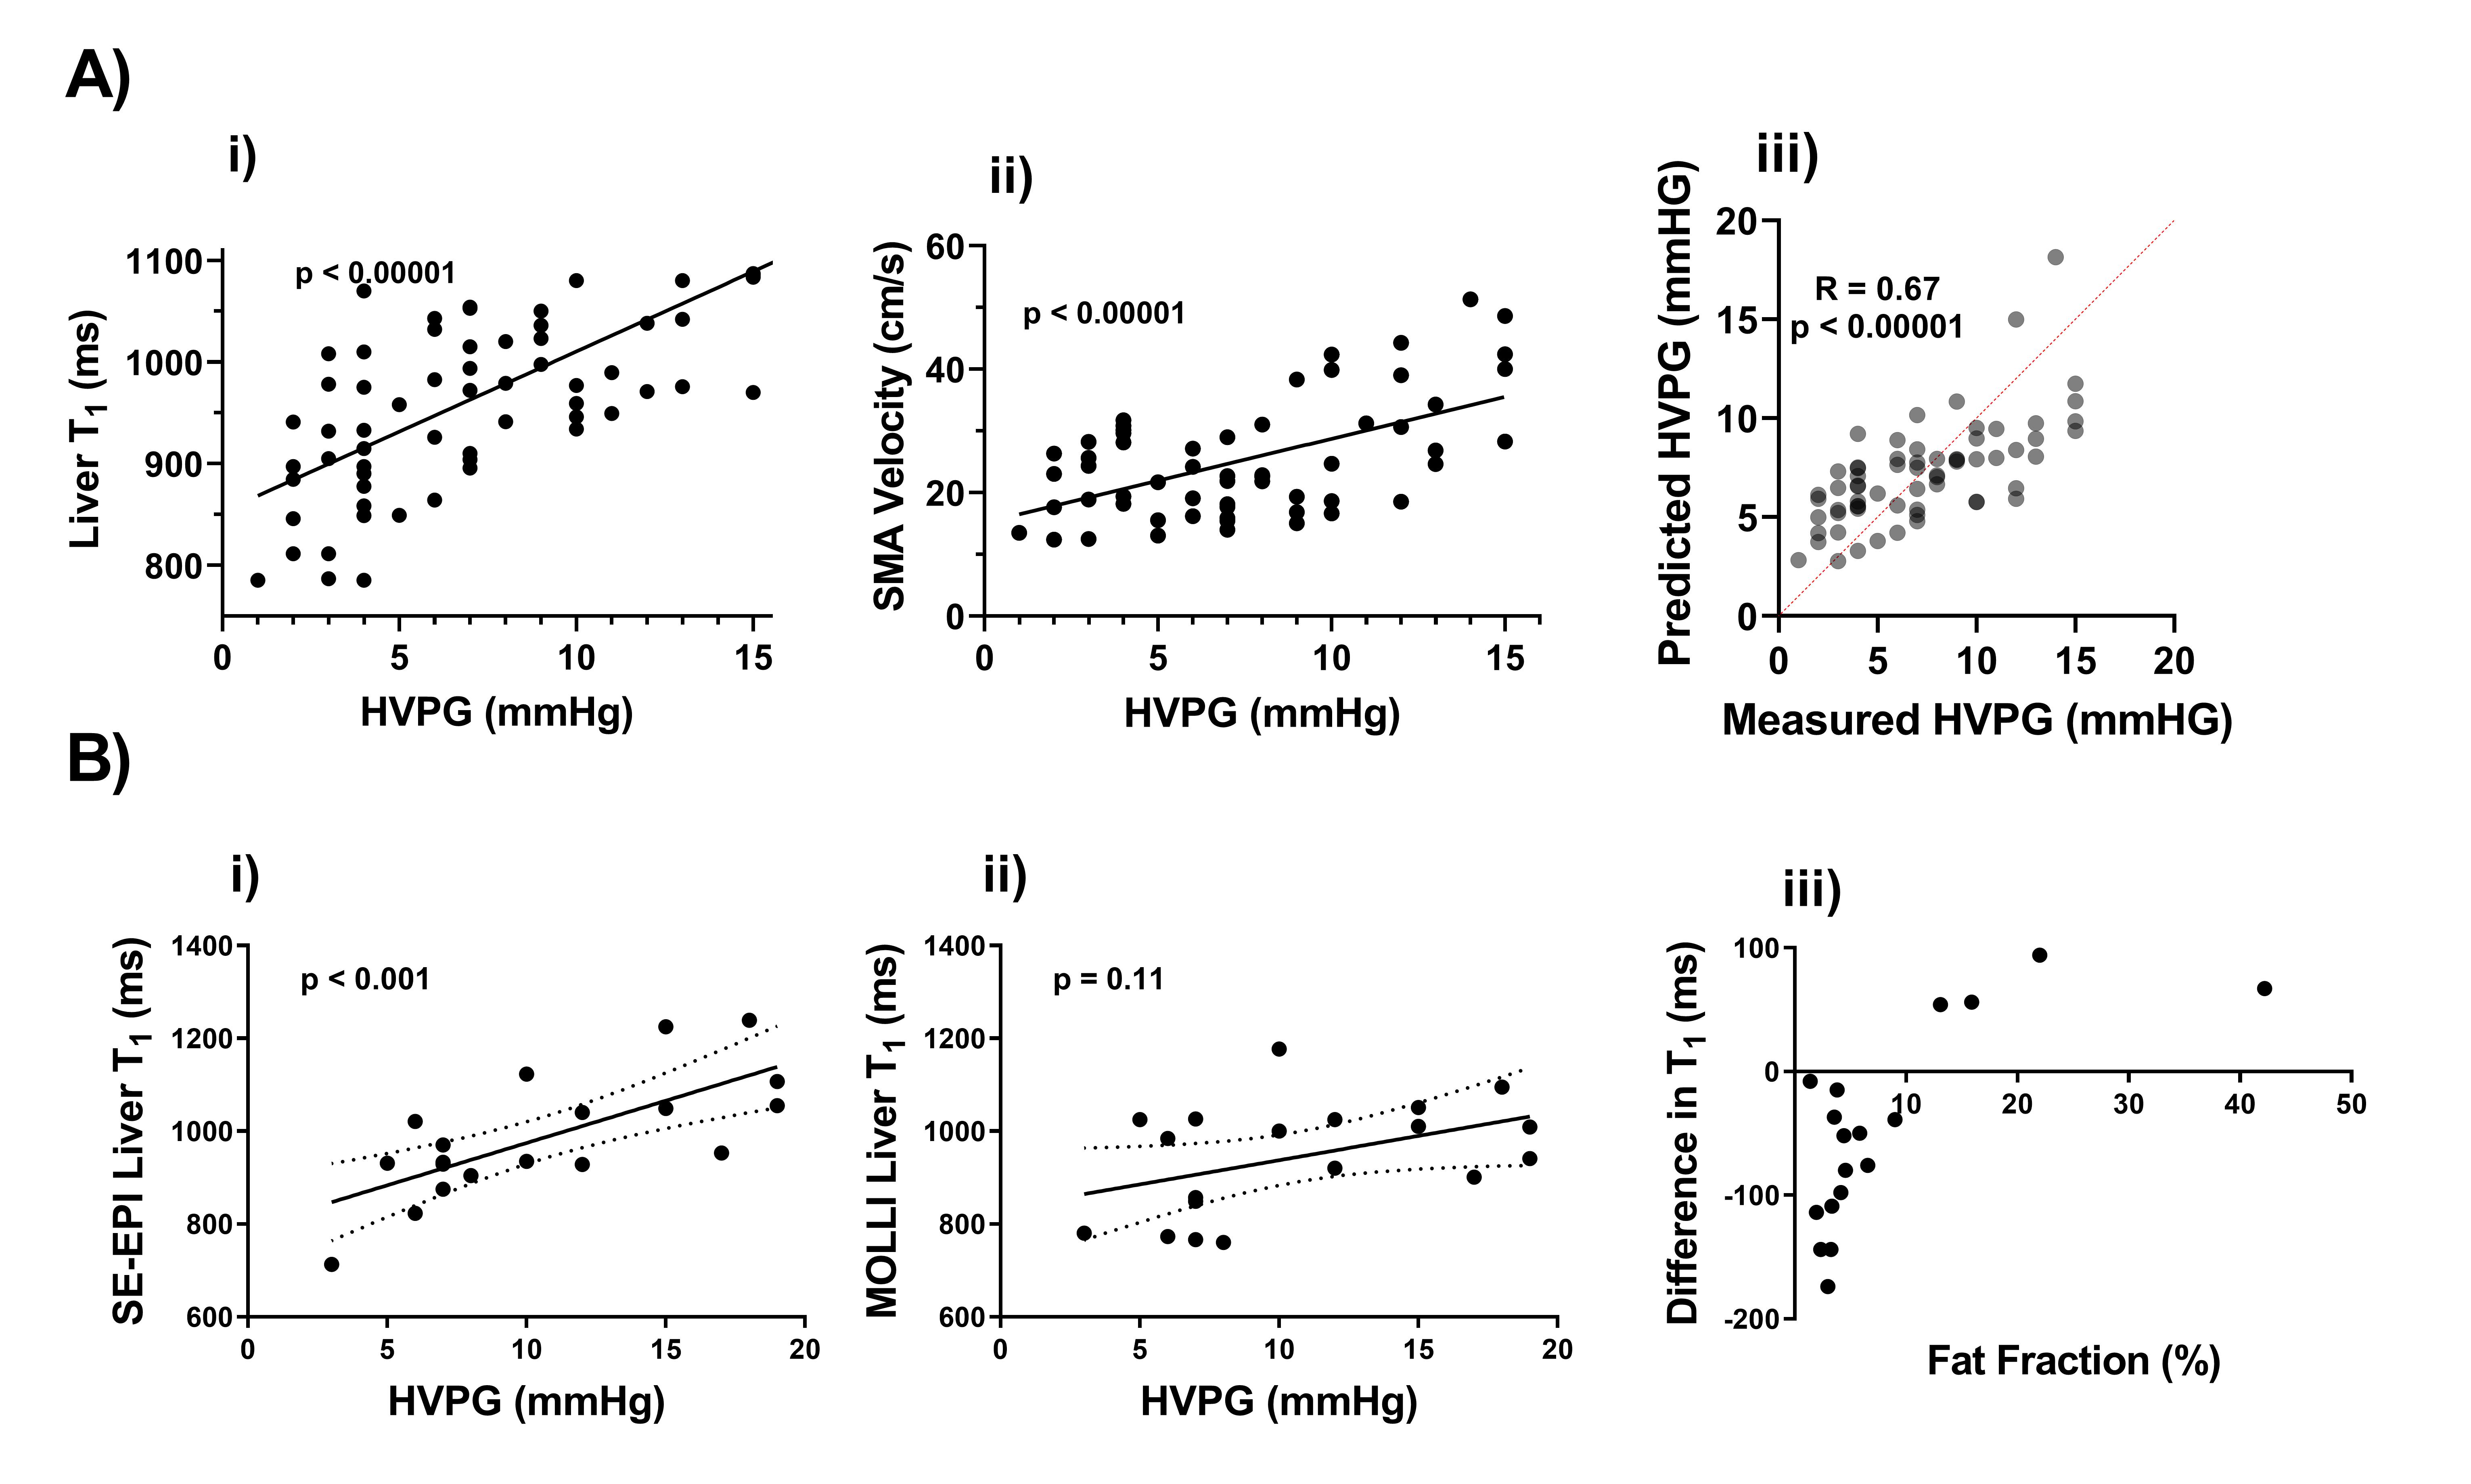
B In a subset of patients, the comparison of i) SE-EPI T1 and ii) MOLLI T1 as a predictor of HVPG, and iii) the influence of fat on the measured MOLLI T1 value.
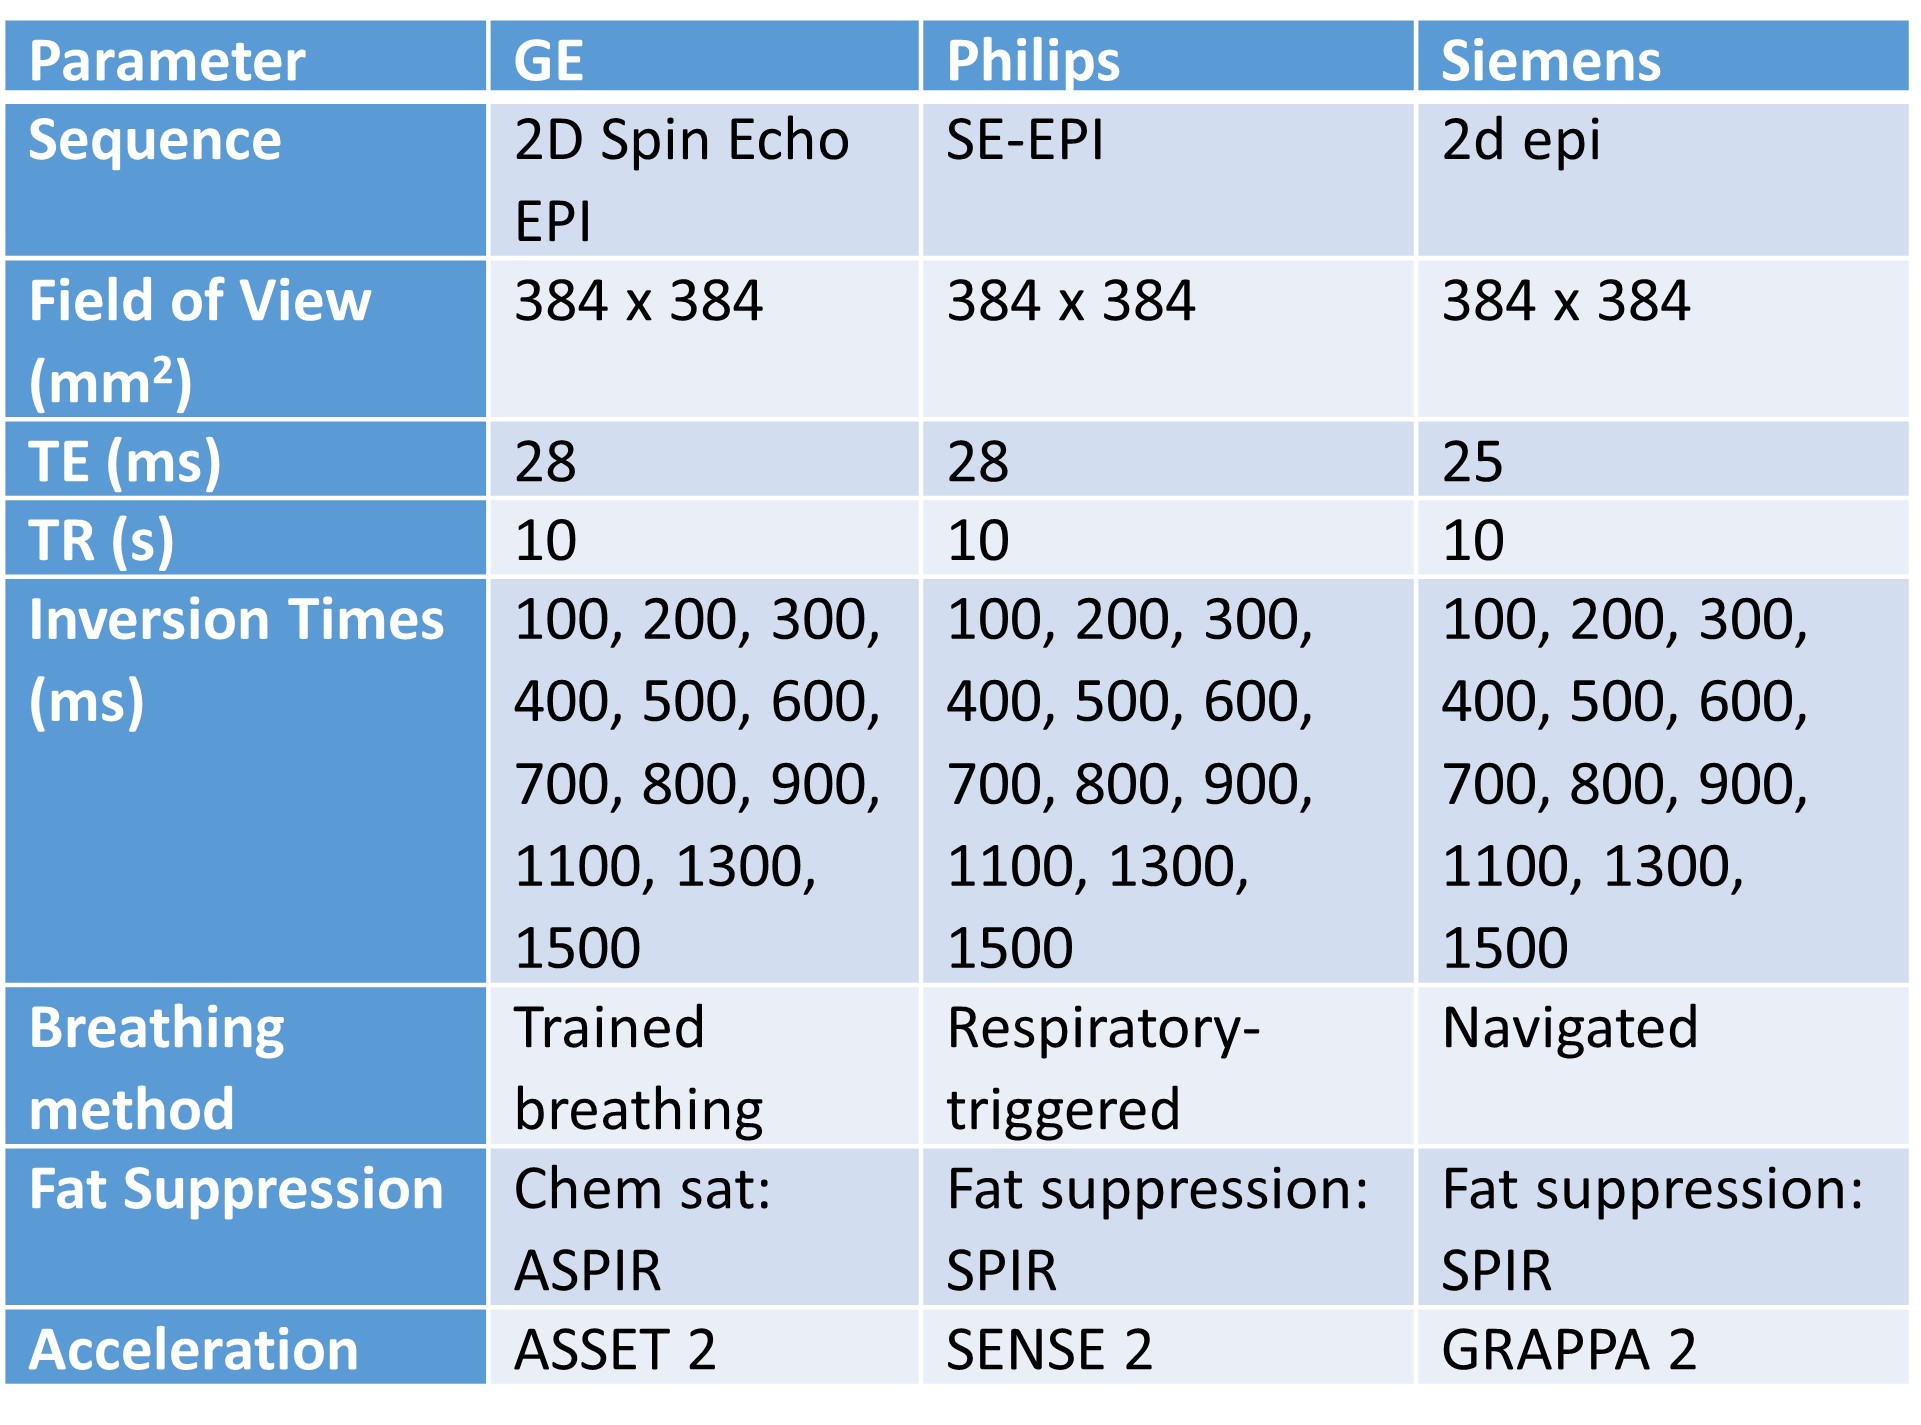
Table 1. Image acquisition parameters for vendor-product single-slice fat suppressed
Spin Echo Echo Planar Imaging (SE-EPI) T1 mapping sequences available on the GE, Philips and Siemens scanners.
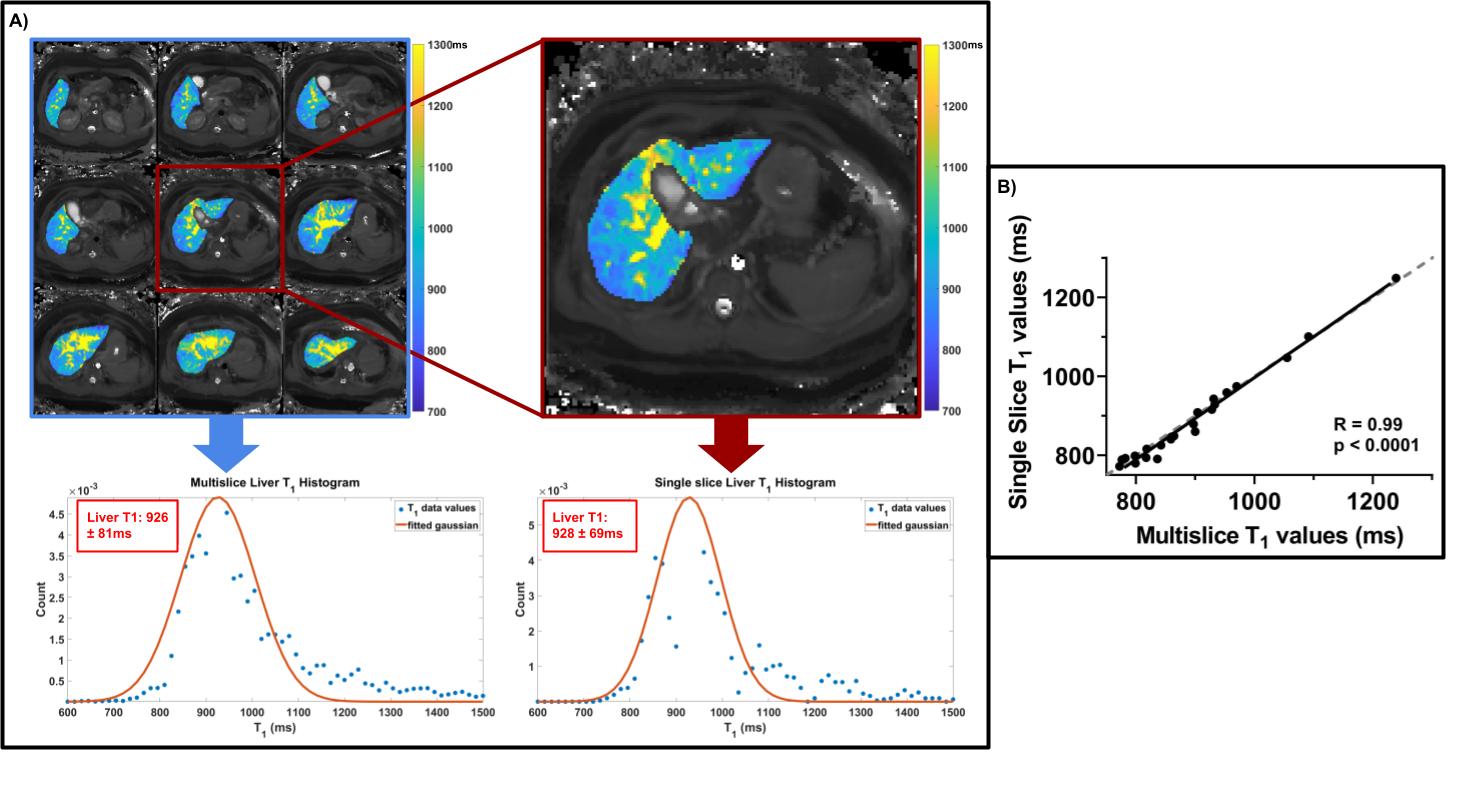
Figure 2. A) Example multi-slice liver T1 map from a patient with portal hypertension showing the distribution of T1 values from voxels within the liver, from which the mode of the histogram is computed for the prediction of hepatic venous pressure gradient. B) A strong correlation between the mode of the histogram computed from single slice and multislice T1 maps (R = 0.99, p < 0.0001).
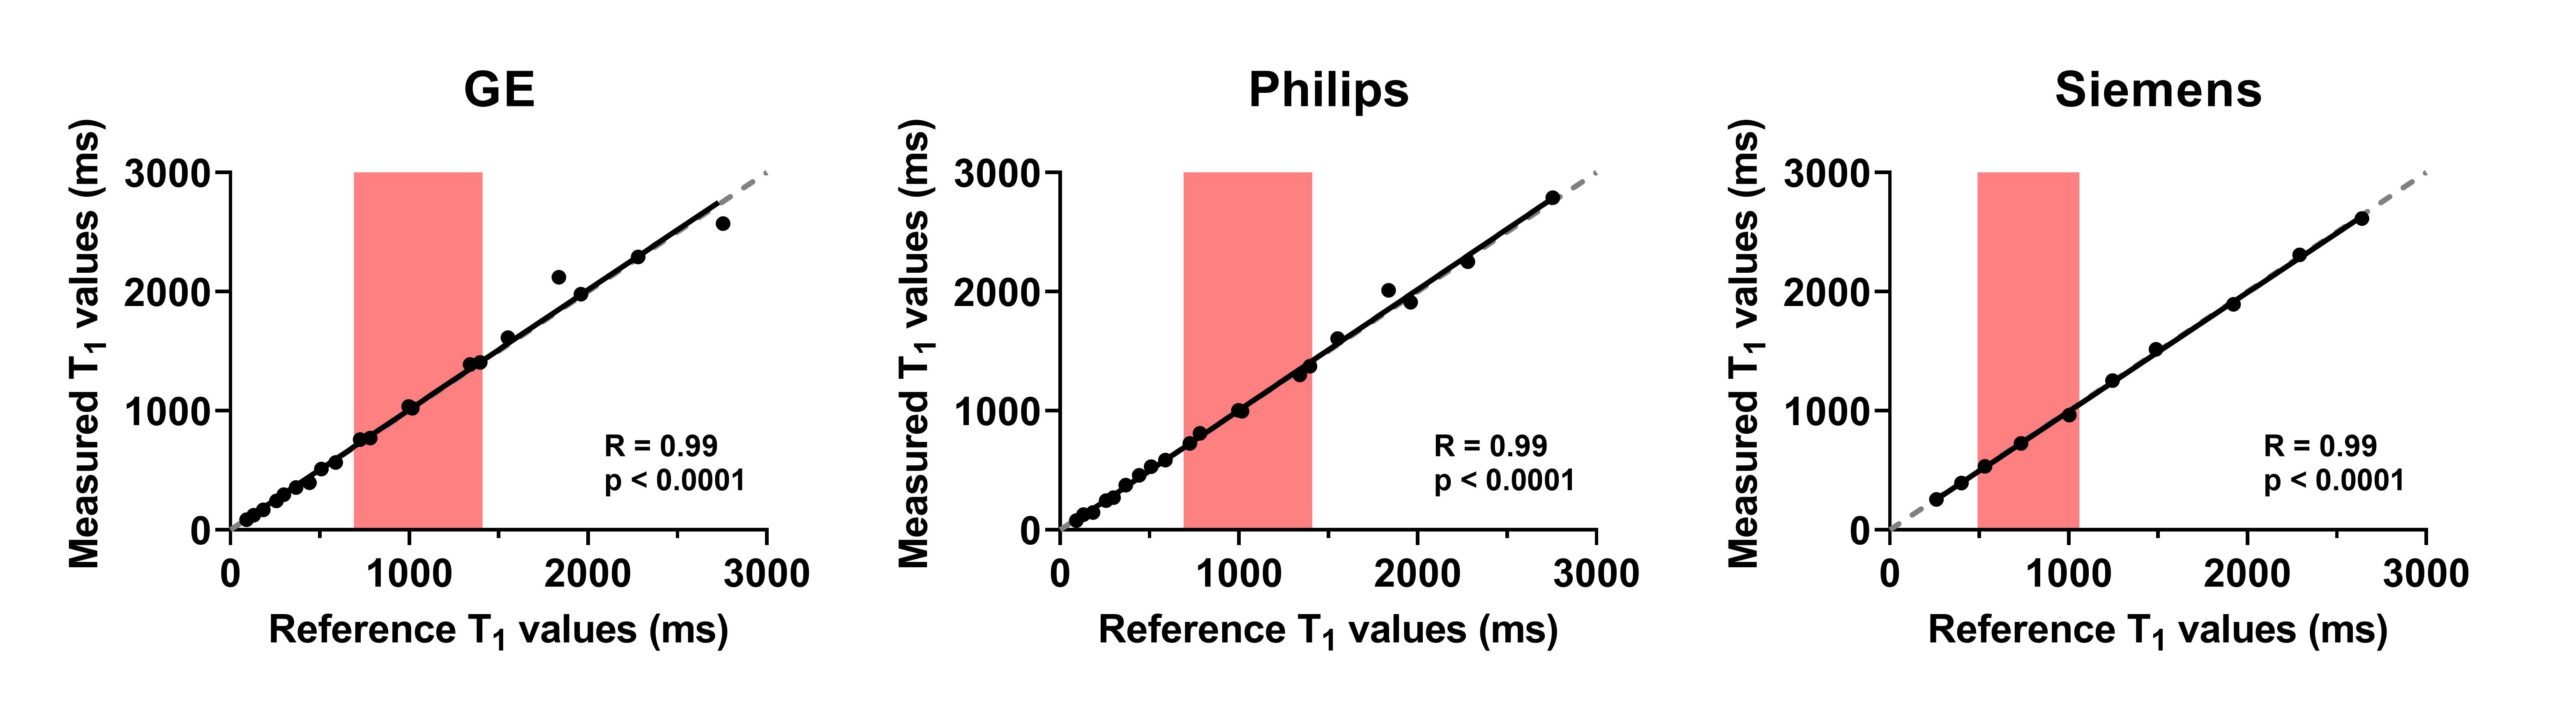
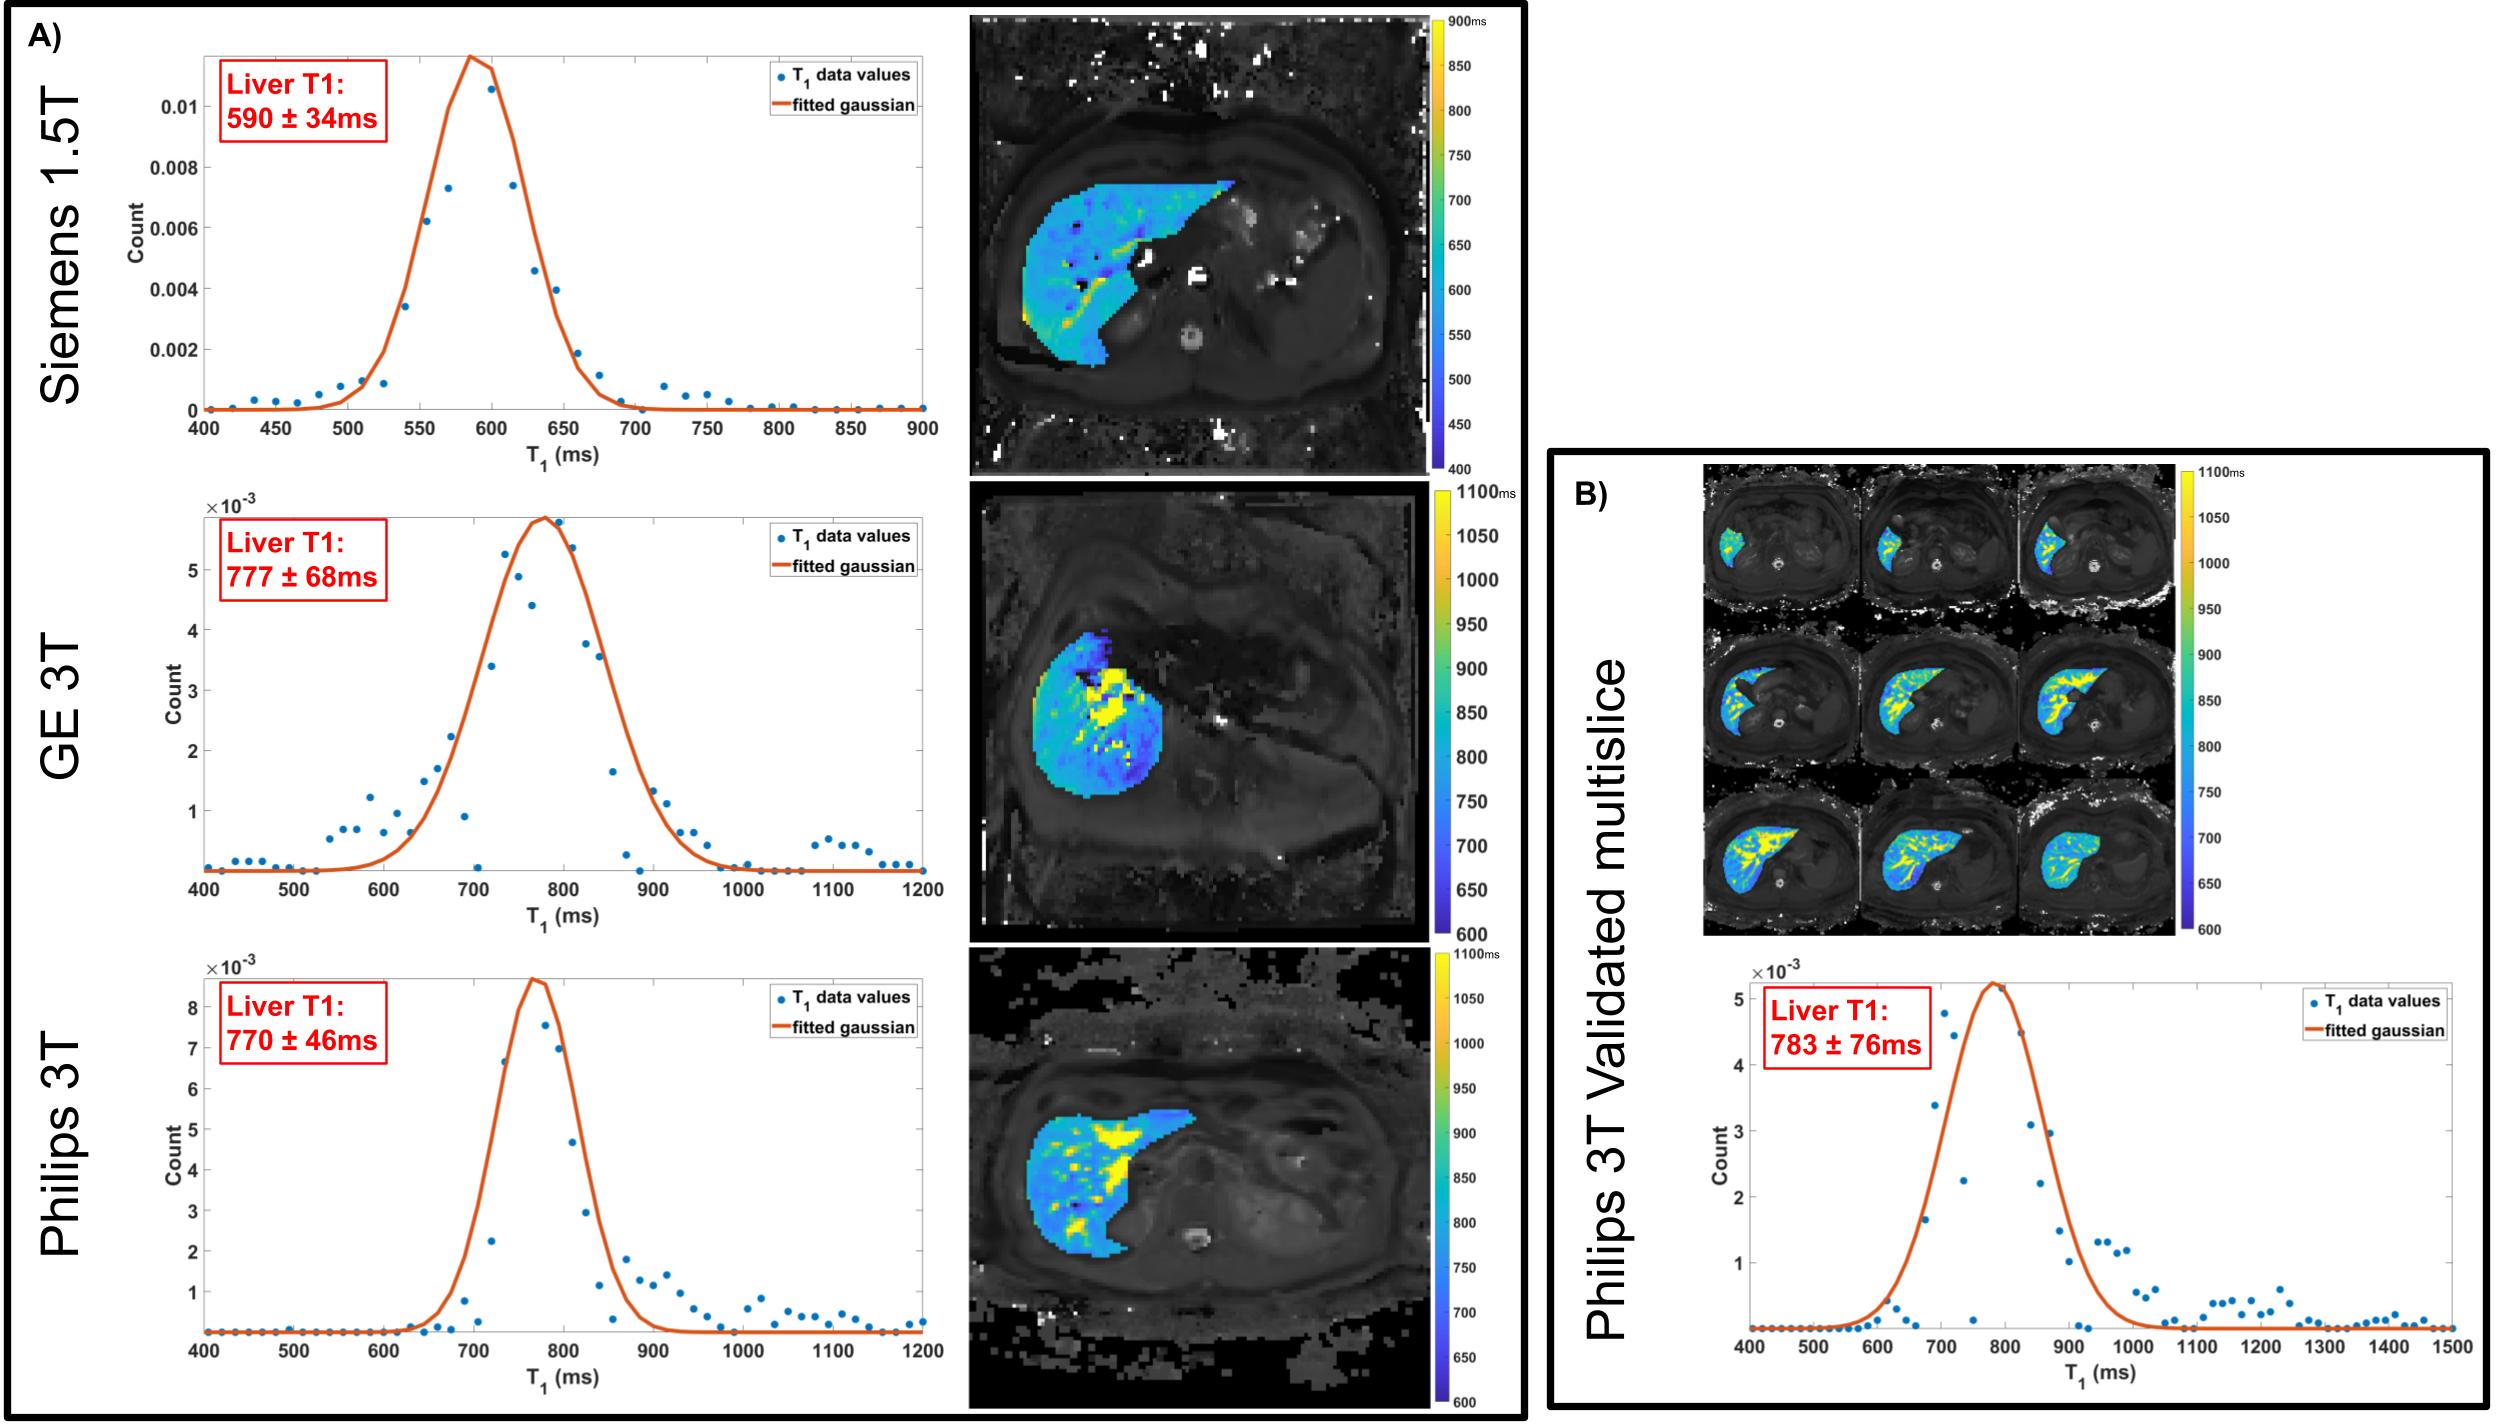
Figure 4. A Example T1 maps created from T1 data acquired using the vendor-product single slice fat suppressed spin-echo echo planar imaging(SE-EPI) commercially available sequences compared to the already Philips multi-slice fat suppressed SE-EPI T1 mapping method which has previously been validated against HVPG (B).