3135
Feature selection to facilitate surgical planning from MRI of Placenta Accreta Spectrum Disorder1School of Biomedical Engineering and Imaging Sciences (BMEIS), Kings College London, London, United Kingdom, 2Elizabeth Garret Anderson Institute for Women’s Health, University College London, London, United Kingdom, 3University College London Hospital, London, United Kingdom, 4Department of Medical Physics and Biomedical Engineering, University College London Hospitals, London, United Kingdom, 5Great Ormond Street Hospital for Children, London, United Kingdom, 6Sheffield Teaching Hospitals NHS Foundation Trust, Sheffield, United Kingdom, 7Centre for Medical Imaging, University College London, London, United Kingdom
Synopsis
Keywords: Data Processing, Placenta
Feature Selection Models provide a ranking of pathological MRI markers able to predict the outcome of Placenta Accreta Spectrum Disorder, which could be used to aid in clinical decision-making and improve maternal outcome. The potential being to reduce the workload of radiologists by establishing the most clinically relevant pathological MRI markers that predict outcome. Our results found three pathological markers to have the highest ranking to the outcomes with an average accuracy of 75% using a Random Forest Selection Model and Boruta algorithm.Introduction
Feature Selection Models can be used to predict clinical outcomes from identified MRI pathological markers. [1] These algorithms use methods of classification to show the accuracy of the pathological markers. These models include the Boruta and Multinominal Logistic Regression (MLR). Placenta Accreta Spectrum (PAS) Disorder is an abnormally adherent placenta to the myometrium (the muscle wall of the uterus) occurring in 0.2% of pregnancies. [2]–[4] It is vital that a full understanding of the adherence and its extent is known prior to surgery to reduce peri-operative complications such as catastrophic blood loss, which if uncontrolled, can lead to maternal death. MRI supports of diagnosis providing enhanced anatomical assessment, and a larger field-of-view. [5] Mathematical models can be used to support clinical decision-making by quantifying the accuracy and precision of known markers, supporting future automation of marker identification, and reducing the workload of radiologists and improving maternal outcomes by facilitating surgical planning.Here, outcome data for Major Obstetric Haemorrhage (MOH), Bladder Adherence (BA), and Placental Attachment Depth (PAD) are predicted against radiologist identified Pathological Markers (PM). These outcomes were chosen as they are quantifiable measures of maternal peri-operative morbidity.Methods
Twelve patients with suspected PAS had a 1.5T MRI performed at 32+3(27+0–38+6) weeks gestation. The uterus was imaged in at least 3 orthogonal planes (axial, coronal and sagittal).Established pathological MR imaging markers for PAS are used, based on existing guidelines[6] and identified as present or not by four expert radiologists. These are inputted as data against the outcome results into the Boruta Algorithm followed by Random Forest Classification Model (RFCM), and MLR.The Boruta algorithm is used first for feature selection, followed by RFCM. [9] The RFCM is designed to form a classification of each PM in the dataset through the construction of decision trees. At each step of the tree construction, a different subset of attributes is randomly selected. The classification of all PMs is performed, and each tree contributes its votes only to the classification of the PMs to the outcome data. [7], [8] The performance of the model is evaluated using a balanced accuracy score.MLR are extensions of binary logistic regression allowing more than two categories of the dependent or outcome variable, by providing p-values of statistical significance.[10] The MLR was used as a comparison method where the ranking is guided by the dependence of the marker on the outcome. MLR, however, is limited by the influence of outliers and the ability to be skewed if the data is not well distributed.Results
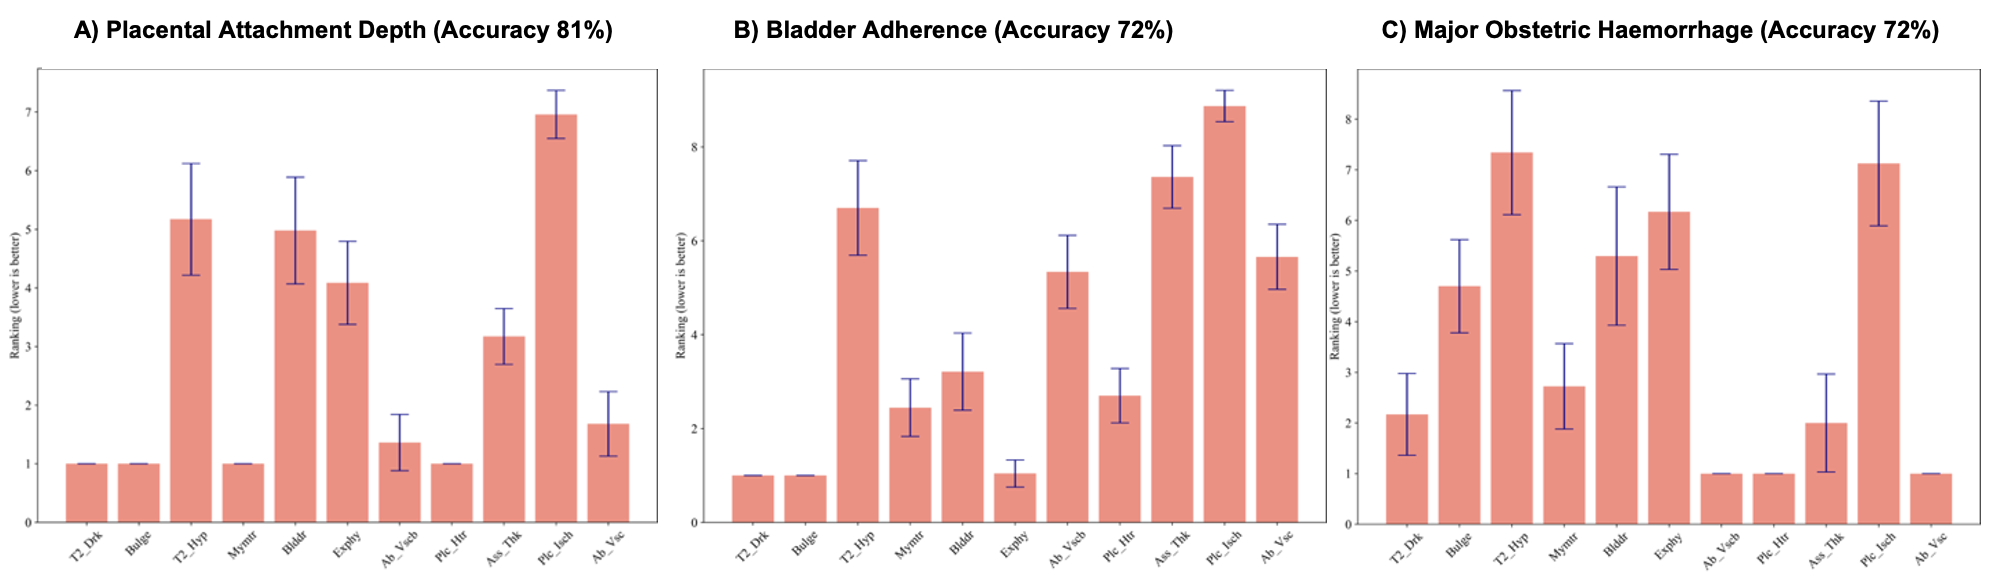
The Boruta Algorithm followed by the Random Forest Classification Model:RFCM classified PAD outcome with an accuracy of 81% for all the markers. Loss of T2 hypointense interface, bladder wall interruption and placental ischaemic infarction ranked the lowest throughout all the tests.BA had a 72% accuracy, with the loss of T2 hypointense interface, asymmetric thickening/shape of the placenta and placental ischaemic infarction ranked the lowest. MOH had 72% accuracy, with the loss of T2 hypointense interface, abnormal vascularisation of the placental bed and placental ischaemic infarction ranking the lowest.
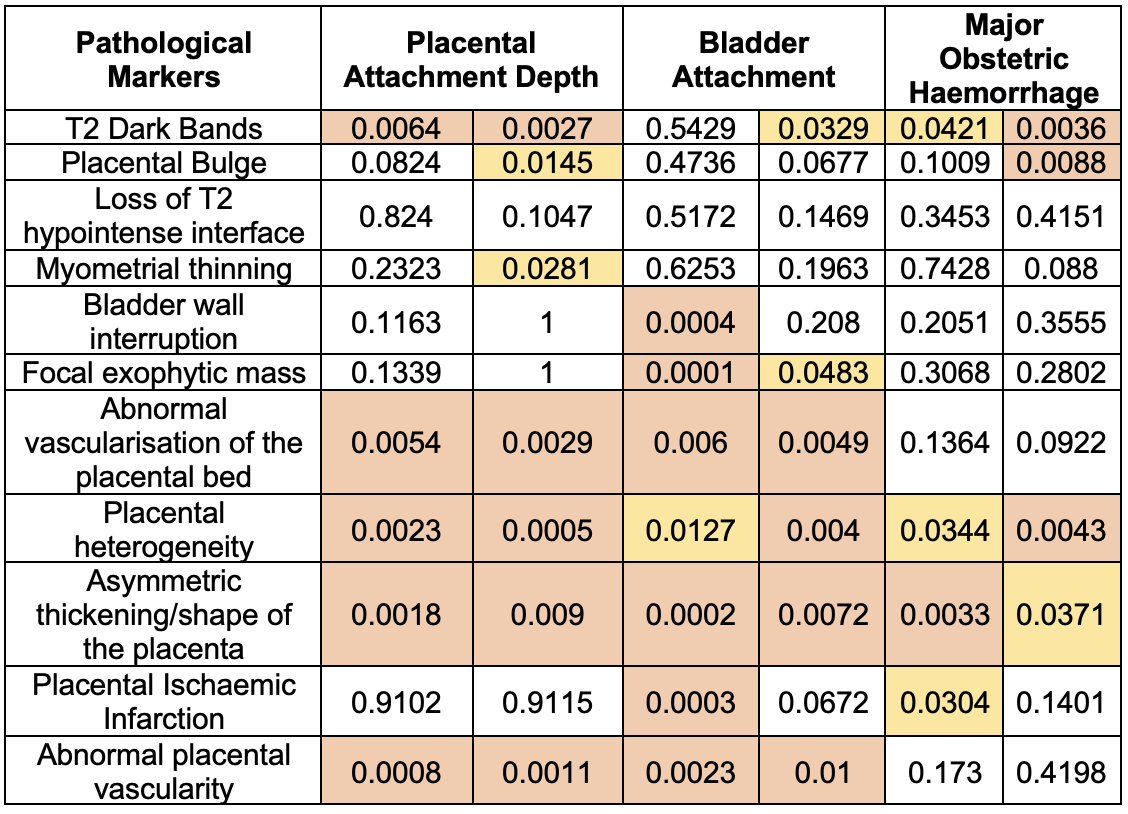
For MLR the non-significantly ranked markers for PAD were loss of T2 hypointense interface, bladder wall interruption, focal exophytic mass, and placental ischaemic infarction. All of which also ranked lower with the Boruta algorithm. For BA the non-significant pathological markers were placental bulge, loss of T2 hypointense interface, placental heterogeneity, and myometrial thinning. Loss of T2 hypointense interface also ranked low in RFCM. For the MOH the non-significantly ranked markers were loss of T2 hypointense interface, myometrial thinning, bladder wall interruption, focal exophytic mass, and abnormal vascularisation of the placental bed.
Discussion
The RFCM had a high accuracy rating for each of the outcomes. T2 dark bands and placental heterogeneity were the most predictive for all outcomes. The MLR ranked some similar markers as the Bortua for PAD, including T2 dark bands and placental heterogeneity. Conversely, the lowest-ranked pathological markers were relatively consistent throughout both models and all outcomes. Loss of T2 hypointense interface, bladder wall interruption and placental ischaemic infarction were not found to be predictive by RFCM or MLR.MLR is limited by not having a framework for potential error calculation and can be influenced by outliers. [10] RFCM often ranks higher than other feature selection models, although it can be time-consuming to run. [1] The results are also limited by the identification of the PMs not being consistent among all the radiologists, affecting the accuracy of the dataset. More data would be required to mitigate this, although this likely also reflects the poor predictive value of the chosen PMs. The identification of the least useful PMs may be useful in focussing radiologist attention on the more relevant and measurable PMs with regards to predicting surgical outcomes. The highly ranked identified PMs may also be those most useful for focussing resources for automatic identification.Conclusion
The Feature Selection Models used identified the highest and lowest correlated PMs to the outcome of PAS with an average of 75% accuracy. This could reduce the workload of the radiologists and improve surgical planning in PAS. Further studies of Feature Selection Models are required for PM detection optimisation.Acknowledgements
This research was supported by the Wellcome Trust (210182/Z/18/Z) and EPSRC (NS/A000027/1). The funders had no direction in the study design, data collection, data analysis, manuscript preparation or publication decisionReferences
[1] M. B. Kursa, A. Jankowski, and W. R. Rudnicki, “Boruta - A system for feature selection,” Fundam Inform, vol. 101, no. 4, pp. 271–285, 2010, doi: 10.3233/FI-2010-288.
[2] “Placenta Accreta Spectrum | ACOG.” https://www.acog.org/clinical/clinical-guidance/obstetric-care-consensus/articles/2018/12/placenta-accreta-spectrum (accessed Jun. 22, 2022).
[3] E. Jauniaux, W. Zheng, and J. Yan, “Confirming the Diagnosis and Classifying Placenta Accreta Spectrum (PAS) Disorders: Minutes of 2020 Online International Workshop on PAS in Beijing,” Maternal-Fetal Medicine, vol. 3, no. 4, pp. 229–231, Oct. 2021, doi: 10.1097/fm9.0000000000000106.
[4] M. A. Belfort, “Placenta accreta,” Am J Obstet Gynecol, vol. 203, no. 5, pp. 430–439, 2010, doi: 10.1016/J.AJOG.2010.09.013.
[5] H. Kapoor, M. Hanaoka, A. Dawkins, and A. Khurana, “Review of MRI imaging for placenta accreta spectrum: Pathophysiologic insights, imaging signs, and recent developments,” Placenta, vol. 104, pp. 31–39, Jan. 2021, doi: 10.1016/J.PLACENTA.2020.11.004.
[6] P. Jha et al., “Society of Abdominal Radiology (SAR) and European Society of Urogenital Radiology (ESUR) joint consensus statement for MR imaging of placenta accreta spectrum disorders”, doi: 10.1007/s00330-019-06617-7.
[7] M. Khalilia, S. Chakraborty, and M. Popescu, “Predicting disease risks from highly imbalanced data using random forest,” BMC Med Inform Decis Mak, vol. 11, no. 1, 2011, doi: 10.1186/1472-6947-11-51.[8] M. B. Kursa and W. R. Rudnicki, “Feature Selection with the Boruta Package,” 2010. [Online]. Available: http://www.jstatsoft.org/
[9] H. Irzan, M. Hütel, H. O’reilly, S. Ourselin, N. Marlow, and A. Melbourne, “Measuring the functional connectome in extremely preterm born young adults.”
[10] J. Fox, “Effect Displays for Generalized Linear Models,” Source: Sociological Methodology, vol. 17, pp. 347–361, 1987.
Figures