3134
Microscopic fractional anisotropy with free water elimination1Medical Biophysics, Western University, London, ON, Canada, 2Centre for Functional and Metabolic Mapping, Robarts Research Institute, London, ON, Canada
Synopsis
Keywords: Data Processing, Neuro
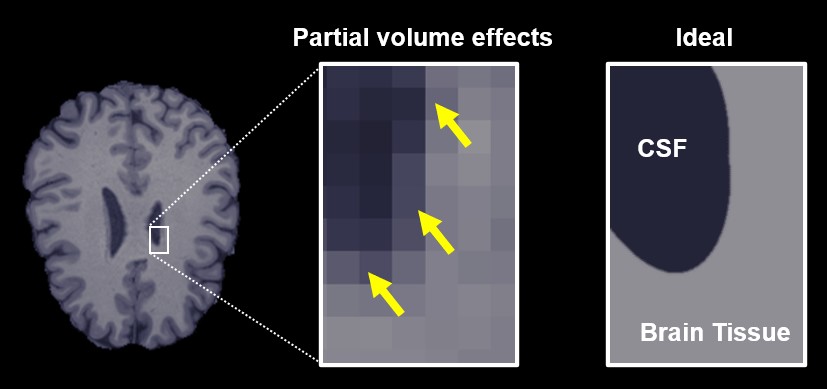
Water diffusion anisotropy is a diffusion MRI metric that is sensitive to brain injury and neurodegeneration. Microscopic fractional anisotropy (μFA) is a new metric of diffusion anisotropy that is immune to crossing fiber effects, unlike traditional FA, which enables probing of axon integrity in gray matter and crossing white matter tracts. However, μFA is underestimated in voxels adjacent to cerebrospinal fluid (CSF) due to partial volume contamination, which is particularly problematic in cortical gray matter and tissue adjacent to ventricles. Here, we demonstrate a free water elimination method to remove the CSF signal from μFA measurements in four healthy volunteers.Introduction
Fractional anisotropy (FA) is a diffusion MRI (dMRI) metric that is sensitive to neuronal injury and degeneration, making it useful in the study of traumatic brain injury 1 and disorders like stroke 2 and Alzheimer’s disease 3. However, FA is underestimated in voxels with significant free water partial volumes (Fig 1) and voxels containing crossing or fanning axons. To address the first issue, free water elimination models were developed to acquire tissue-specific measurements of FA and other dMRI metrics by separating the MRI signal into a tissue component and a free water component; this enables more accurate estimation of FA in regions with free water partial volumes, namely from cerebrospinal fluid 4. Microscopic fractional anisotropy (μFA) is a recent metric that addresses the second issue by estimating diffusion anisotropy independent of axon fiber orientation 5,6, offering an improvement over FA in brain regions with crossing or fanning axons.In this work, we present a method to estimate μFA using a free water elimination signal model with the goal of quantifying water diffusion anisotropy that is both independent of axon fiber orientation and less sensitive to free water partial volumes.
Methods
Four healthy volunteers (2 male, 2 female, mean age 28.0 ± 6.6 years) were scanned on a 3T whole body MRI system (Siemens Prisma) with 80 mT/m strength and 200 T/m/s slew rate. Volunteers underwent a T1-MPRAGE acquisition with 1mm isotropic resolution and a dMRI protocol with 5 acquisitions with no diffusion weighting, and 3, 15, 6, and 22 linear tensor encoding (LTE) acquisitions plus 6, 10, 10, and 27 spherical tensor encoding (STE) acquisitions at b-values of 700, 1000, 1400, and 2000s/mm2. Other parameters for the dMRI protocol were TE/TR=94/4500ms. FOV=220x220mm2, and 2mm isotropic resolution.dMRI data were denoised 7 and corrected for Eddy current 8 and Gibbs ringing artifacts 9. The LTE and STE data were powder averaged at each b-value and were then fitted to the free water elimination diffusion kurtosis imaging model, as described in equations (1) and (2) 10: \[(1) \ S_{b,LTE} = S_0 \left( fe^{-bD+ \frac{b^2D^2K_{LTE}}{6}} + (1-f)e^{-b(3e-3))} \right) \] \[(2) \ S_{b,STE} = S_0 \left( fe^{-bD+ \frac{b^2D^2K_{STE}}{6}} + (1-f)e^{-b(3e-3))} \right) \] where Sb,LTE and Sb,STE are the respective powder average LTE and STE signals at a particular b-value, S0 is the MRI signal with no diffusion weighting, D is the mean tissue diffusivity, KLTE and KSTE are the respective mean LTE and STE diffusion kurtosis terms, and f is the tissue volume fraction. μFA was then computed as per equation (3) 6: \[(3) \ \mu FA = 1.5^{0.5}* \left( 1+\frac{6}{5(K_{LTE}-K_{STE})} \right)^{-0.5} \] This μFA metric will henceforth be referred to as μFAFWE. In addition, μFA was also estimated using the technique described in Arezza et al 11 and will be referred to as μFAConv. For full details regarding the fitting method, refer to Arezza et al 12.
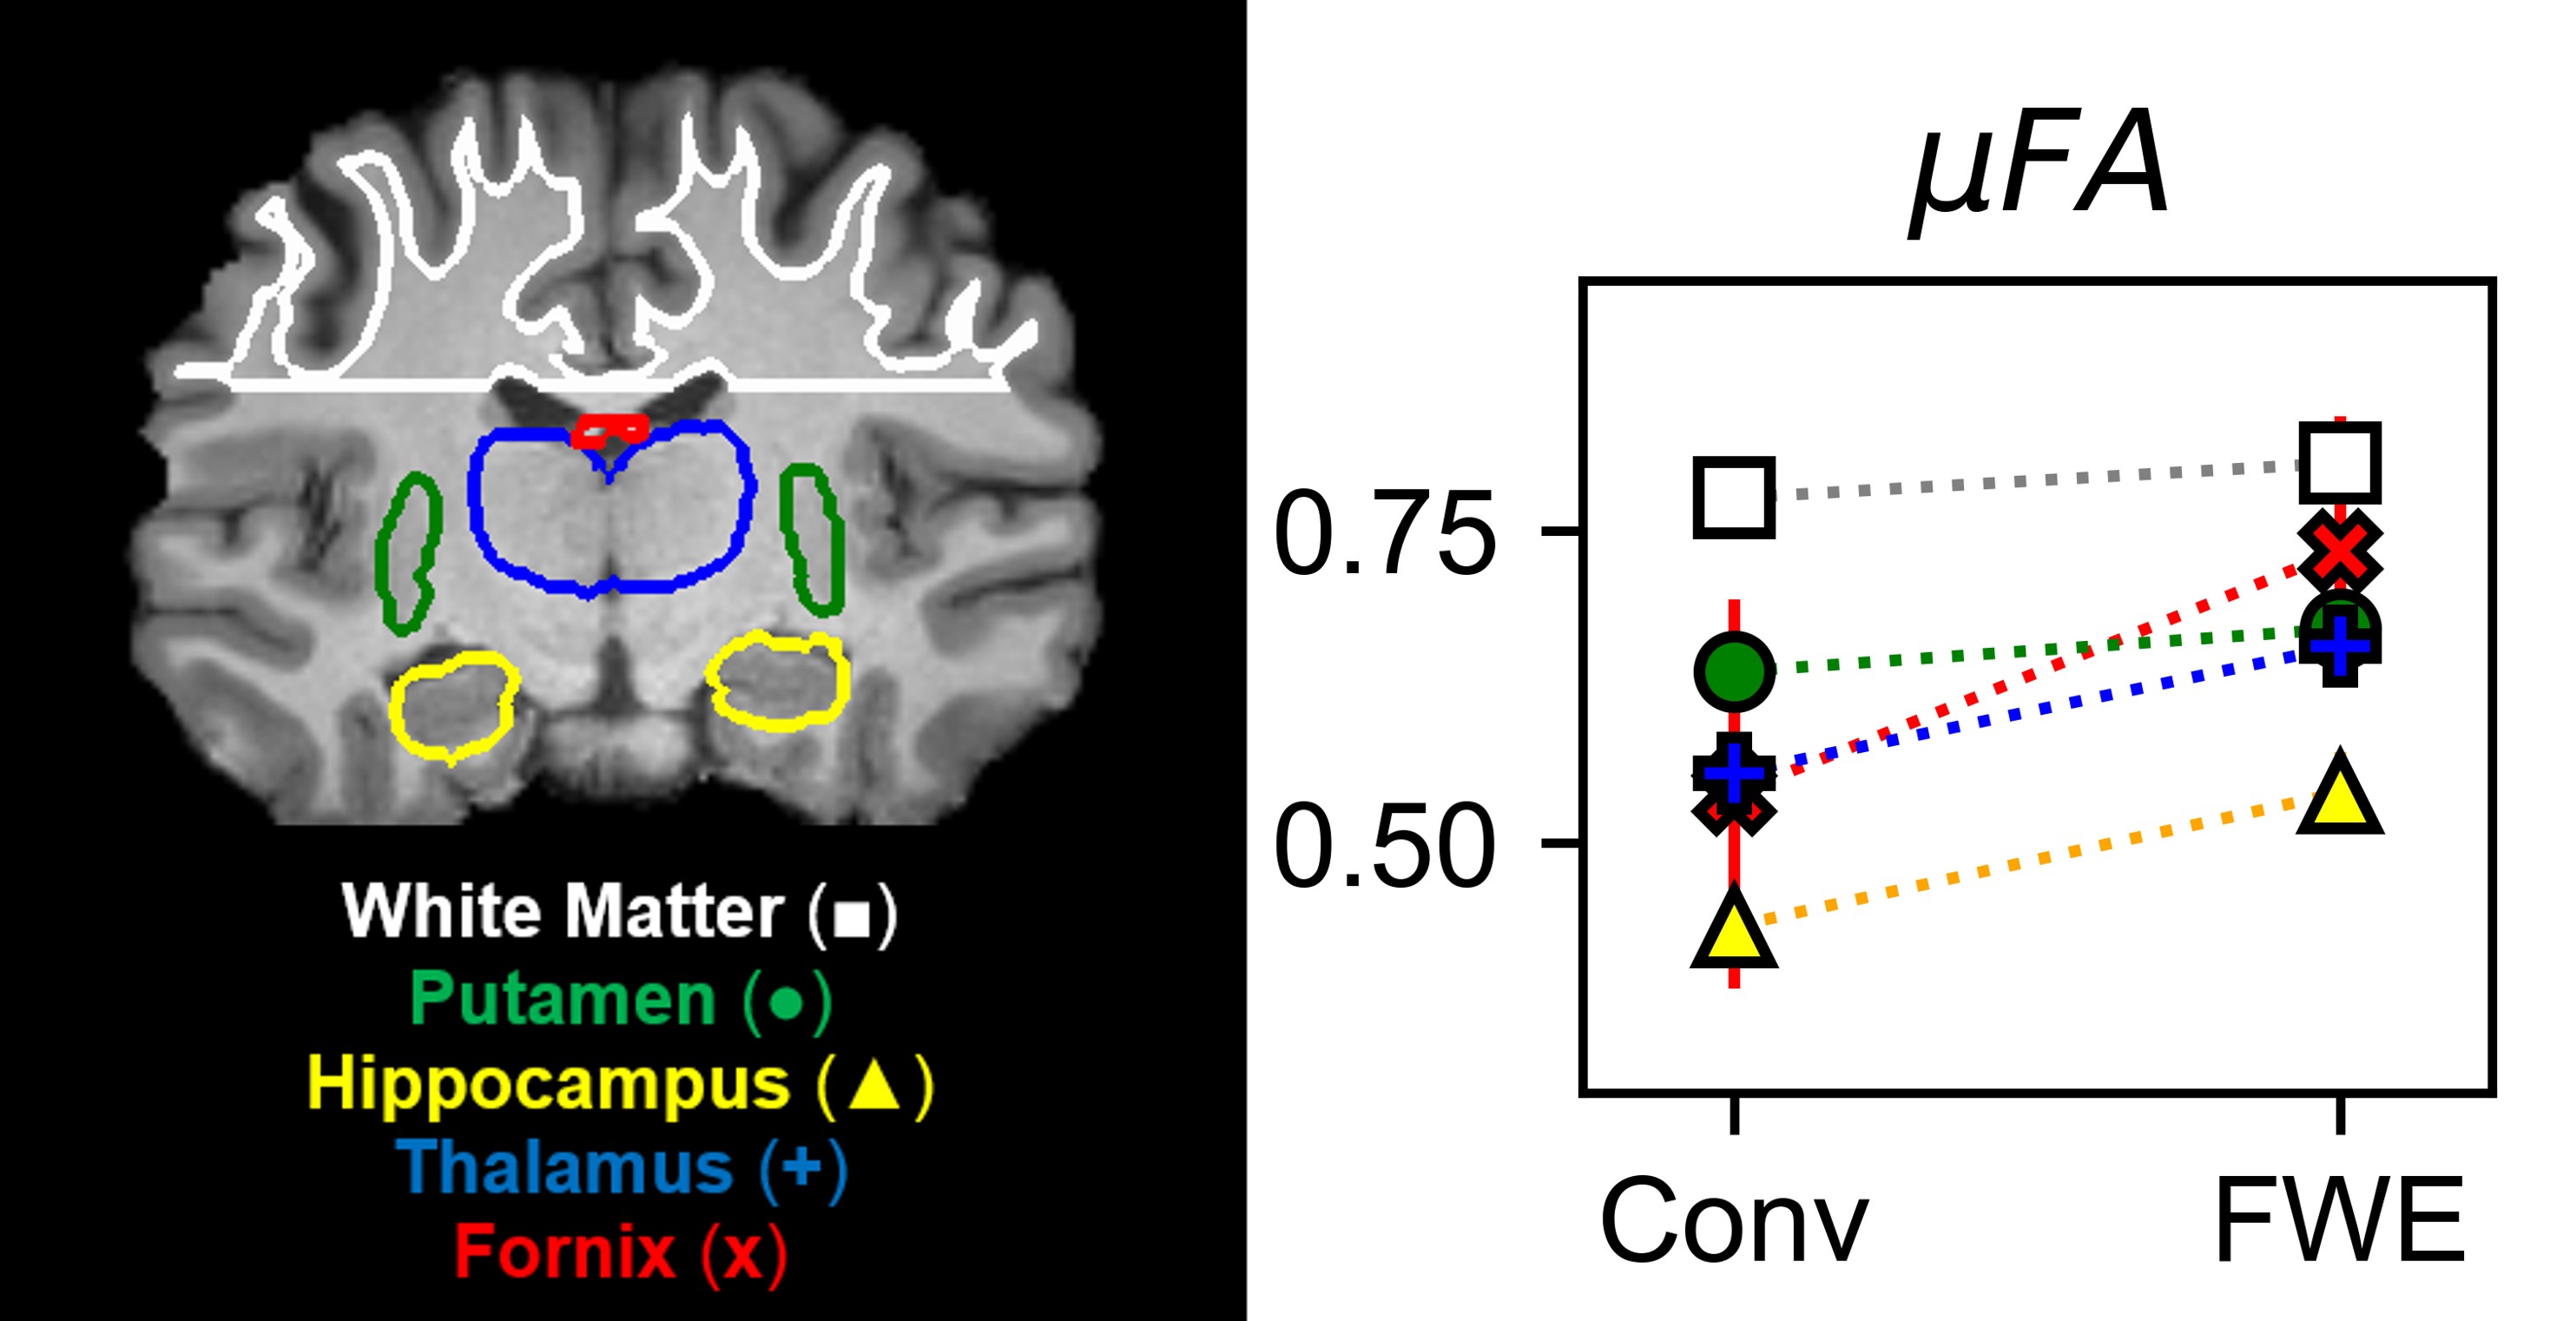
For each volunteer, five ROIs were obtained using the T1-weighted images; white matter (WM), putamen, hippocampus, and thalamus masks were generated in FSL 13,14, while a fornix mask was manually drawn by author NA. Regions were chosen based on their free water content: WM and putamen are minimally contaminated by free water content, the thalamus and hippocampus are moderately contaminated, and the hand-drawn fornix ROI is likely significantly contaminated. ROI masks were registered to dMRI space using ANTS software (https://github.com/ANTsX/ANTs). Mean μFAFWE, μFAConv, and f were computed in each ROI.
Results
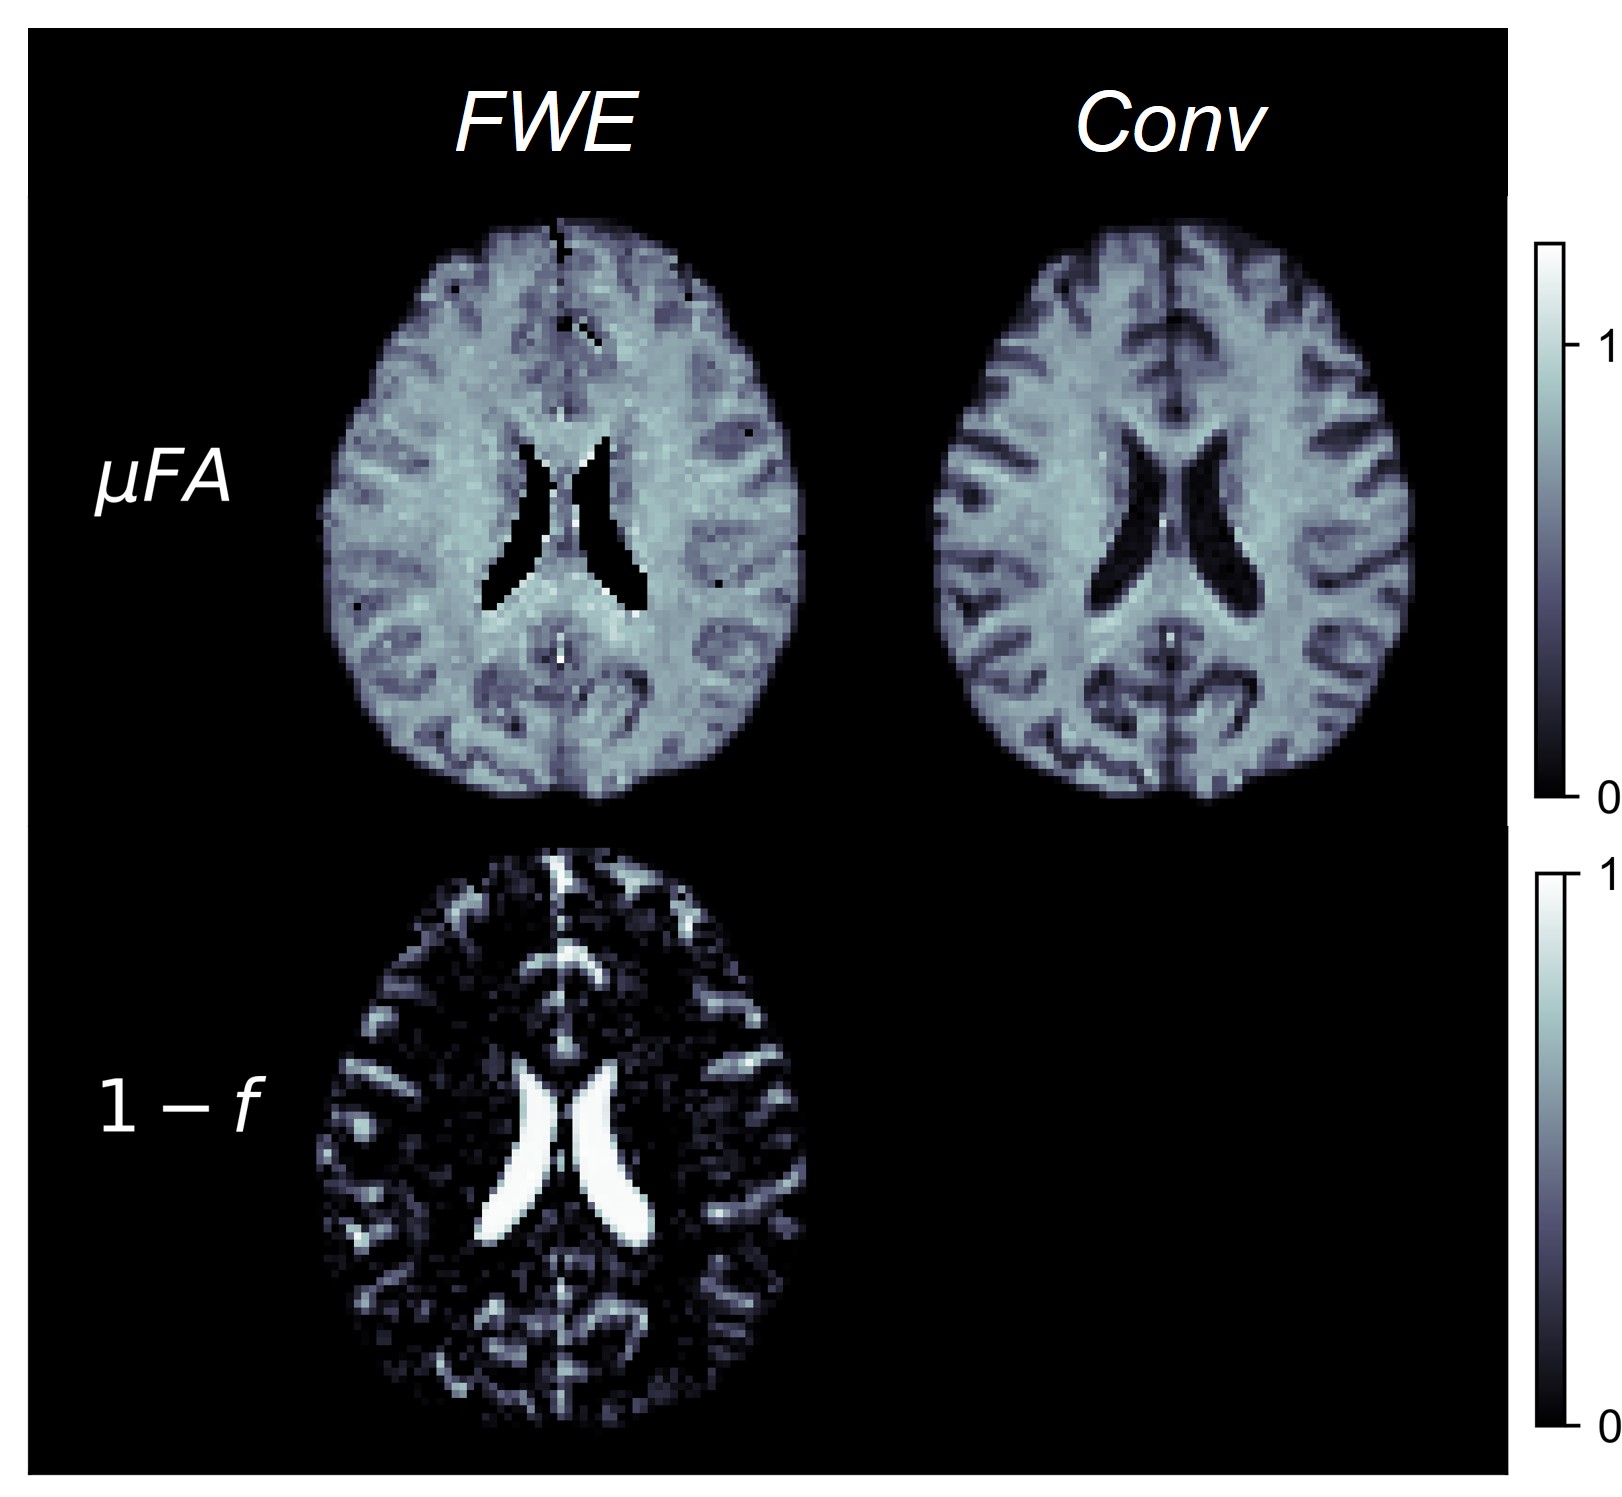
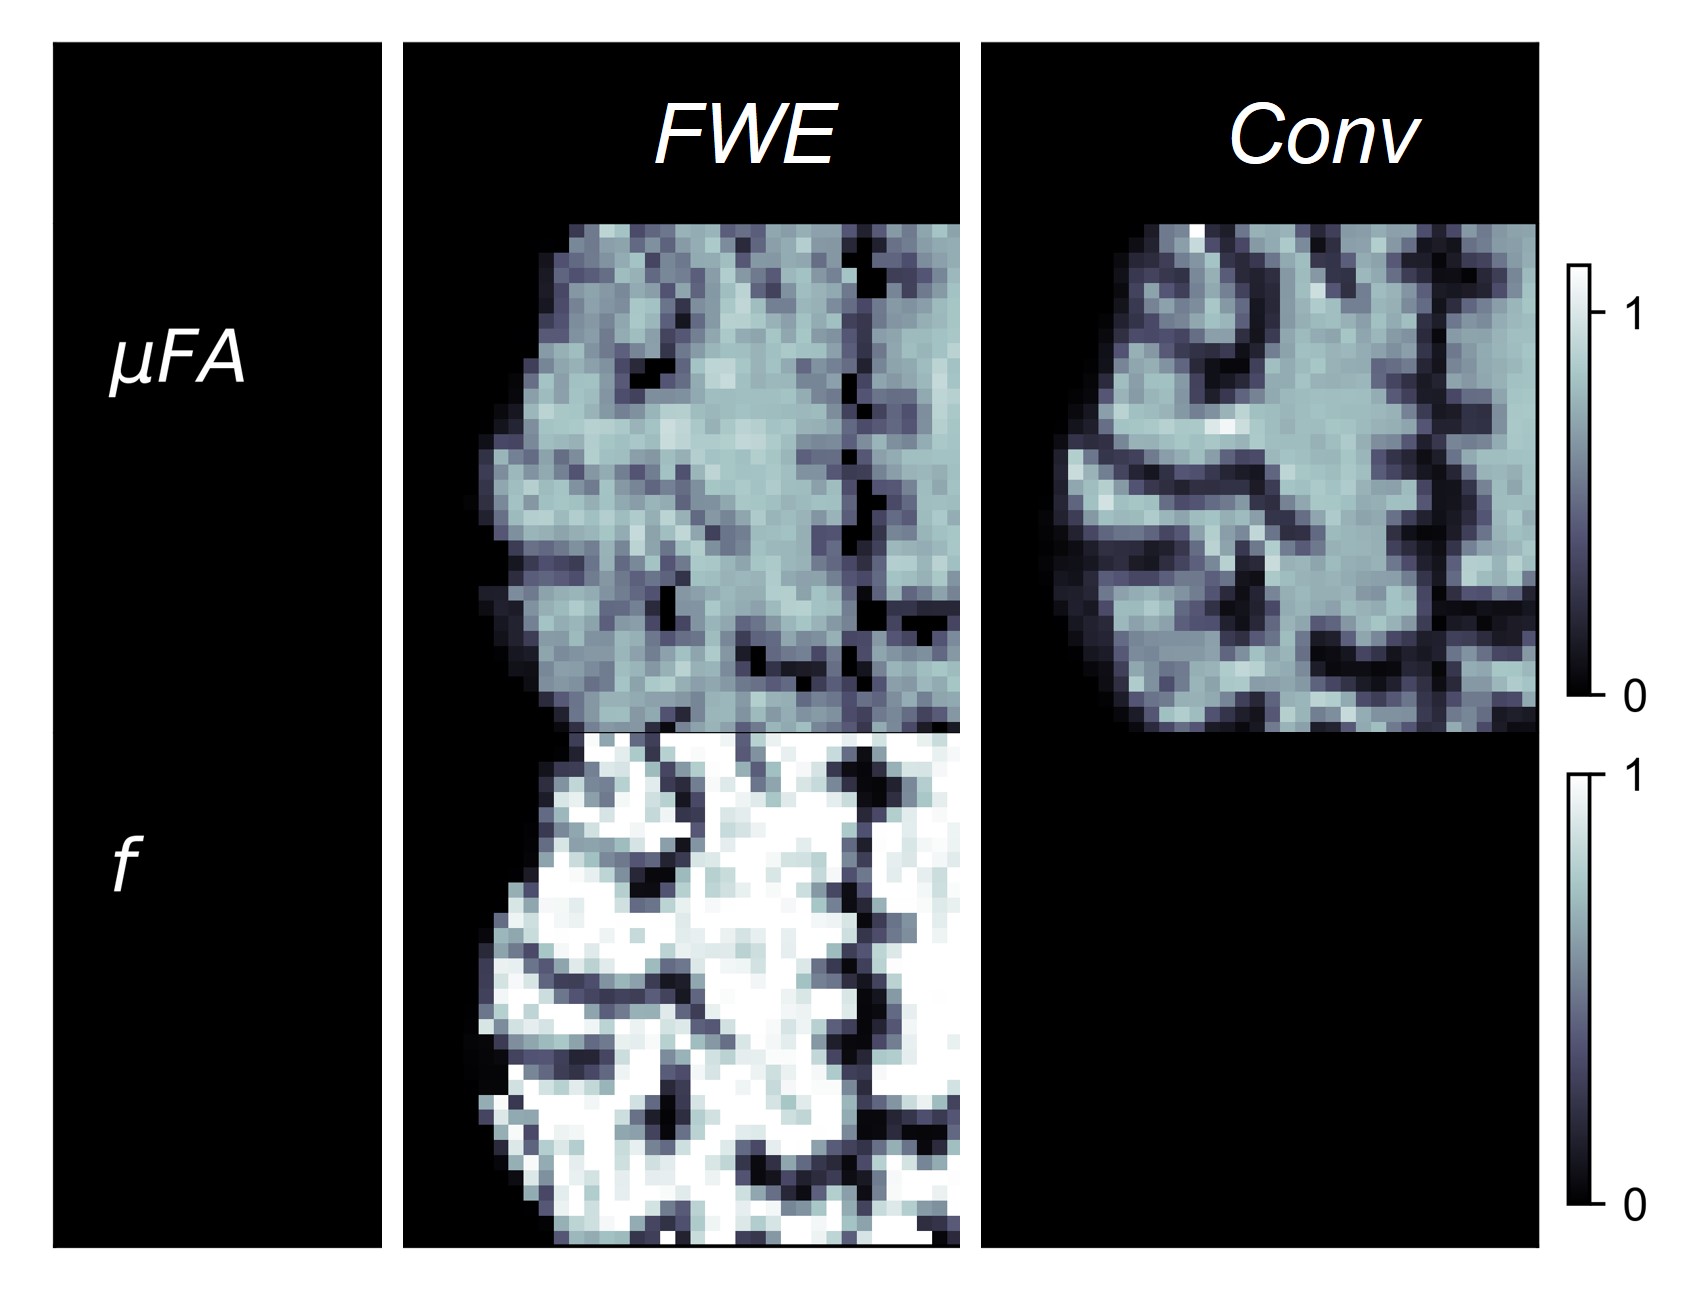
Example slices of μFAFWE, μFAConv, and the free water volume fraction (1-f) are depicted in Fig 2, while cortex images of μFAFWE, μFAConv, and f are shown in Fig 3. Mean f was measured to be 0.96 in the WM and putamen regions, 0.82 in the thalamus and hippocampus regions, and 0.64 in the fornix region. μFAFWE was elevated relative to μFAConv in all ROIs, as shown in Fig 4, and the percentage difference between methods inversely correlated with f. The smallest differences between μFAFWE and μFAConv were observed in the WM (3.5%) and putamen (5.3%), moderate differences were observed in the thalamus (16.8%) and hippocampus (22.0%), and the greatest difference was observed in the fornix (30.5%).Discussion
There is much interest in diffusion MRI of the gray matter, and μFA provides a method to probe neurites in these regions where there is no coherent directionality. However, many gray matter regions are adjacent to CSF, which necessitates methods to account for the partial volume effects. The FWE method presented in this work may provide a measure of water diffusion anisotropy that is more specific to tissue in these regions. As expected, f was greatest and the percentage difference between μFAFWE and μFAConv was smallest in the minimally-contaminated WM and putamen regions, while f was smallest and the difference between μFA measurements was greatest in the significantly free water-contaminated fornix.It should be noted that the model used in this work doesn’t consider exchange between diffusion compartments or time-dependent diffusion effects, potentially leading to biases in regions where these effects are significant.
Acknowledgements
This work was supported by the Natural Sciences and Engineering Research Council of Canada (NSERC) under Grant Number RGPIN-2018-05448, Canada Research Chairs (950-231993), Canada First Research Excellence Fund to BrainsCAN, and the NSERC Postgraduate Doctoral Scholarship (PGS-D) program.References
1. Strangman, G. E. et al. Fractional anisotropy helps predicts memory rehabilitation outcome after traumatic brain injury. NeuroRehabilitation 31, 295–310 (2012).
2. Alegiani, A. C. et al. Comprehensive analysis of early fractional anisotropy changes in acute ischemic stroke. PLoS One 12, e0188318 (2017).
3. Zhang, Y. et al. White matter damage in frontotemporal dementia and Alzheimer’s disease measured by diffusion MRI. Brain 132, 2579–2592 (2009).
4. Pasternak, O., Sochen, N., Gur, Y., Intrator, N. & Assaf, Y. Free water elimination and mapping from diffusion MRI. Magn. Reson. Med. 62, 717–730 (2009).
5. Jespersen, S. N., Lundell, H., Sønderby, C. K. & Dyrby, T. B. Orientationally invariant metrics of apparent compartment eccentricity from double pulsed field gradient diffusion experiments. NMR Biomed. 26, 1647–1662 (2013).
6. Lasič, S., Szczepankiewicz, F., Eriksson, S., Nilsson, M. & Topgaard, D. Microanisotropy imaging: quantification of microscopic diffusion anisotropy and orientational order parameter by diffusion MRI with magic-angle spinning of the q-vector. Frontiers in Physics 2, (2014).
7. Veraart, J. et al. Denoising of diffusion MRI using random matrix theory. Neuroimage 142, 394–406 (2016).
8. Andersson, J. L. R. & Sotiropoulos, S. N. An integrated approach to correction for off-resonance effects and subject movement in diffusion MR imaging. Neuroimage 125, 1063–1078 (2016).
9. Kellner, E., Dhital, B., Kiselev, V. G. & Reisert, M. Gibbs-ringing artifact removal based on local subvoxel-shifts. Magn. Reson. Med. 76, 1574–1581 (2016).
10. Collier, Q. et al. Diffusion kurtosis imaging with free water elimination: A bayesian estimation approach. Magn. Reson. Med. 80, 802–813 (2018).
11. Arezza, N. J. J., Tse, D. H. Y. & Baron, C. A. Rapid microscopic fractional anisotropy imaging via an optimized linear regression formulation. Magn. Reson. Imaging 80, 132–143 (2021).
12. Arezza, N. J. J., Omer, M. & Baron, C. A. Estimation of free water-corrected microscopic fractional anisotropy. medRxiv (2022) doi:10.1101/2022.10.27.22281560.
13. Zhang, Y., Brady, M. & Smith, S. Segmentation of brain MR images through a hidden Markov random field model and the expectation-maximization algorithm. IEEE Trans. Med. Imaging 20, 45–57 (2001).
14. Patenaude, B., Smith, S. M., Kennedy, D. N. & Jenkinson, M. A Bayesian model of shape and appearance for subcortical brain segmentation. Neuroimage 56, 907–922 (2011).
Figures