3133
Head-to-head Comparison of Free Water Elimination Methods in Fornix1The Cleveland Clinic, Cleveland, OH, United States, 2Imaging Institute, The Cleveland Clinic, Cleveland, OH, United States
Synopsis
Keywords: Data Analysis, Alzheimer's Disease
Diffusion Tensor Imaging measures in fornix may serve as a biomarker in Alzheimer’s disease. However, partial volume averaging between the fornix and surrounding cerebrospinal fluid imposes systematic bias that can conflate tissue microstructure with atrophy. Free Water Elimination methods have been proposed as a solution, but comparison between these methods is limited. We perform direct comparison between the approaches in terms of repeatability and bias.INTRODUCTION
Diffusion Tensor Imaging (DTI) measures in fornix may serve as a predictive biomarker and therapeutic target in Alzheimer’s disease1. The role of the fornix is also a target for therapeutic stimulation2. However, partial volume averaging (PVA) between the fornix and surrounding cerebrospinal fluid (CSF) imposes systematic bias that can conflate tissue microstructure with atrophy3. Free Water Elimination (FWE) methods have been proposed as a solution4,5, but comparison between these methods is limited. We perform direct comparison between the approaches in terms of repeatability and bias.METHODS
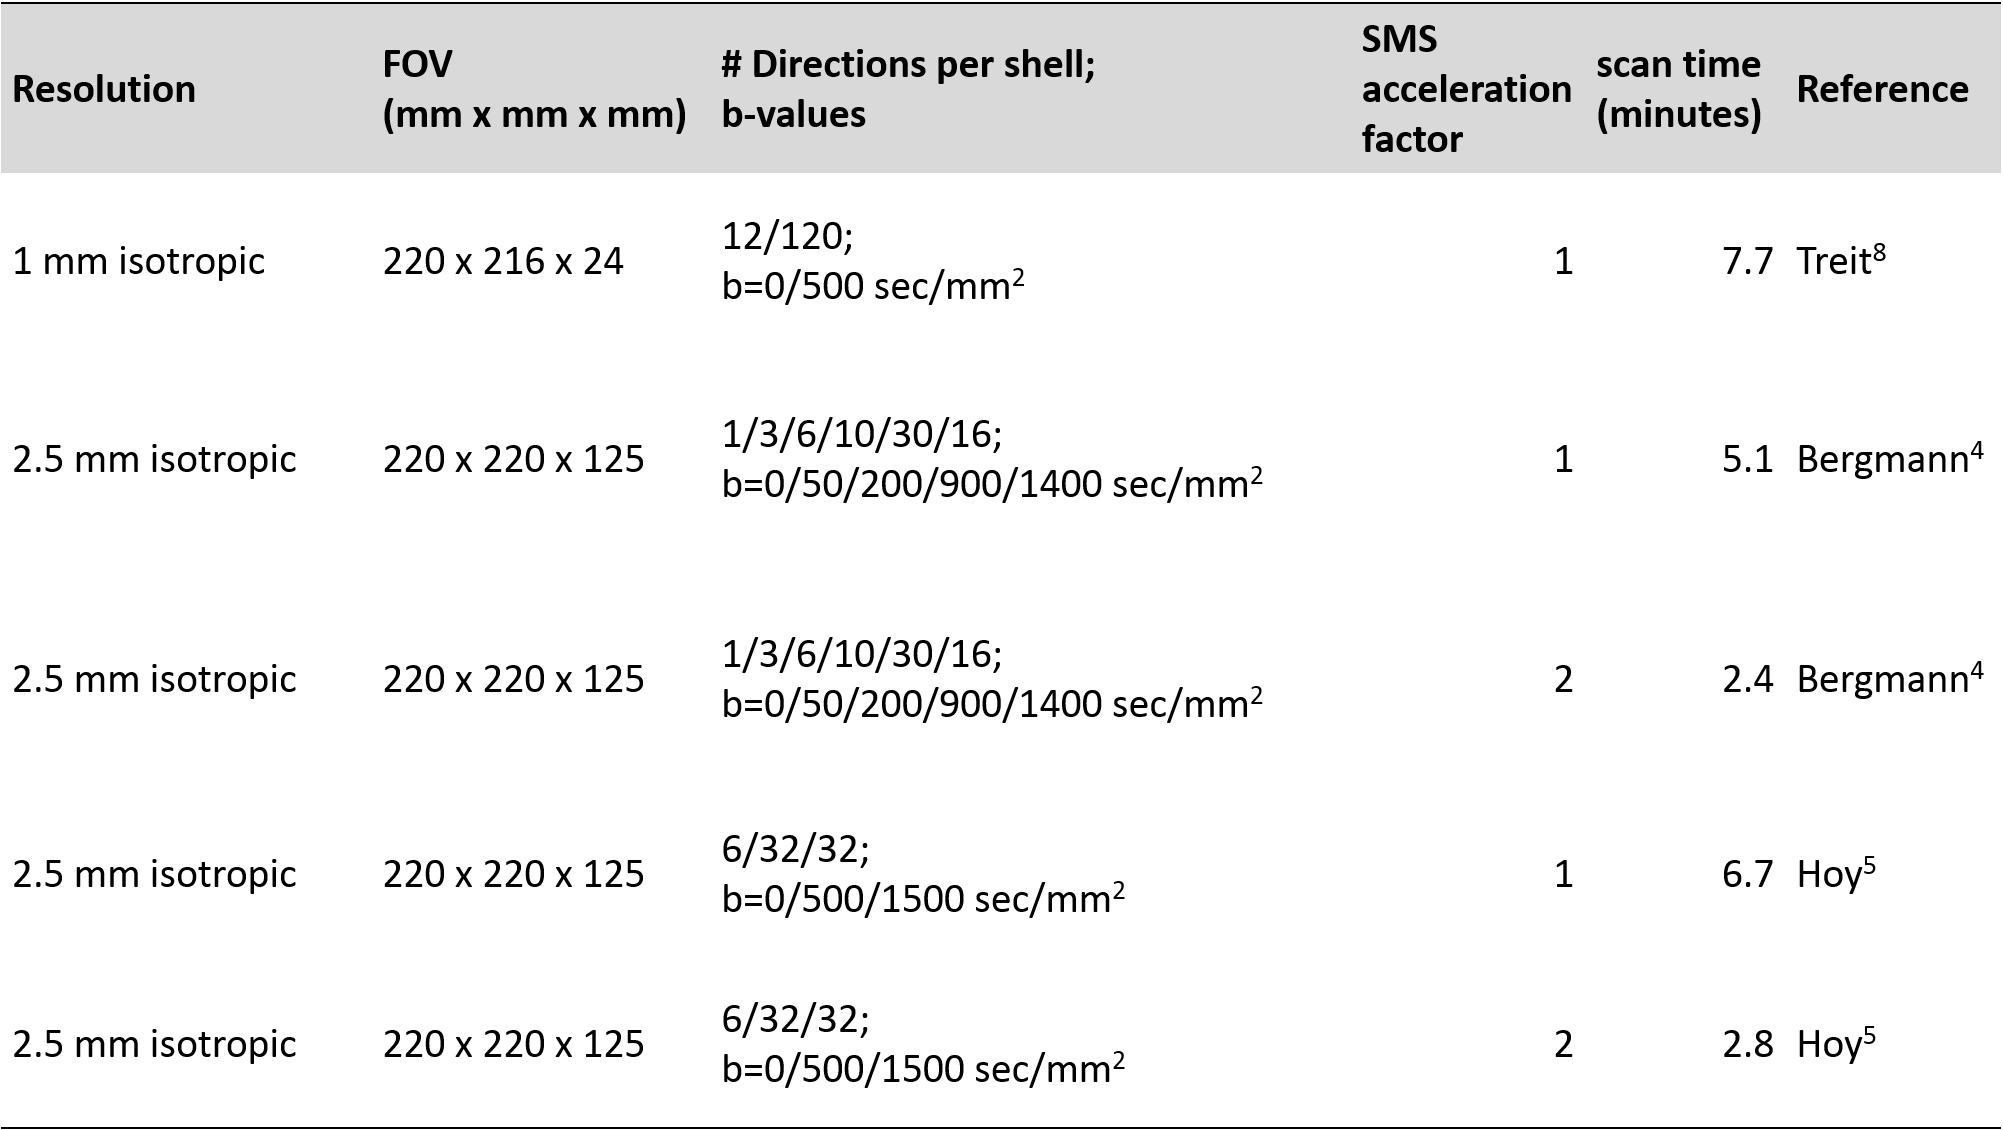
Four healthy subjects were scanned under an IRB-approved, scan-reposition-rescan protocol on a Siemens 3T Prisma with standard 32-channel head coil (Siemens Healthineers, Erlangen). Five sets of DTI scans were performed in each scan session (Table 1). Each acquisition included a reverse phase encode b=0 scan for distortion correction with topup 6. Data from each acquisition underwent the same initial postprocessing pipeline7.There are qualitative differences between the acquisitions that determined the type of algorithm used to calculate the diffusion tensor in each case. The 1mm acquisition followed the work of Treit et al.8 and used a single shell acquisition with b=500sec/mm2. This acquisition uses high spatial resolution to avoid PVA. Therefore, a standard weighted least squares fit was used to calculate the diffusion tensor using dtifit6. Scan time was kept short by limiting the number of slices. The acquisitions proposed by Bergmann et al.4 and by Hoy et al.5 used 2.5mm isotropic voxels but different sets of diffusion weightings. The Bergmann acquisition spreads diffusion weightings among 5 different bvalues. The diffusion tensor of CSF-free tissue is calculated with an algorithm that iteratively fits the innermost shells to estimate the CSF fraction, subtracts the CSF signal from the overall signal, then estimates the diffusion tensor from the remaining signal. The algorithm was implemented in-house with MATLAB9. The Hoy acquisition uses two bvalues. Calculation of the CSF-free diffusion tensor used a nonlinear least squares fit implemented by Henriques et al.10 in dipy11. The 2.5mm acquisitions were also performed with simultaneous multi-slice acceleration factor 2 to reduce scan time. Each scan session also included an MPRAGE acquisition that was used to delineate the fornix12. The fornix ROI was coregistered to each DTI acquisition using align_epi_anat13.
RESULTS
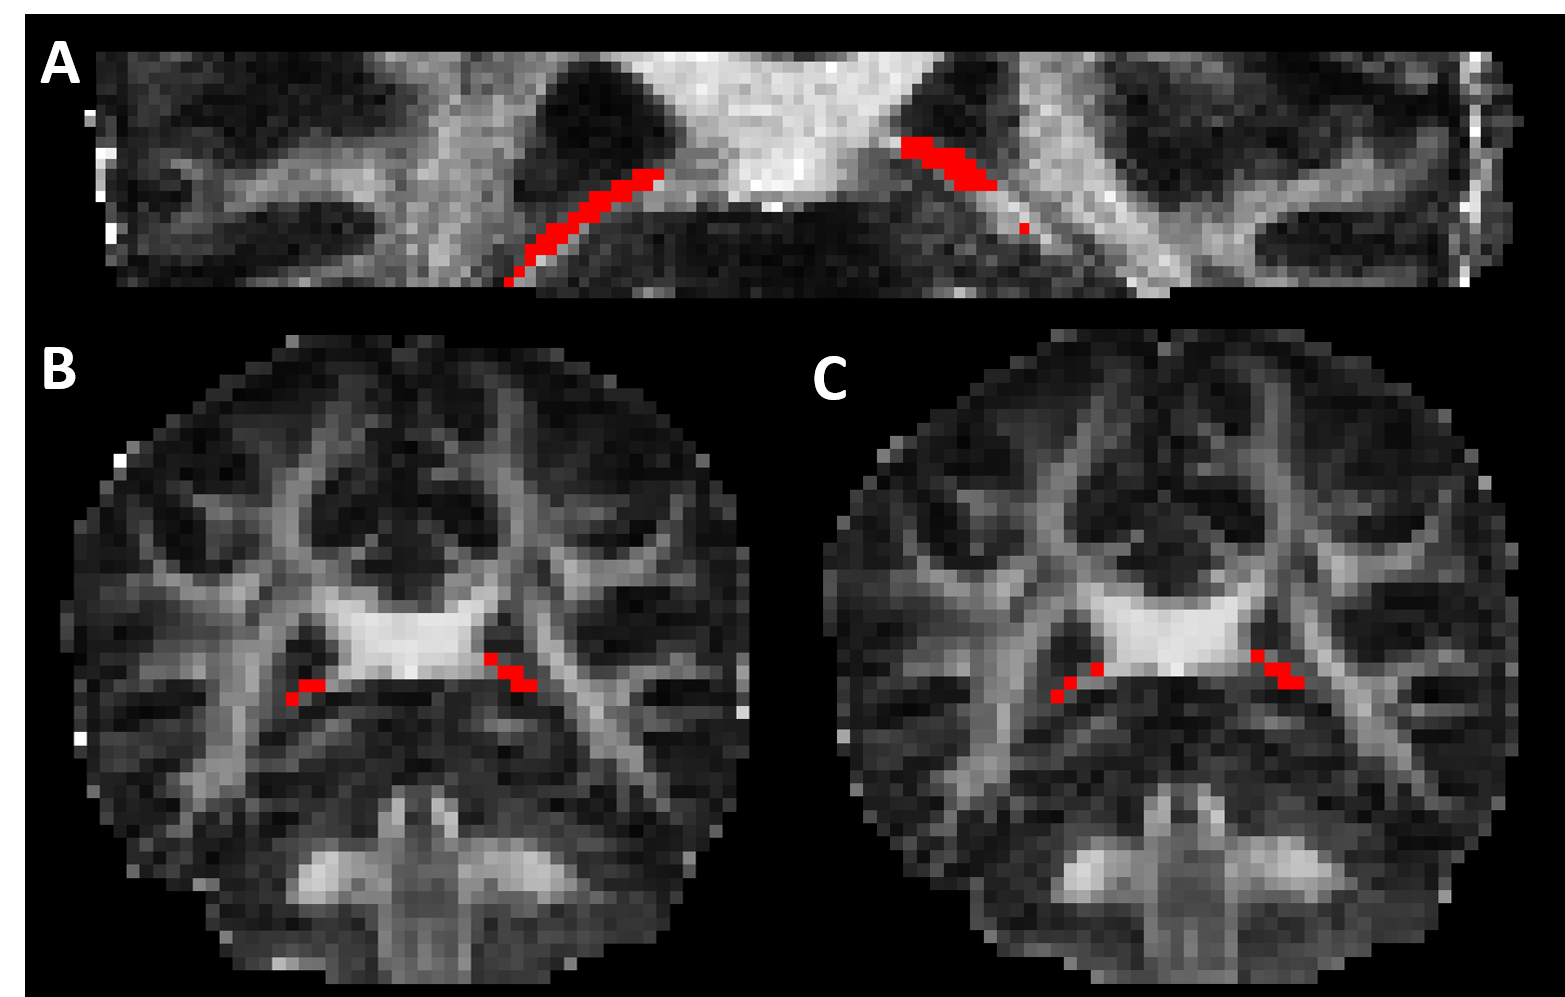
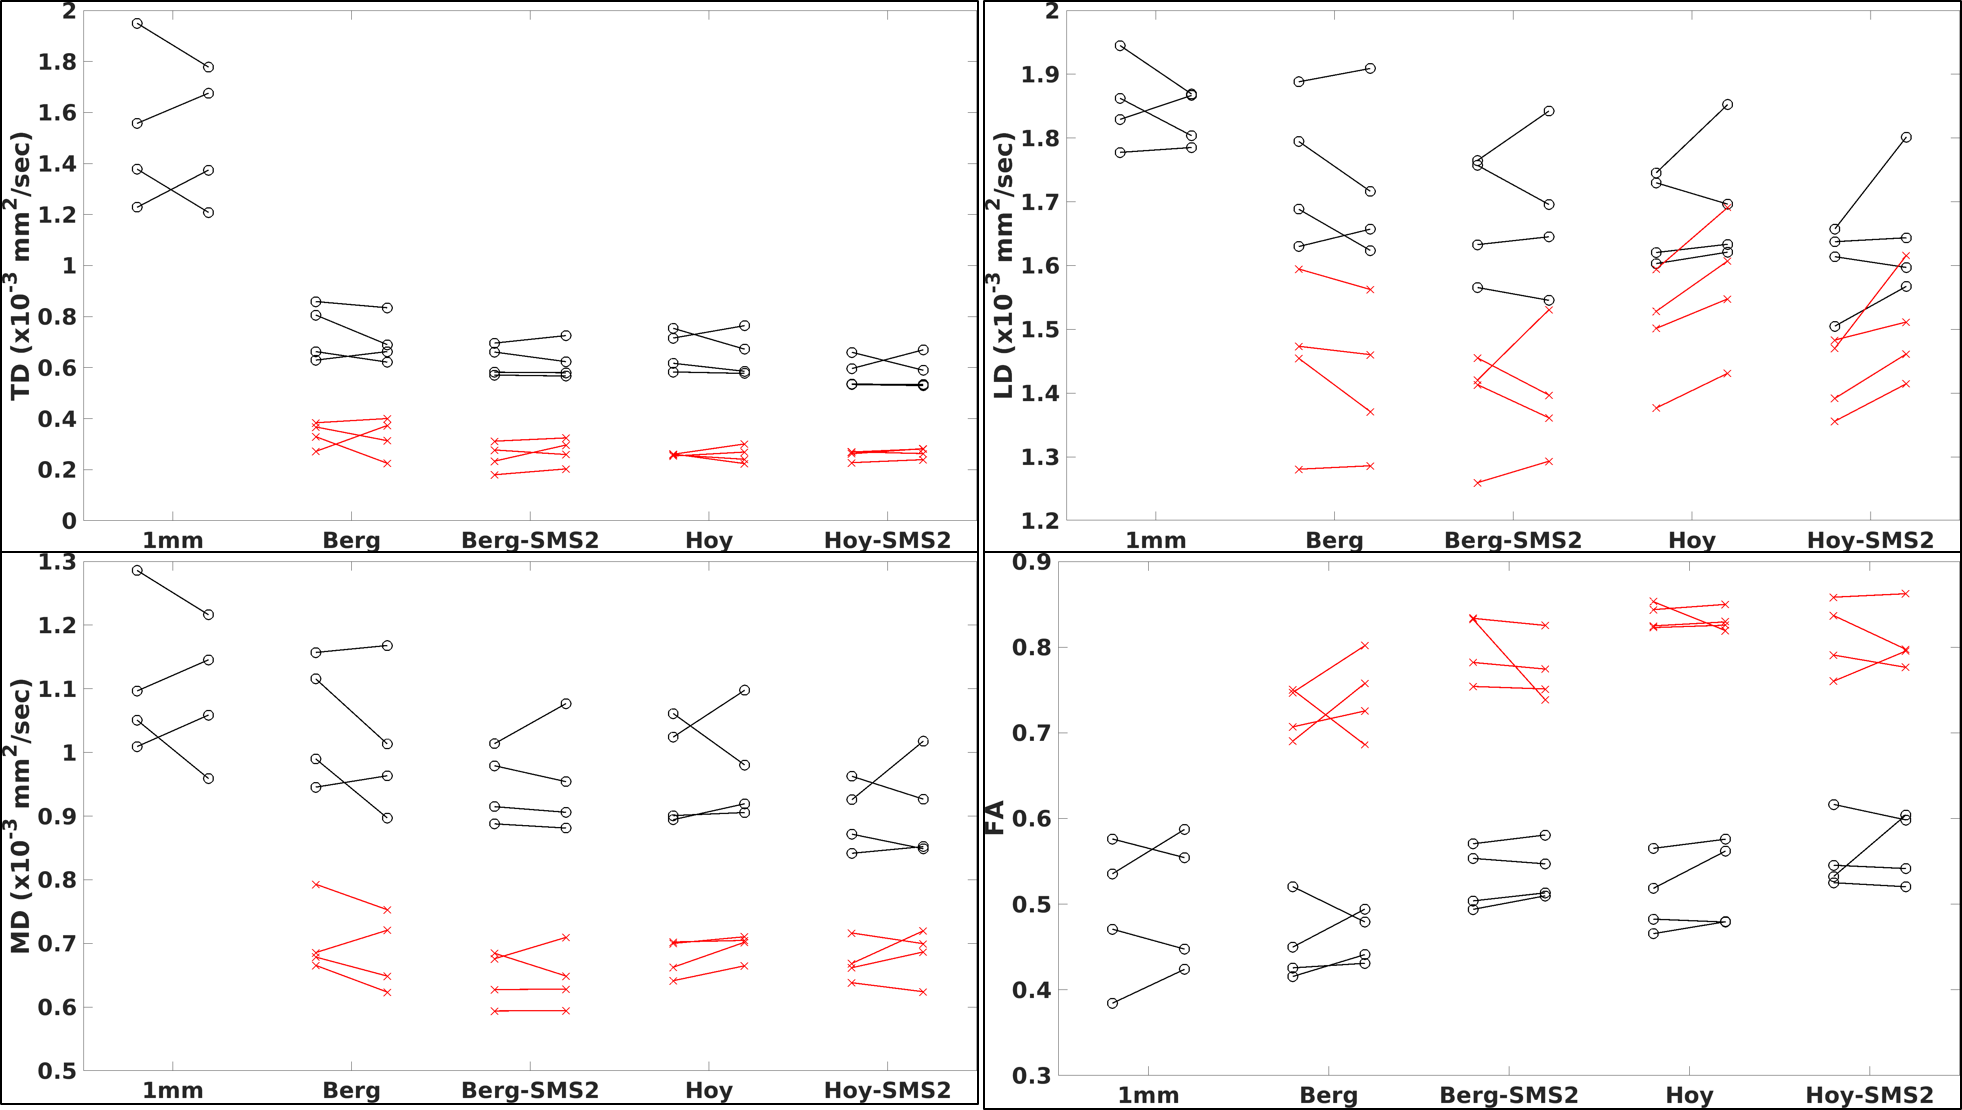
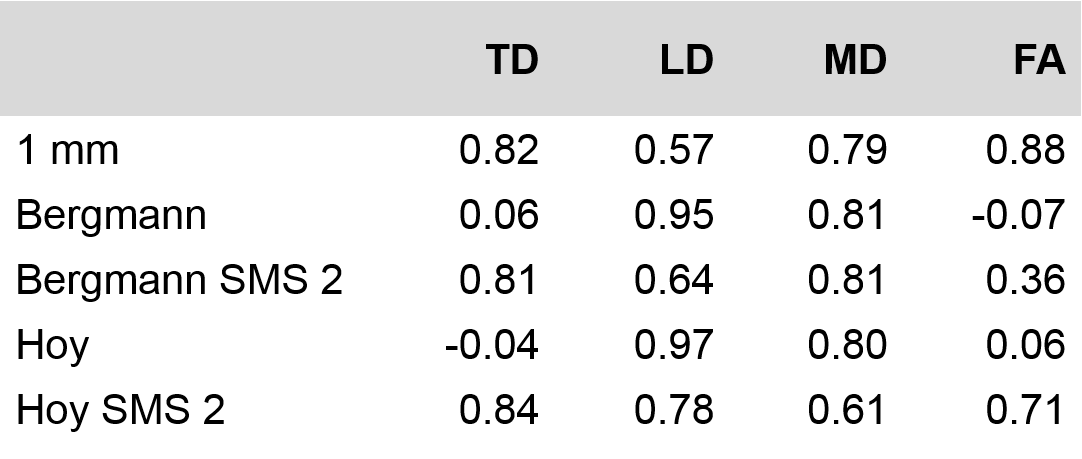
Figure 1 shows the fornix ROI overlaid on the FA map from each of the five scans. PVA is evident on the 2.5mm isotropic scans. Figure 2 summarizes DTI parameters for the values for each of the five scans. Transverse Diffusivity (TD), Longitudinal Diffusivity (LD), Mean Diffusivity (MD) and Fractional Anisotropy (FA) are shown for each scan. For each scan type, markers on the left are from the first scan and markers on the right are from the second scan. Values indicated with black markers were calculated with a weighted least-squares fit and have to correction for PVA. Values indicated with red markers were calculated with FWE algorithms. The FWE approaches reduce diffusivity values and increase FA substantially, resulting in values that are expected in highly organized white matter. Diffusivity values from the 1mm acqusition are high, suggesting that PVA with CSF persists. Table 2 summarizes values of Intraclass Correlation Coefficient (ICC), a measure of reproducibility. The acquisitions that use simultaneous multi-slice acquisition tend to have higher values of ICC.DISCUSSION
To our knowledge, direct comparison of FWE methods has been limited to the work of Bergmann et al.4. Unfortunately, the acquisition used in that comparison was not the optimal one proposed by Hoy et al.5. Here, we attempt to match the acquisitions to the algorithms proposed by the previous work. Both FWE approaches seem to do eliminate PVA effectively, as diffusivities match those of highly organized white matter after correction. The high diffusivity values from the 1mm acquisition may indicate that the spatial resolution is not sufficient to eliminate PVA. However, the low diffusion weighting of 500 sec/mm2 and low signal to noise ratio of the acquisition may also be contributing factors. From the standpoint of reproducibility, ICC > 0.7 are considered to be high14. The results here suggest that the 1mm and SMS-accelerated scans perform adequately for future research. The SMS-accelerated scans are also quite fast, which can prove advantageous when scanning patients. A limitation of this work is that it does not indicate the sensitivity of the scans to disease-related changes, which will be the focus of future work.CONCLUSION
FWE-corrected acquisitions, in conjunction with SMS acceleration promise to be a practical approach for assessing tissue microstructure in the fornix.Acknowledgements
We thank the Imaging Institute of the Cleveland Clinic and Siemens Healthineers for supporting this work.
References
1. Nowrangi, M. A. & Rosenberg, P. B. The fornix in mild cognitive impairment and Alzheimer's disease. Front Aging Neurosci 2015; 7:1.
2. Senova, S., Fomenko, A., Gondard, E. & Lozano, A. M. Anatomy and function of the fornix in the context of its potential as a therapeutic target. J Neurol Neurosurg Psychiatry 2020; 91:547-559.
3. Metzler-Baddeley, C., O'Sullivan, M. J., Bells, S., Pasternak, O. & Jones, D. K. How and how not to correct for CSF-contamination in diffusion MRI. Neuroimage 2012; 59:1394-1403.
4. Bergmann, O., Henriques, R., Westin, C. F. & Pasternak, O. Fast and accurate initialization of the free-water imaging model parameters from multi-shell diffusion MRI. NMR Biomed 2020; 33:e4219.
5. Hoy, A. R., Koay, C. G., Kecskemeti, S. R. & Alexander, A. L. Optimization of a free water elimination two-compartment model for diffusion tensor imaging. Neuroimage 2014; 103:323-333.
6. Smith, S. M., Jenkinson, M., Woolrich, M. W., Beckmann, C. F., Behrens, T. E., Johansen-Berg, H., Bannister, P. R., De Luca, M., Drobnjak, I., Flitney, D. E., Niazy, R. K., Saunders, J., Vickers, J., Zhang, Y., De Stefano, N., Brady, J. M. & Matthews, P. M. Advances in functional and structural MR image analysis and implementation as FSL. Neuroimage 2004; 23 Suppl 1:S208-219.
7. Ades-Aron, B., Veraart, J., Kochunov, P., McGuire, S., Sherman, P., Kellner, E., Novikov, D. S. & Fieremans, E. Evaluation of the accuracy and precision of the diffusion parameter EStImation with Gibbs and NoisE removal pipeline. Neuroimage 2018; 183:532-543.
8. Treit, S., Steve, T., Gross, D. W. & Beaulieu, C. High resolution in-vivo diffusion imaging of the human hippocampus. Neuroimage 2018; 182:479-487.
9. MATLAB. version 9.9.0.1570001 (R2020b) Update 4. (The MathWorks Inc., 2020).
10. Henriques, R. N., Rokem, A., Garyfallidis, E., St-Jean, S., Peterson, E. T. & Correia, M. M. [Re] Optimization of a free water elimination two-compartment model for diffusion tensor imaging. ReScience 2017; 3:2.
11. Garyfallidis, E., Brett, M., Amirbekian, B., Rokem, A., van der Walt, S., Descoteaux, M., Nimmo-Smith, I. & Dipy, C. Dipy, a library for the analysis of diffusion MRI data. Front Neuroinform 2014; 8:8.
12. Greve, D. N., Billot, B., Cordero, D., Hoopes, A., Hoffmann, M., Dalca, A. V., Fischl, B., Iglesias, J. E. & Augustinack, J. C. A deep learning toolbox for automatic segmentation of subcortical limbic structures from MRI images. Neuroimage 2021; 244:118610.
13. Cox, R. W. AFNI: software for analysis and visualization of functional magnetic resonance neuroimages. Comput Biomed Res 1996; 29:162-173.
14. Marenco, S., Rawlings, R., Rohde, G. K., Barnett, A. S., Honea, R. A., Pierpaoli, C. & Weinberger, D. R. Regional distribution of measurement error in diffusion tensor imaging. Psychiatry Res 2006; 147:69-78.
Figures