3132
Improving Low Resolution MRI Contrast for Brain-Environment Neuroepidemiology
Jasmine D Cakmak1, Reza Azarpazhooh2, Alexander Khaw2, and Udunna Anazodo1,2
1McGill University, Montreal, QC, Canada, 2Western University, London, ON, Canada
1McGill University, Montreal, QC, Canada, 2Western University, London, ON, Canada
Synopsis
Keywords: Data Processing, Segmentation, Synthetic MRI
Recycling large-scale clinical data to retrospectively study associations of brain imaging variables with emerging environmental risk factors is a sustainable approach in the growing field of neuroepidemiology. Here, we evaluated the utility of a deep learning tool to increase the resolution of clinical (1.5T) T1-weighted MRI by comparing global assessment of gray matter volume (GMV) and cortical thickness (CT) to 3T research scans. Overall, the resolved 1.5T images had higher (18%) GMV and CT compared to 3T and were more biased than unresolved images. Further analysis in larger cohorts using improved segmentation approaches could validate recycling of enhanced clinical scans.INTRODUCTION
The intractable nature of neurodegenerative diseases underscores the importance of identifying modifiable risk factors. Along with the complex pathophysiology of these brain disorders, new insights into etiology and determinants may help prevent neurodegeneration or better manage its outcomes - including behaviour and cognitive outcomes. One potential risk factor, air pollution has been linked to 4.72% of deaths from Parkinson’s disease, stroke, and multiple sclerosis, and an increase in dementia cases1,2. A 40% drop in average levels of toxic fine particulate matter at 2.5µm (PM2.5) in some regions of the US led to 182,000 fewer dementia cases over a 10-year period, while an increase of 10% in other regions over the same period increased risks of dementia diagnosis by 8%3. Unfortunately, this disparate impact of air pollution on specific communities (urban/industrial vs suburbs or rural) disproportionately exposes some populations to increased dementia risks with intersecting socioeconomic (SES) risk factors4, meaning low SES communities typically found in urban cities have higher dementia risk.The big question is how to sustainably use large population data to explore the influence of our dynamic and deeply connected environments (physical, socioeconomic, cultural) on brain health, towards prevention of neurodegeneration. We propose an approach to connect publicly available environmental data to local brain imaging and clinical data acquired in 3000 individuals over a 15-year period to explore important local environmental influencers on brain outcomes (Figure 1). Because atrophy of gray matter volume (GMV) and cortical thickness (CT) are key neurodegeneration biomarkers, known to deteriorate 2-3 decades before abnormal behaviours and cognitive impairments manifest5,6, we will explore associations of environmental risk factors on GMV and CT.
Here, we present preliminary work to validate the use of deep learning-based MRI contrast enhancement tools in improving apparent tissue contrast of low-resolution clinical MRI scans for robust tissue segmentation and quantification of GMV and CT.
METHODS
Our approach will reuse clinical-grade MRI (≤1.5T) acquired across Southwestern Ontario health centres over the past 15+ years (Figure 1). Given the general thicker slices of clinical MRI, these images have lower image quality and missing data (Figure 1) compared to research quality high resolution images acquired on higher field (≥3T) strength.To validate the use of promising image contrast enhancement tools, we compared GMV and CT measured from 1.5T clinical MRI scans with and without contrast enhancement to 3T research scans in 12 stroke patients (8 Males; 74 ± 4.99 years old). Each patient was imaged thrice: once at 1.5T immediately after stroke as standard of care, and twice at 3T, 4-week and 6-month post-stroke using a research protocol. The 1.5T T1-weighted MPRAGE images, (resolution: 0.859x0.859x6mm) were processed using SynthSR7, a deep learning super resolution tool to increase the contrast- and signal-to-noise ratio (CNR, SNR) and obtain 1mm isotropic images, matching the 3T resolution. The robustness of SynthSR was recently demonstrated in synthesizing 1mm isotropic images from 0.064T MRI8. All images, including the native and resolved 1.5Ts, were processed using the CAT12 segmentation toolbox (https://neuro-jena.github.io/cat/) to perform voxel/vertex wise GMV and CT analysis (Figure 1). Global mean GMV and total CT of the whole brain were compared to 3T at 4-weeks (baseline), to 1) confirm reproducibility of brain outcome when measured over time (3T follow up – 3T baseline), and 2) to validate the SynthSR-resolved imaging outcomes measured retrospectively with clinical scans (1.5T native or resolved – 3T baseline). All analyses were adjusted for age, sex, and total intracranial volume.
RESULTS
GM tissue segments from 3T and 1.5T native and resolved images are shown in Figures 2 and 3. Compared to 3T baseline, 3T follow-up images showed no differences in GMV or CT (GM p=0.448; CT p=0.666) (Figure 4) with relative differences of -0.49% and -0.189%, respectively (Table 1). The GMV of the 1.5T images was not statistically different (p=0.102; relative difference= -12.5%), but the difference in CT was significant with outlier rejection (p=0.005; relative difference=14.26%). The differences in GMV and CT between 3T baseline and super-resolved 1.5T images processed with SynthSR were the highest (GMV =18.17%, CT = 18.55%) and statistically significant (GM p=8.545e-06, CT=3.301e-05) (Table 1).DISCUSSION
Overall, the minimal and non-significant differences between 3T images confirmed the reproducibility of the 3T image as a reference. On the whole, native 1.5T images were both under- and over-representative of the 3T reference variables, while the resolved 1.5T images processed with SynthSR significantly overestimated both variables. Although this work used a relatively small cohort and focused on global brain changes, recent analysis in 11 stroke patients quantifying regional volumetric changes in SynthSR-resolved very-low field MRI showed promising correlations to high field (1.5 -3T) MRI8. As a next step, we will investigate local GMV and CT in a larger cohort of patients (N= 34) exploring other established volumetric processing tools (i.e., MALP-EM9 and VolBrain10) to confirm the utility of image enhancement tools for enabling large scale neuroepidemiology.CONCLUSION
To facilitate the reuse of clinical MRI data and reduce the burden of large-scale MRI research, particularly in resource-limited settings, the approach and investigation introduced here may facilitate population neuroimaging applications on an epidemiological scale.Acknowledgements
This work was supported by funding from the Heart and Stroke Foundation of Canada Grants-in-Aid Award (UCA) and Lawson Health Research Institute Internal Research Fund (UCA). The authors thank Professor Wolf-Dieter Heiss for supporting data collection through funding awarded to him through the Rolf M. SchwieteStiftung funding at Max Planck Institute for Metabolism Research, Cologne, Germany.References
1.Chen, H. et al. Exposure to ambient air pollution and the incidence of dementia: A population-based cohort study. Environ. Int. 108, 271–277 (2017).2.Zhao, N. et al. Long-term ozone exposure and mortality from neurological diseases in Canada. Environ. Int. 157, 106817 (2021).
3.Bishop, K., Ketcham, J. & Kuminoff, N. Hazed and Confused: The Effect of Air Pollution on Dementia. NBER Work. Pap. 24970 (2018).
4.Santos, N. V. dos, Yariwake, V. Y., Marques, K. do V., Veras, M. M. & Fajersztajn, L. Air Pollution: A Neglected Risk Factor for Dementia in Latin America and the Caribbean. Front. Neurol. 12, 1198 (2021).
5.Iturria-Medina, Y. et al. Early role of vascular dysregulation on late-onset Alzheimer’s disease based on multifactorial data-driven analysis. Nat. Commun. 7, (2016).
6.Fjell, A. M. & Walhovd, K. B. Structural brain changes in aging: Courses, causes and cognitive consequences. Reviews in the Neurosciences vol. 21 (2010).
7.Iglesias, J. E. et al. Joint super-resolution and synthesis of 1 mm isotropic MP-RAGE volumes from clinical MRI exams with scans of different orientation, resolution and contrast. Neuroimage 237, 118206 (2021).
8.Iglesias, J. E. et al. Quantitative Brain Morphometry of Portable Low-Field-Strength MRI Using Super-Resolution Machine Learning. Radiology (2022) doi:10.1148/radiol.220522.
9.Ledig, C. et al. Robust whole-brain segmentation: Application to traumatic brain injury. Med. Image Anal. 21, 40–58 (2015).
10.Manjón, J. V. & Coupé, P. volBrain: An Online MRI Brain Volumetry System. Front. Neuroinform. 10, (2016).
Figures
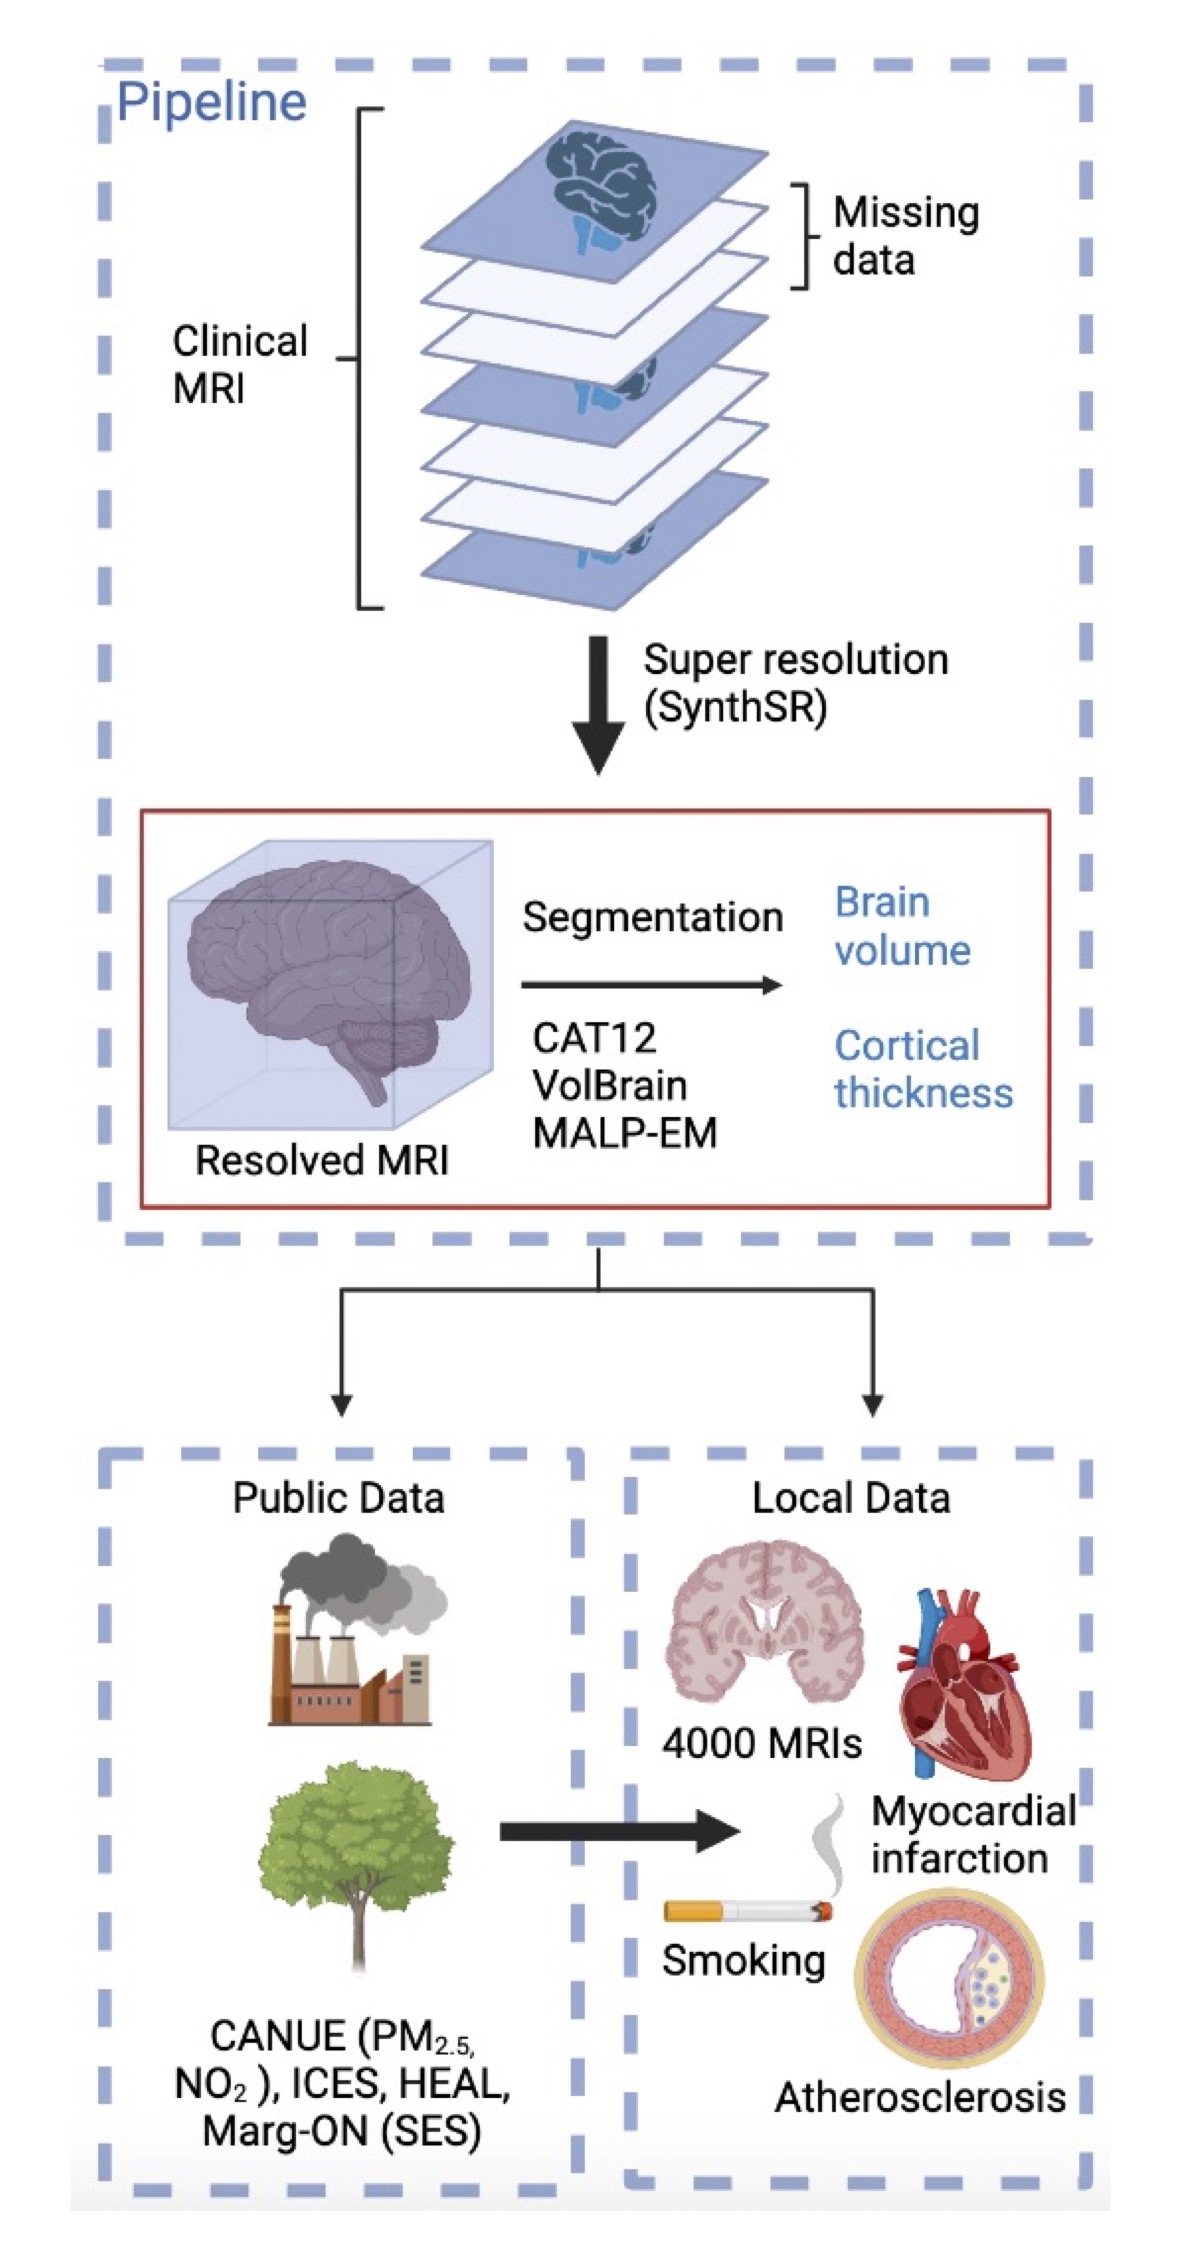
Figure 1. Proposed approach to reduce, reuse, & recycle clinical brain MRI for neuroepidemiology.
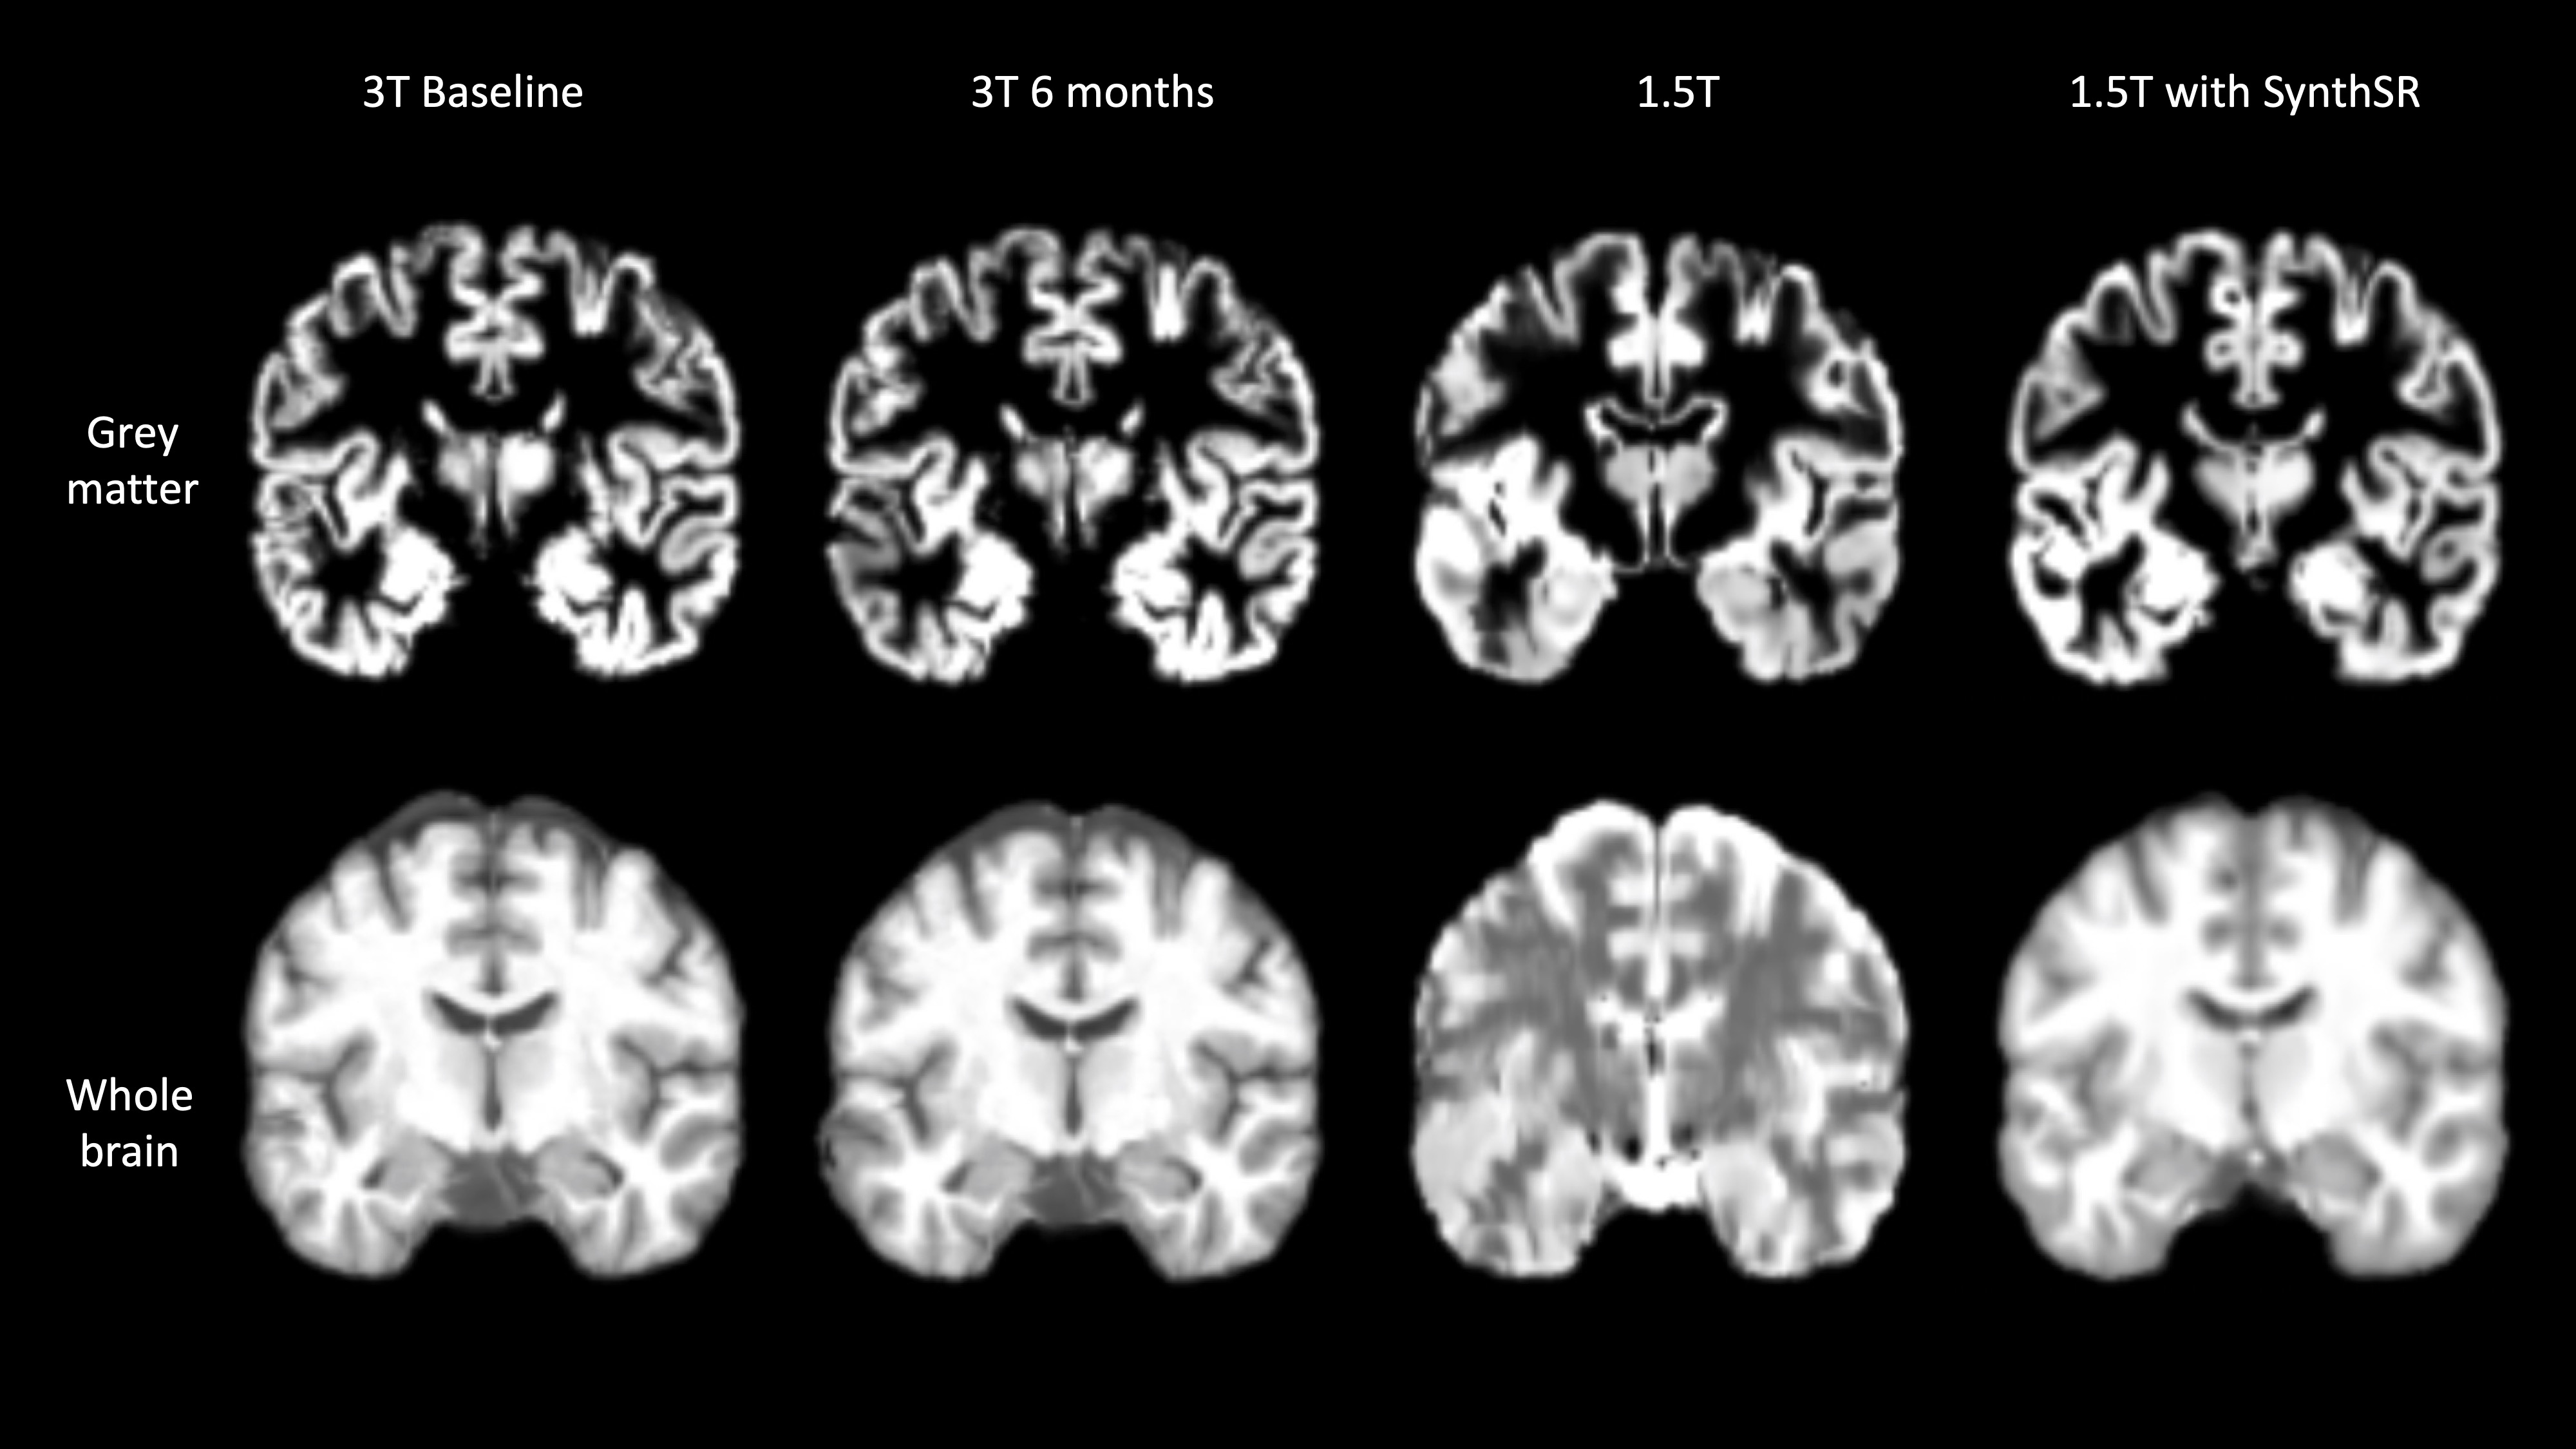
Figure 2. Comparison of grey matter segments and whole brain anatomical images between field strength and resolutions in a single individual.
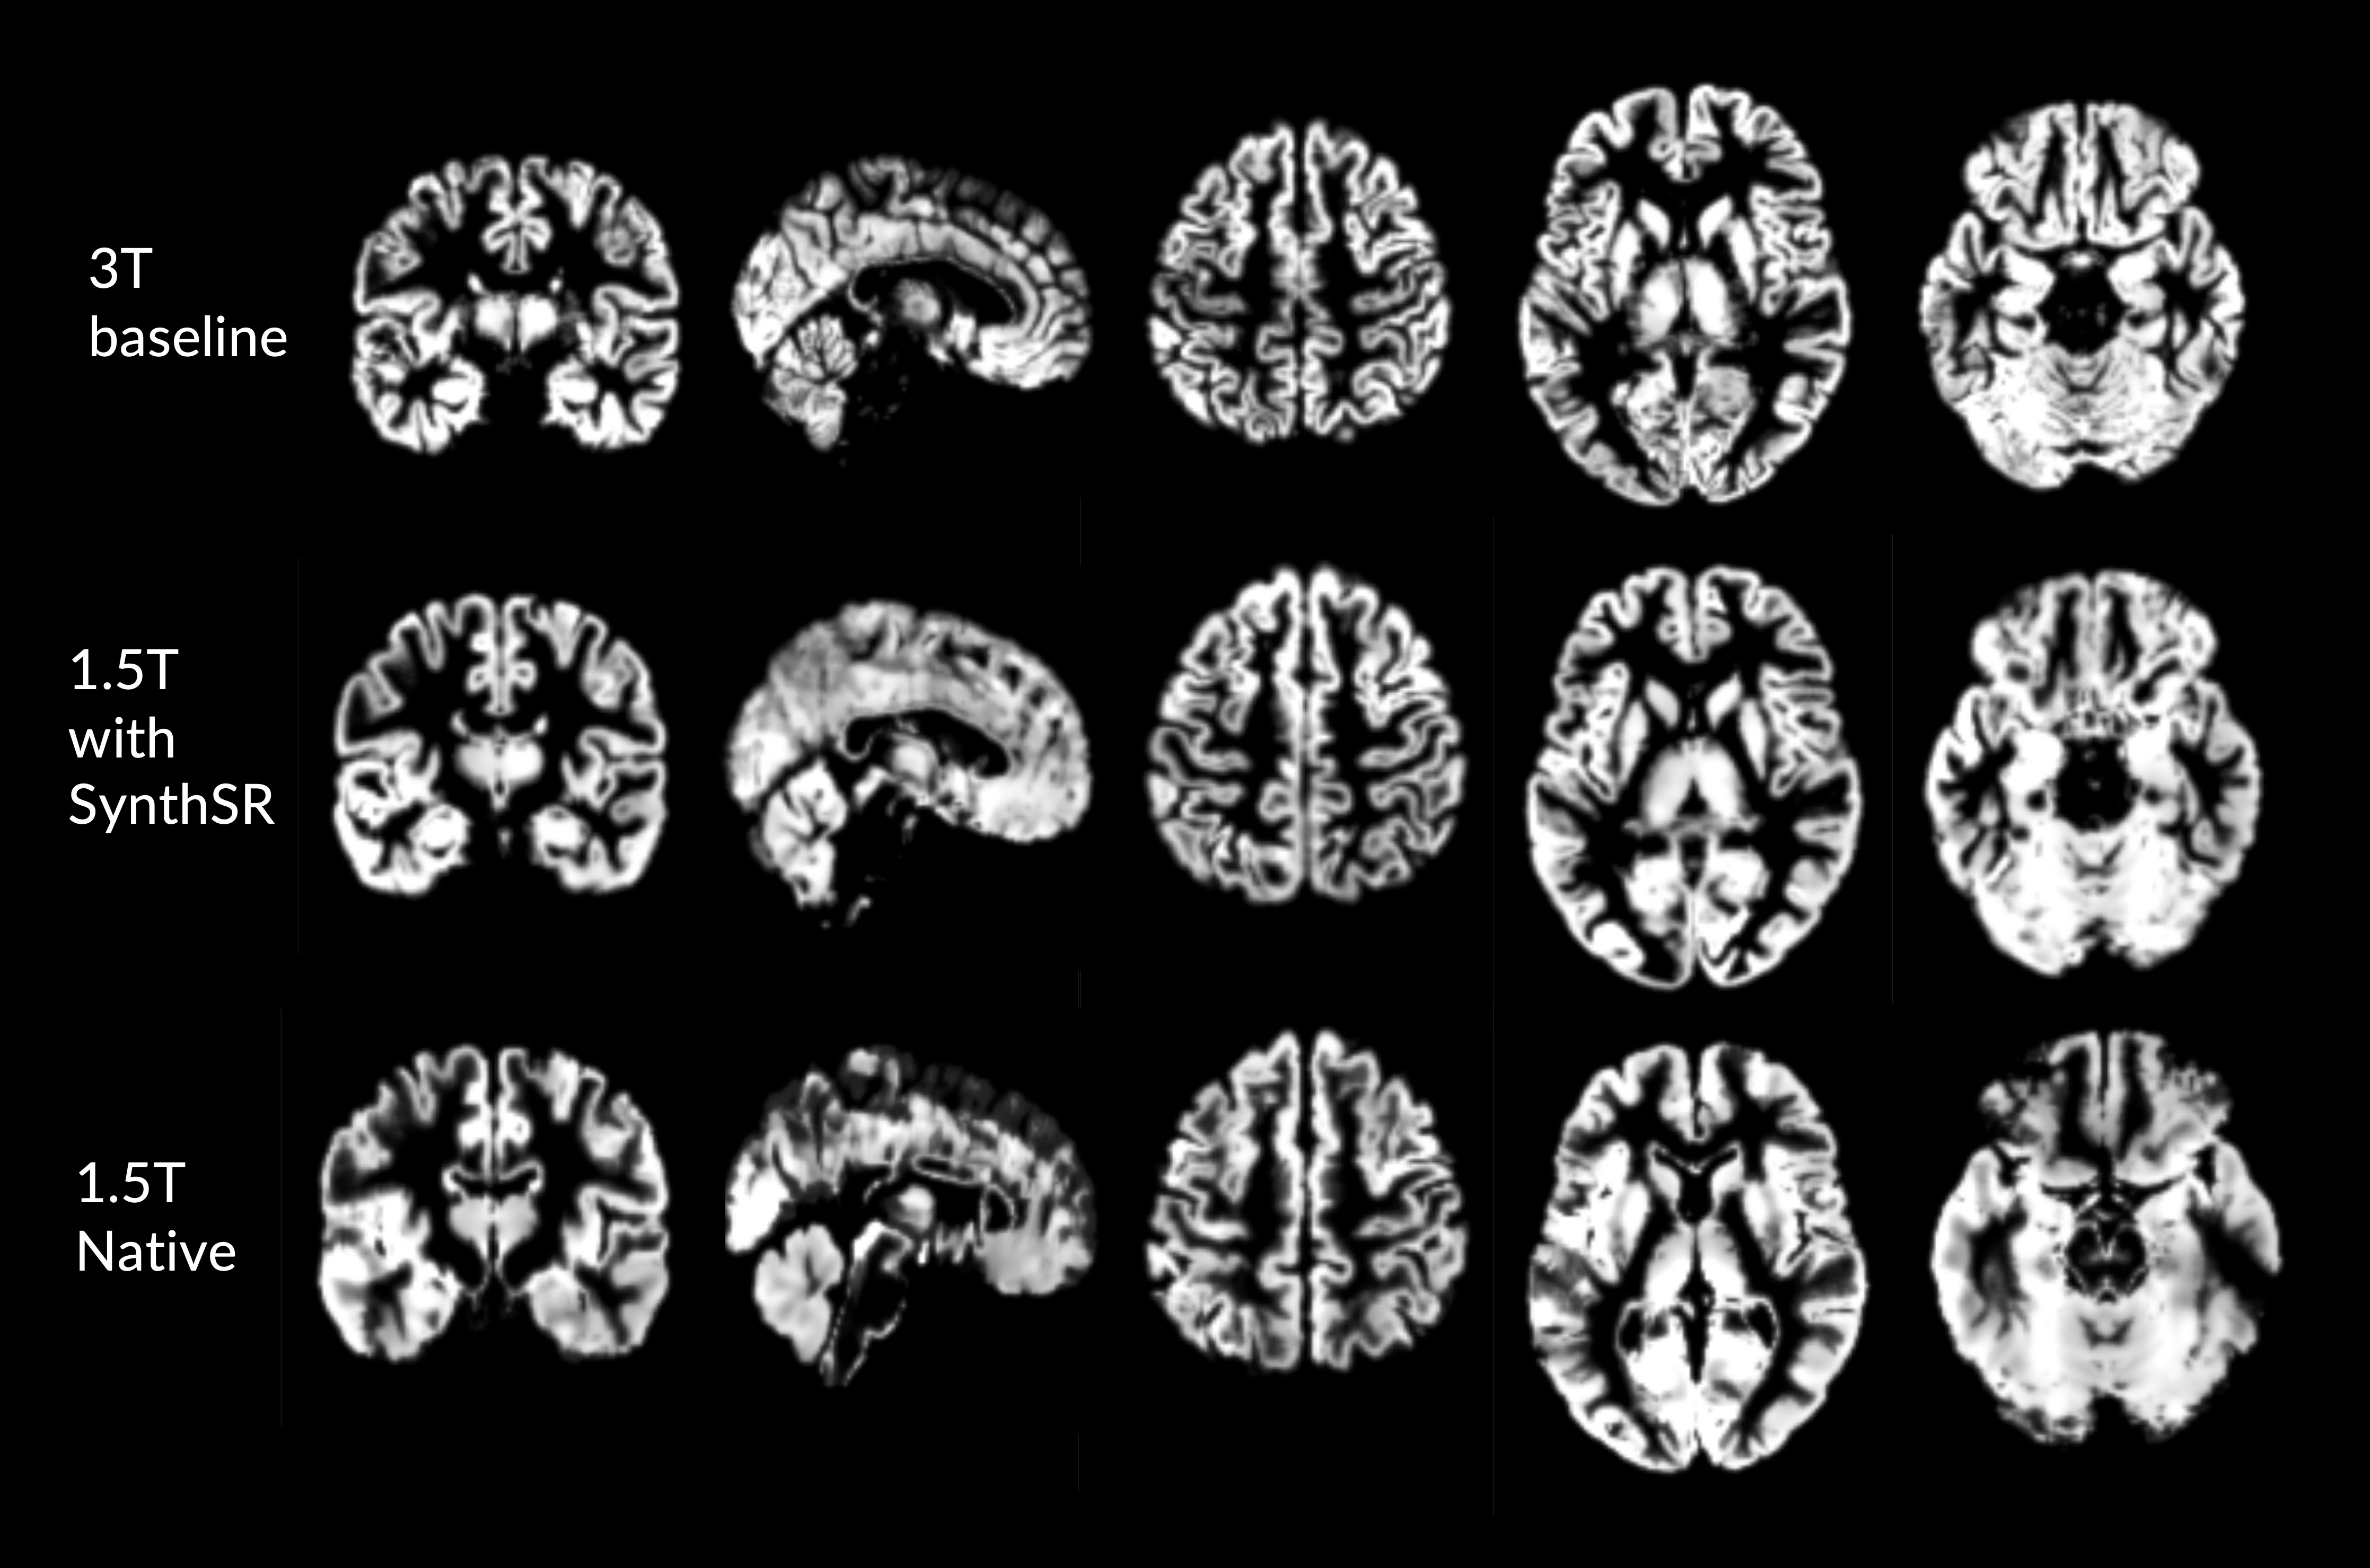
Figure 3. Comparison of grey matter segmentations by MRI field strength in one participant scanned.
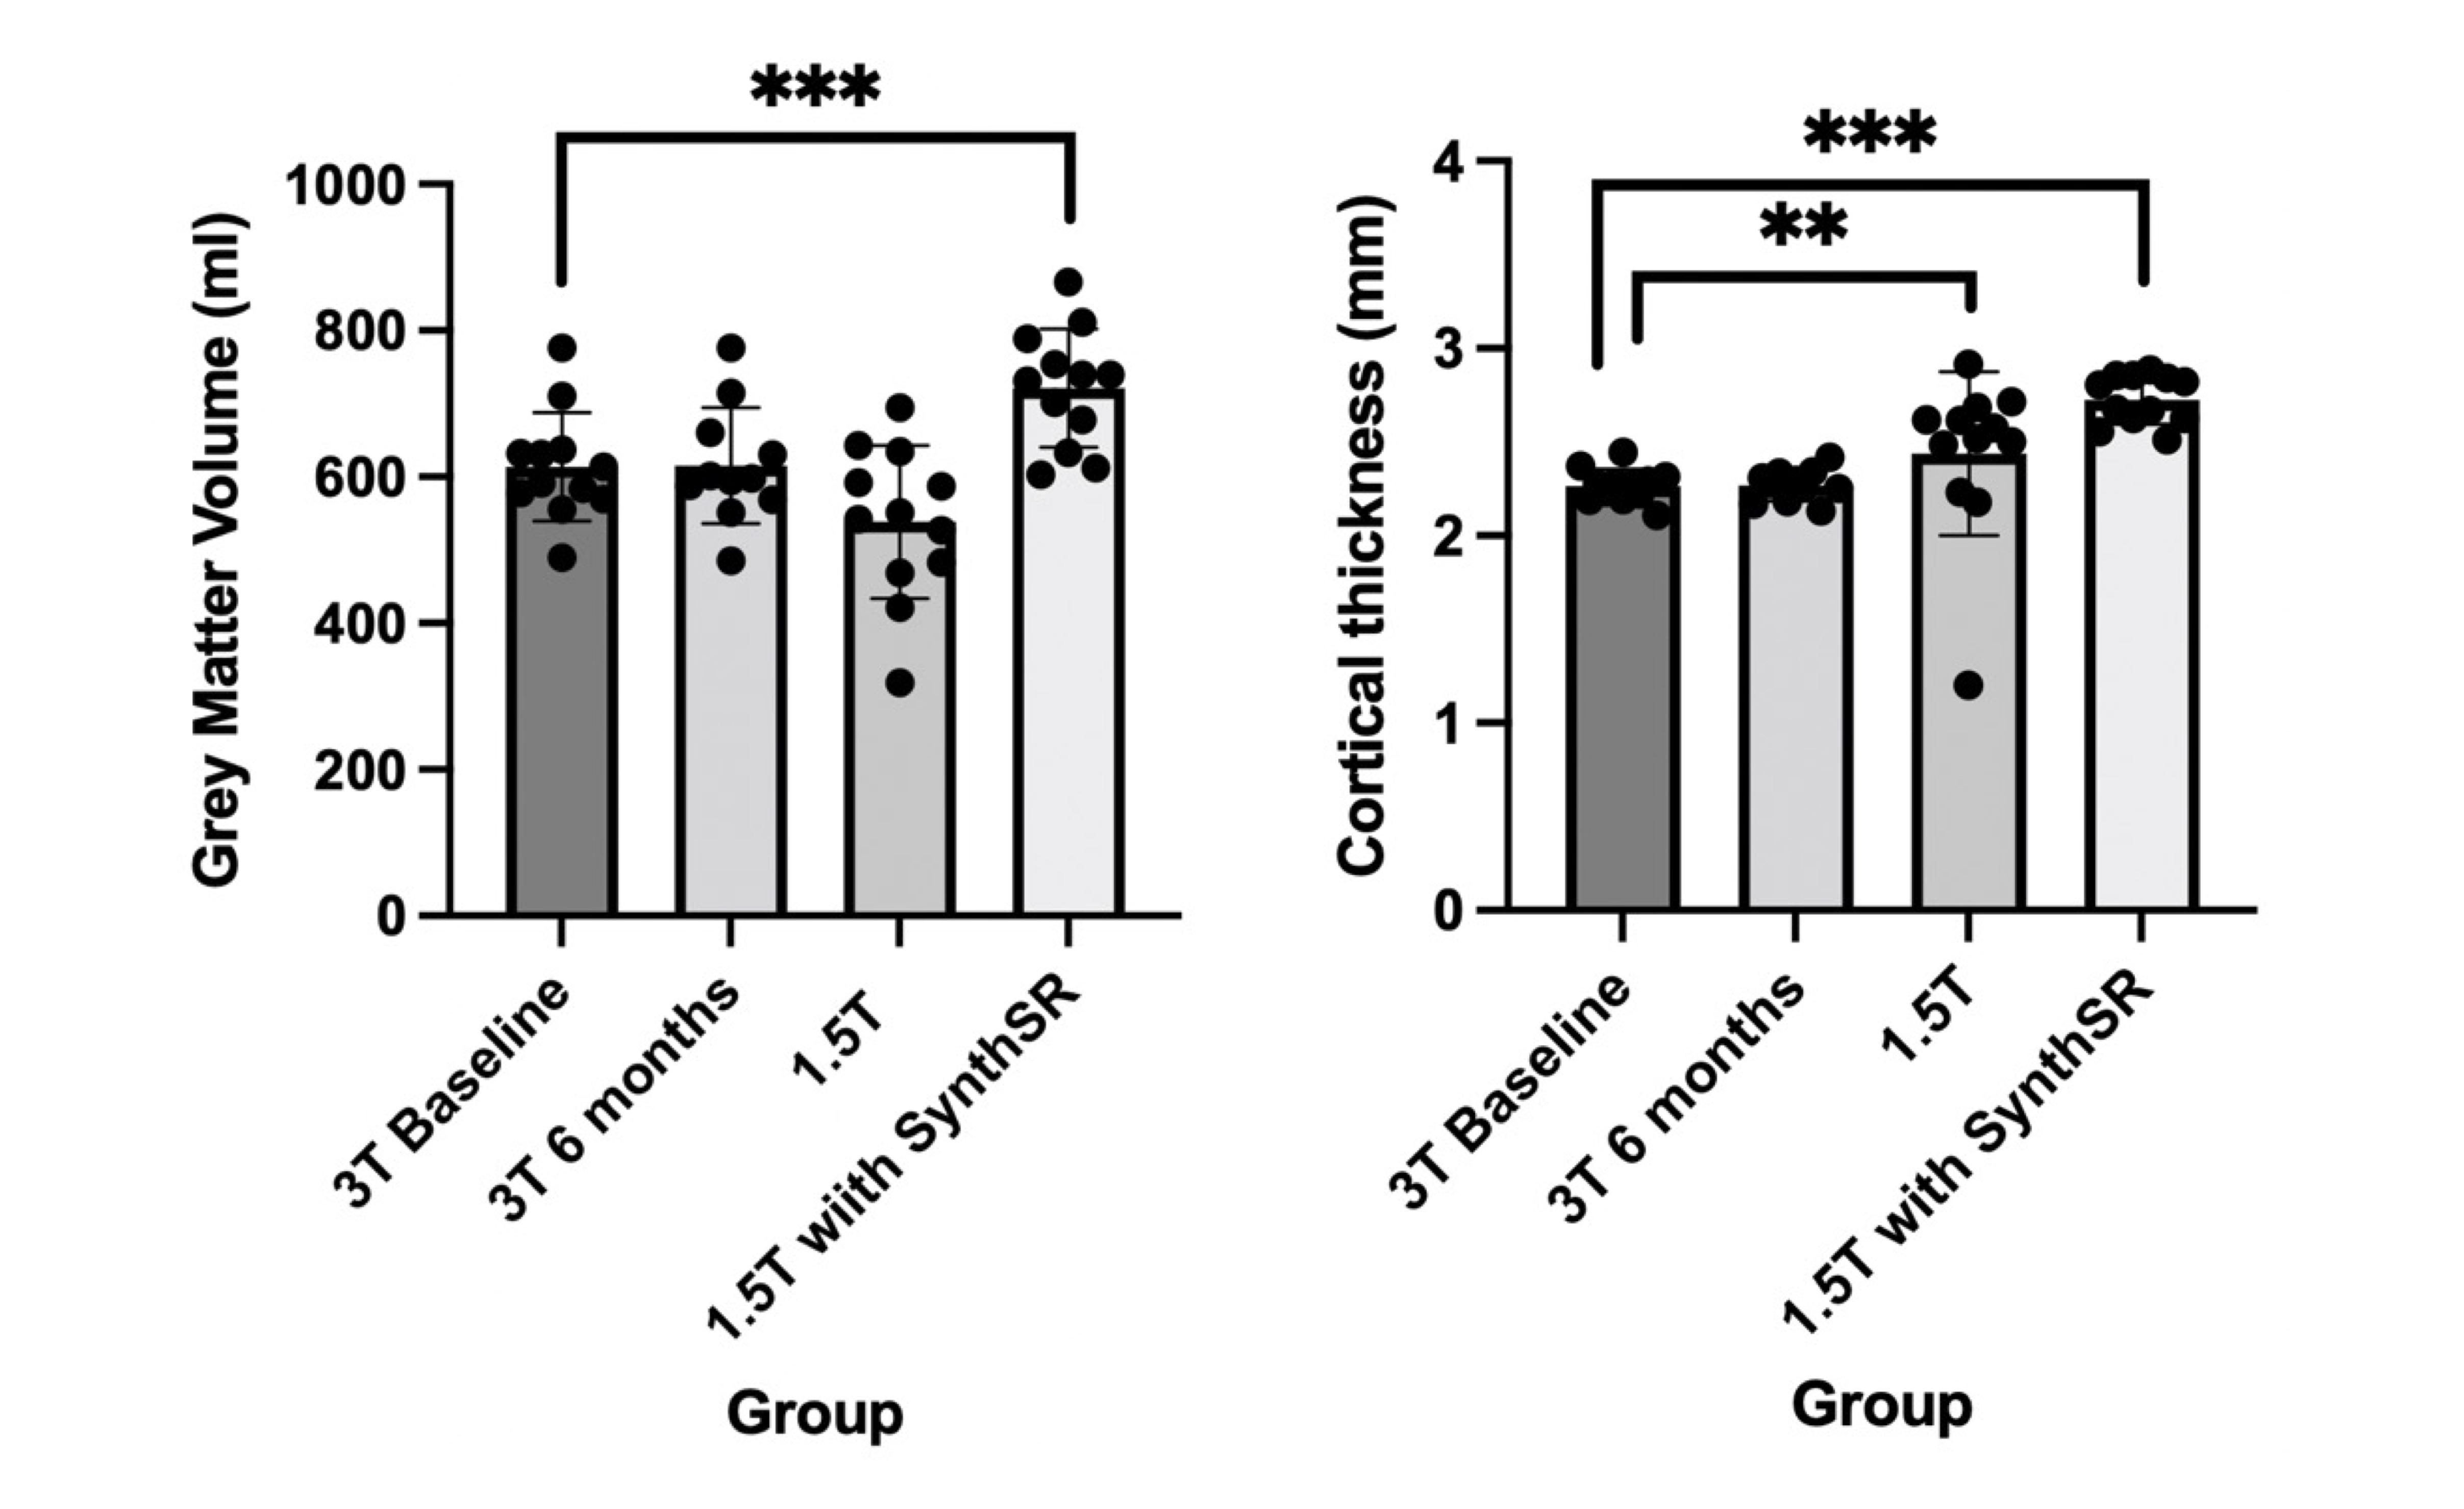
Figure 4. Global mean grey matter volume (left) and cortical thickness (right) between field strengths and resolution (N=12). ** = p<0.01, *** = p<0.001.
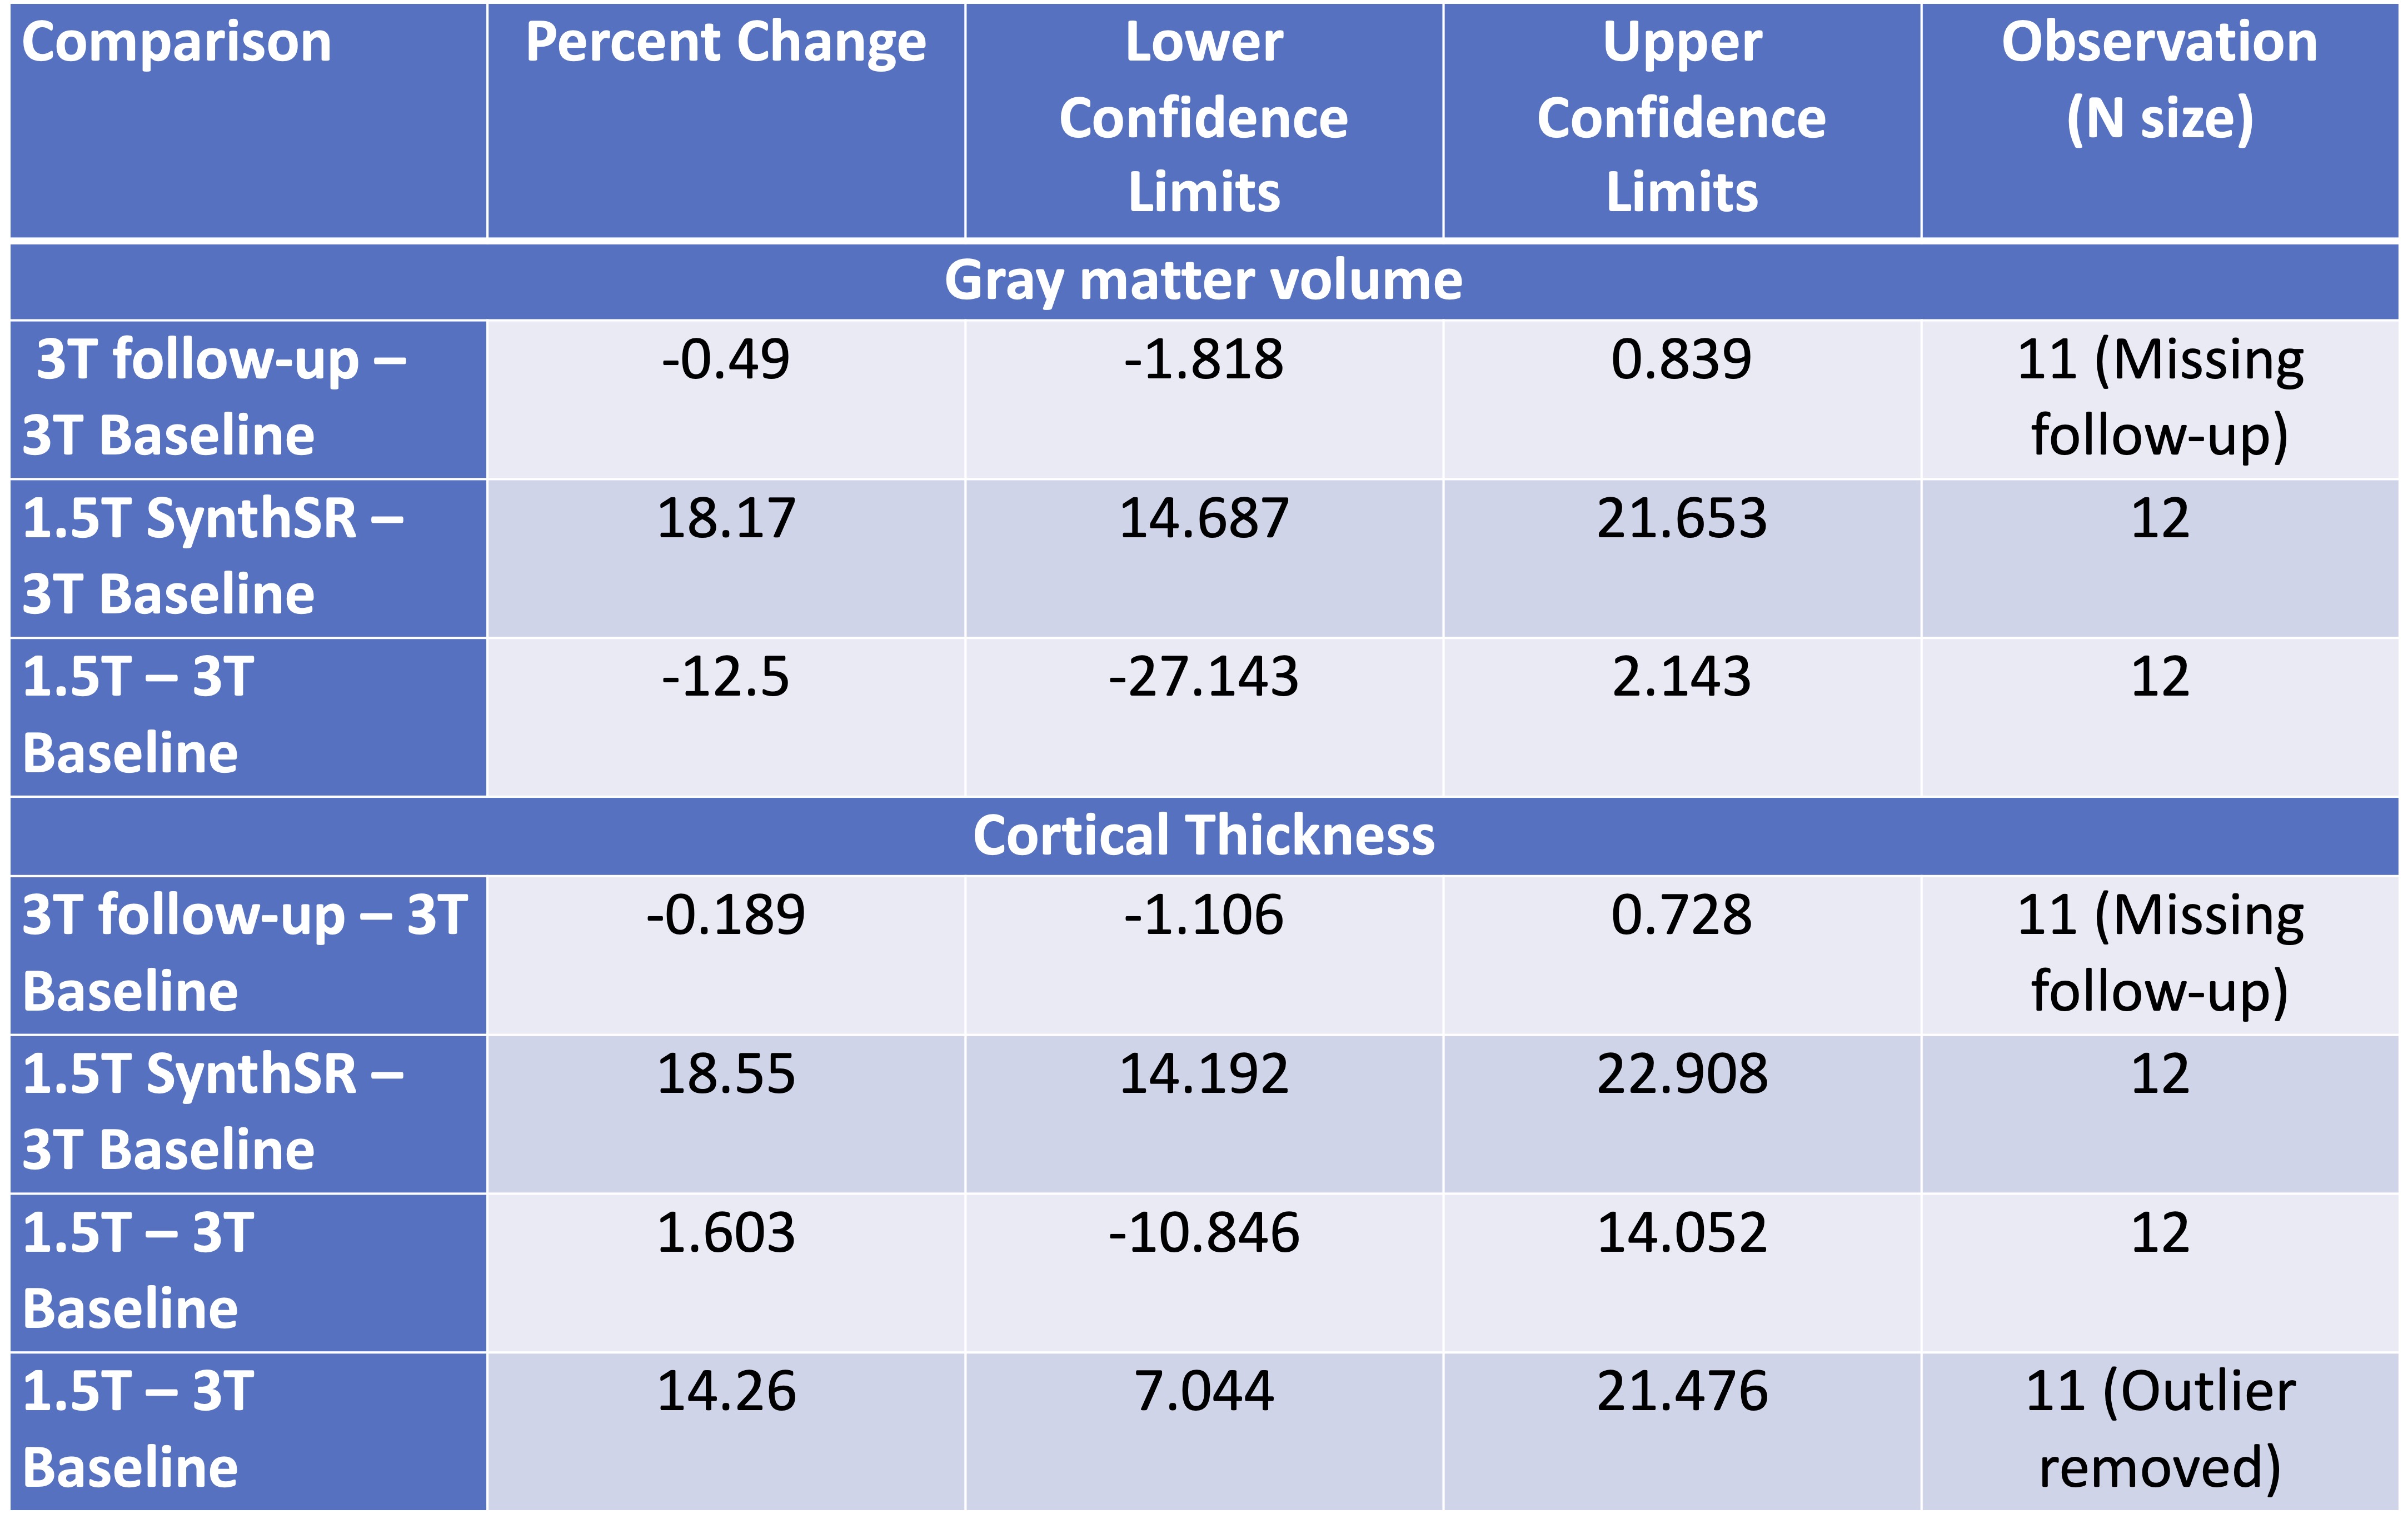
Table 1. Percent change for grey matter volume and mean cortical thickness.
DOI: https://doi.org/10.58530/2023/3132