3131
Diaphragm Excursion Measured by Free-breathing 1H MRI in Patients with Asthma: Repeatability and Bronchodilator Response1Imaging Research Centre, St. Joseph's Healthcare Hamilton, Hamilton, ON, Canada, 2Firestone Institute of Respiratory Health, St. Joseph's Healthcare Hamilton, Hamilton, ON, Canada, 3Deparment of Radiation Oncology, University of California San Francisco, San Francisco, CA, United States, 4Division of Respirology, McMaster University, Hamilton, ON, Canada
Synopsis
Keywords: Data Analysis, Lung
Using free-breathing 1H MRI, diaphragm excursion was measured in 9 patients with severe asthma at two visits 4-months apart. At each visit, patients with asthma were imaged before and after administration of a bronchodilator. Diaphragm excursion measured at the two visits were not significantly different from one another (mean bias=0.34cm, p=0.07) and were well correlated (r=0.53, p=0.004), demonstrating repeatability of the measurement. In addition, diaphragm excursion was significantly increased following bronchodilator administration (p=0.01).Introduction
Asthma is a chronic airways disease characterized by smooth muscle dysfunction and/or inflammation that contribute to airflow limitation and gas trapping. The diaphragm is the primary muscle of respiration. It increases the thoracic volume during inspiration, drawing in air to the lungs. Disease associated with airflow limitation and gas trapping can lead to overwork of the respiratory muscles and decrease the range of motion of the diaphragm, which may contribute to dyspnea1,2. In addition to the commonly used clinical imaging modalities, such as chest radiographs and fluoroscopy, diaphragm shape and movement can be imaged using static or time-resolved CT or MRI3. In this pilot study, we evaluate the repeatability of diaphragm excursion measurements in patients with severe asthma using free-breathing 1H MRI. In addition, we measure the effect of bronchodilator administration on diaphragm excursion.Methods
Study Design and ParticipantsNine patients with severe asthma performed free-breathing 1H MRI before and after administration of a bronchodilator at two visits completed 4 months apart. All patients with asthma were managed by a respiratory physician, had severe disease according to Global Initiative for Asthma guidelines, were >18 years of age, and were never or former smokers with less than a 10 pack-year smoking history. Patients withheld short-acting β-agonists for ≥6 hours, long-acting β-agonists for ≥48 hours and long-acting muscarinic antagonists for ≥72 hours prior to each study visit.
MRI Acquisition and Analysis
All MR examinations were performed in the coronal plane using a whole body 3.0 Tesla Discovery MR750 system (GE Healthcare, Milwaukee, Wisconsin, USA). Each participant underwent free-breathing 1H MRI with respiratory bellows to monitor respiratory rate and an optimized balanced-steady-state-free-precession (bSSFP) sequence (acquisition time=160-200s; echo-time/repetition-time/flip angle=0.6ms/1.9ms/15°; field-of-view=40×40cm2; bandwidth=250kHz; matrix=256×256; number-of-slices=13-15). Free-breathing 1H MRI was analyzed and sorted to 10 breath-cycle phases as previously described4,5, using MATLAB R2019a (Mathworks, Natick, Massachusetts, USA). Measurement of diaphragm excursion was performed on the centre slice (±1) of each acquisition, as identified by the location of the carina. For each phase in the breathing cycle, the top of the left and right diaphragms were independently identified using the Canny edge detection technique6. The diaphragm position was measured as the highest point in the caudal-cranial direction. Diaphragm excursion was then calculated as the maximum change in the diaphragm position during the breathing cycle. To measure the effect of bronchodilator inhalation, the excursions of the left and right diaphragms were averaged together. Statistical analysis was performed using GraphPad Prism 9.4.1 (GraphPad Software, La Jolla, CA). To measure repeatability, a Pearson correlation of the diaphragm excursion pre- and post-bronchodilator administration of each lung at visit 2 as a function of visit 1 was measured and a Bland-Altman analysis was performed. A paired t-test was used to measure the effect of bronchodilator on diaphragm excursion. Three acquisitions were excluded due to motion blurring and one patient was not scanned post-bronchodilator administration.
Results
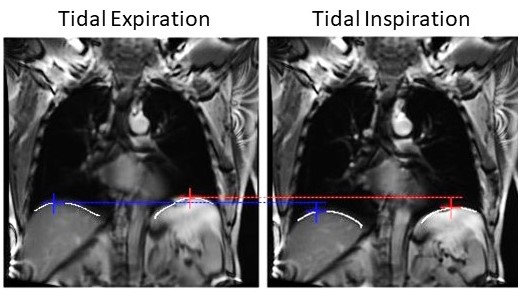
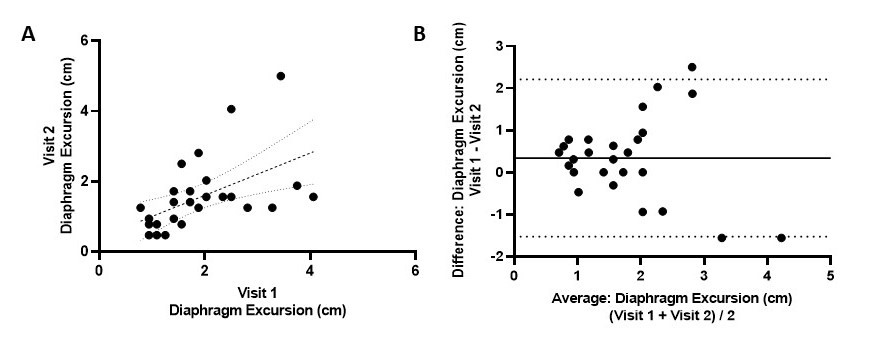
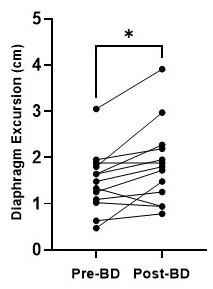
Figure 1 shows a representative image of the lungs in greyscale with the diaphragms identified by the white lines. The tops of the diaphragms are identified by the plus symbols. As shown in Figure 2, diaphragm excursion measured at baseline and 4-months were not significantly different from one another (mean bias=0.34cm; 95% limits of agreement=-1.5cm to 2.2cm; p=0.07) and were correlated (r=0.53, p=0.004). Figure 3 shows that, following bronchodilator administration, diaphragm excursion significantly increased by 0.37±0.40 cm (p=0.01).Discussion
Our results demonstrate that repeatable measurements of diaphragm excursion can be derived from free-breathing 1H MRI in patients with severe asthma. We do note that the agreement between diaphragm excursion measured at baseline and 4-month rescan was not perfect. In addition to measurement error, there are several possible physiological explanations for this. During the 4-month study period, 7 of 9 patients had one or more asthma exacerbations that led to treatment changes and variability in symptoms and disease control between study visits. The bias towards reduced diaphragm excursion at 4-months may reflect worsening of the diaphragm’s range of motion over the course of the study. We also demonstrate the sensitivity of diaphragm excursion measured by free-breathing 1H MRI to changes in lung physiology following bronchodilator administration. Diaphragm excursion was increased following bronchodilator administration, which may be the functional consequence of reduced gas trapping following bronchodilation. Our pilot observations demonstrate the potential utility of free-breathing 1H MRI to measure diaphragm dysfunction and treatment response. Future work will develop and evaluate the physiological significance of other geometric properties of the diaphragm (e.g. slope, height, etc.) as well as temporal information provided by the full breathing cycle (e.g. rate of movement during inspiration and expiration, discordance between left and right diaphragm).Conclusions
Diaphragm excursion measured by free-breathing 1H MRI is repeatable after 4-months and increased following bronchodilator in patients with severe asthma.Acknowledgements
No acknowledgement found.References
1. Lunardi AC, Marques da Silva CCB, Rodrigues Mendes FA, Marques AP, Stelmach R, Fernandes Carvalho CR. Musculoskeletal dysfunction and pain in adults with asthma. J Asthma Off J Assoc Care Asthma. 2011;48(1):105-110. doi:10.3109/02770903.2010.520229
2. Hellebrandová L, Chlumský J, Vostatek P, Novák D, Rýznarová Z, Bunc V. Airflow limitation is accompanied by diaphragm dysfunction. Physiol Res. 2016;65(3):469-479. doi:10.33549/physiolres.933064
3. Kharma N. Dysfunction of the diaphragm: imaging as a diagnostic tool. Curr Opin Pulm Med. 2013;19(4):394-398. doi:10.1097/MCP.0b013e3283621b49
4. Kirby M, Heydarian M, Svenningsen S, et al. Hyperpolarized 3He magnetic resonance functional imaging semiautomated segmentation. Acad Radiol. 2012;19(2):141-152. doi:10.1016/j.acra.2011.10.007
5. Capaldi DPI, Eddy RL, Svenningsen S, et al. Free-breathing Pulmonary MR Imaging to Quantify Regional Ventilation. Radiology. 2018;287(2):693-704. doi:10.1148/radiol.2018171993
6. Canny J. A Computational Approach to Edge Detection. IEEE Trans Pattern Anal Mach Intell. 1986;PAMI-8(6):679-698. doi:10.1109/TPAMI.1986.4767851
Figures