3130
MRI for tissue classification of subcutaneous colon cancer using oxygen enhanced (OE), dynamic contrast enhanced (DCE) MRI and [18F]FAZA PET
Marta Vuozzo1, Max Zimmermann2, Mystele Tendonge3, Petros Martirosian2, Manfred Kneilling4, Fritz Schick2, Bernd Pichler3, and Andreas Schmid2
1Werner Siemens Imaging Center, University Hospital Tübingen, Tübingen, Germany, 2University Hospital Tübingen, Tübingen, Germany, 3Univeristy Hospital Tübingen, Tübingen, Germany, 4Univerity Hospital Tübingen, Tübingen, Germany
1Werner Siemens Imaging Center, University Hospital Tübingen, Tübingen, Germany, 2University Hospital Tübingen, Tübingen, Germany, 3Univeristy Hospital Tübingen, Tübingen, Germany, 4Univerity Hospital Tübingen, Tübingen, Germany
Synopsis
Keywords: Data Analysis, Cancer, Multimodal
Solid tumors exhibit intratumoral heterogeneity, which is related to therapy efficacy. Since biopsies represent a small part of the tumor, multimodal imaging techniques provide panoptic cancer characterization. We developed an acquisition and analysis protocol based on multiparametric MRI to classify and provide a holistic characterization of intratumoral heterogeneity and correlate it with positron emission tomography and histology. We applied MRI to characterize phenotypic changes induced by antiPD-L1 therapy response. Results reveal that models trained exclusively with MRI data provide biologically relevant maps of phenotypes showing intratumoral heterogeneity, but also allow non-invasive identification of tumors that respond or resist to therapy.Introduction
Hypoxia is a common feature of malignant tumors, and is a potential prognostic biomarker for tumor aggressiveness and response to therapy. Assessment of intratumoral heterogeneity is a key issue in precision oncology. As a heterogeneous intratumoral landscape is often associated with therapy resistance and reduced efficacy1, its precise non-invasive characterization may play a critical role for personalized medicine as well as in understanding the mechanisms of pathogenesis and metastatic spread. Previous reports show a direct correlation between oxygen sensitive MRI and hypoxia PET rat models of prostate tumors2. Here, we use multiparametric MRI including T1 and T2* mapping, dynamic contrast enhanced (DCE) MRI and dynamic oxygen-level dependent contrast to characterize tumor tissue. Expression of inhibitory immune checkpoints (ICP, e.g. PD-L1) by tumor cells and immune cells inhibit tumor antigen (TA)-specific T-cells. Consequently, ICP-blockade with specific antibodies is applicable to restore TA-specific T-cell functions. The aim of our study is to establish an efficient MR protocol together with a complementary data analysis during an ICP inhibitor-based immunotherapy in the MC38 mouse model and to monitor the response to immunotherapy, using voxel based computational approaches.Methods
Ten C57BL/6 mice were subcutaneously injected with 5x10⁵ MC38 tumor cells into the right flank. The tumors were allowed to grow for at least 1 week before starting the therapy. One mouse did not develop any tumor and was excluded from the study. The therapy was intraperitoneally injected using 200 µg of antiPD-L1 (clone: 10F.9G2) monotherapy 3 times a week for 3 weeks. Responding vs non responding tumors were manually assigned according to tumor growth within 1 week of treatment. The animals were injected intravenously with 11±1 MBq of [18F]FAZA and scanned for 10 min after 2 hours of awake uptake using a dedicated small animal PET scanner. After T2-weighted (T2w) anatomical images, we performed blood oxygen level dependent (BOLD) and tissue oxygen level dependent (TOLD) MRI while applying a 100% oxygen gas breathing challenge, followed by a Gd-based DCE assessment of perfusion. For these purposes, T1 maps, T2* maps, and an alternation of T1w and T2*w images were acquired pre, post and during the gas challenge to reconstruct contrast dynamics and then generate wash in maps. The resulting static PET images were aligned and up-sampled to the voxel-size of the MRI parameter images of the T1w and T2*w images. Tumor regions of interest were drawn on the T2w anatomical images using Inveon Research Workplace. PET data of each tumor were normalized by the injected activity. Supervised (SVM) and unsupervised (kmeans, Gaussian-mixture models) clustering methods were applied to the voxel data using Matlab.Results
Figure 1 illustrates PET and MRI pipeline and a representative image series of all the mentioned maps for a representative mouse. Tumor size was measured over time to separate between therapy responders vs non-responders (figure 2A). Tumor volumes varied strongly between responders (14.5 ± 23.3 mm3) and non-responders (548.2 ± 217.8 mm3) at the endpoint of the study. When comparing responders and non-responders we observed no differences in the mean values of the T1 and T2* maps if comparing pre and post oxygen acquisitions, T1w oxygen and contrast agent dynamics. However, we observed a significant difference of the T2* wash in map when comparing responders and non-responders (p < 0.001). Using the voxels from all the tumors, we tested the applicability of k-means and GMM clustering to the heterogeneous pool of parameters obtained from all generated maps. We observed that GMM using 2 and 3 clusters appears as the most reliable method of unsupervised clustering. We then apply a Neural Network (NN) using 2 and 3 neurons for clustering and we observed a really good separations of voxel compared to the manually assigned responders vs non-responders when using 3 neurons (figure 2B). However, when we performed a performance test, we observed a better performance when using 2 neurons. We obtained high specificity and sensitivity of the method as shown by the ROC curve (Figure 2D). We also observed that T1- and T2* wash in maps are the main contributors in the algorithm training. MR prediction of PET needs further evaluations.Discussion and Conclusion
Within this project, we established a novel analysis pipeline to assess the intratumoral heterogeneity voxel-based using MRI and correlate with PET. Further, we plan its clinical translation by applying a similar protocol to patients. To the best of our knowledge, this study is the first to use the synergistic value of multiple MRI parameters to correlate with PET and determine the intratumoral heterogeneity in preclinical models. The major limitation of our study was the restricted sample size, which so far did not allow a specific validation study. Further, in depth validation of the method was impaired by the strong difference in tumor growth between responding and non-responding tumors. Still, the pipeline is established to conduct these studies.Acknowledgements
Funded by the Deutsche Forschungsgemeinschaft (DFG, German Research Foundation) under Germany’s Excellence Strategy - EXC 2180 – 390900677References
[1] Junttila, M. R. & de Sauvage, F. J. Influence of tumour micro-environment heterogeneity on therapeutic response. Nature 501, 346–354 (2013)
[2] Zhou H, Chiguru S, Hallac RR, Yang D, Hao G, Peschke P, Mason RP. Examining correlations of oxygen sensitive MRI (BOLD/TOLD) with [18F]FMISO PET in rat prostate tumors. Am J Nucl Med Mol Imaging. 2019 Apr 15;9(2):156-167. PMID: 31139498; PMCID: PMC6526364.
Figures
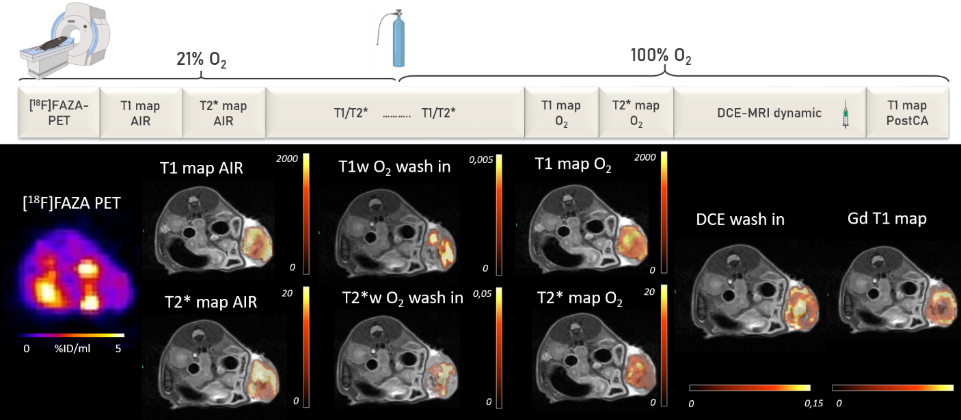
Figure 1. Study
protocol and representative animal data. Top row: imaging protocol and oxygen
challenge. Bottom row (from left to right): transaxial image slice selected from 3D PET data set
to match MRI maps. T1 maps calculated using variable flip angles technique, T1-, T2*- and DCE- wash in maps calculated using the linear regression of the
first 2 mins after O2 challenge. T2* maps were calculated using MGE sequences.

Figure 2. Tumor growth ratio and Neural Network clustering using 3
neurons. (A) Tumor
growth ratio based on the calculation of the tumor volume ratio within 1 week
of difference based on the MC38 cells time of doubling, (B) NN assignement using 3 neurons, in green
are the voxels manually assigned based on tumor growth ratio separation and in
blue are the ones assigned from the computer based approach (R=responders; NR: non responders), (C) validation
performance test for the NN using 2 neurons, (D) ROC curve describing the specifity
and sensitivity of the method.
DOI: https://doi.org/10.58530/2023/3130