3129
Identification of Subject-Specific Motion Variations via Atlas-Based Deformation Refinement from Real-Time MRI1Radiology, Harvard Medical School, Boston, MA, United States, 2University of Illinois at Urbana-Champaign, Champaign, IL, United States, 3East Carolina University, Greenville, NC, United States
Synopsis
Keywords: Data Analysis, Data Analysis, Speech, motion analysis, atlas
Dynamic magnetic resonance imaging has become increasingly efficient at capturing speech deformations of the velopharyngeal region in real time. With previously developed dynamic vocal tract atlases, quantification of group deformation statistics of a population in speech has become possible in a common atlas space. However, subject-specific deformation characteristics as an underlying property tend to be hidden in the spatial and temporal alignment process of atlas construction. We present a registration-based deformation characterization method that extracts subject-specific motion variations in two layers of registration steps. A dataset of fifteen human subjects is processed to reveal unique deformation patterns of each subject.Introduction
Fast magnetic resonance imaging (MRI) has facilitated tissue motion acquisition [1,2] and enabled analysis in real-time applications such as speech imaging [3]. Dynamic MRI atlases have been constructed for multi-subject data normalization [4,5] including temporal alignment to synchronize different subjects’ motion speed [5,6] and spatial alignment to align tissue structures [4,7]. However, small deformation variations when producing the same speech remain unobservable in an atlas. These are considered unique motion characteristics, specific to a subject, and are hidden in the four-dimensional (4D) image sequence due to efficient warping in atlas construction. We propose a registration-based method to warp all subject data into the atlas space before an additional refinement registration. The first registration accounts for general anatomical differences in the speech task and the second registration extracts unique motion features of a specific subject, which are then analyzed and visualized as group statistics.Methods
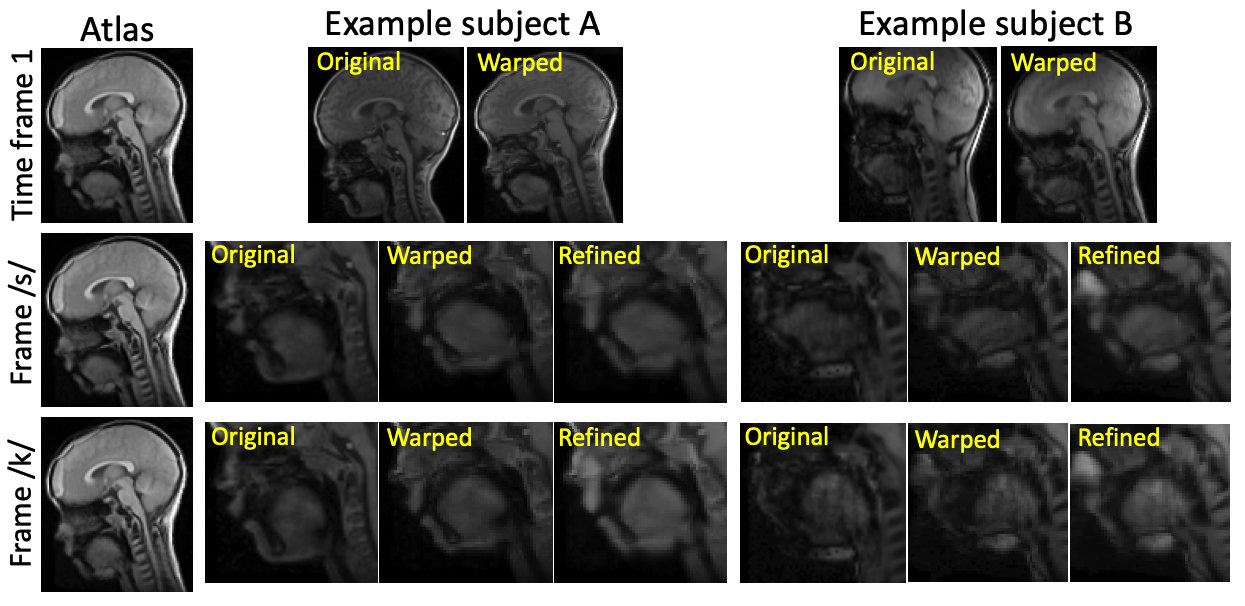
Real-time MRI of 15 human subjects in speech were acquired, yielding a sequence of 128×128×10 image volumes with a resolution of 1.875×1.875×6 mm3 for each subject. The speech task producing “Sissie is at school” resulted in a different temporal length for each sequence, but the previously proposed temporal alignment step ensured that all sequences were equalized into the same length of a 96-frame interval with the same speech tempo [6]. A 4D dynamic atlas was constructed by combining all sequences from 15 subjects [5], represented by $$$I_a(\mathbf{X},t),1 \leq t \leq 96$$$ in one common spatiotemporal space $$$(\mathbf{X},t)$$$. For the first registration, we used the first time frame as reference. A subject’s global anatomical difference was extracted using a diffeomorphic registration method [8] and was represented by its deformation field $$$\mathbf{d}_s(\mathbf{X},t),t=1$$$ between every subject image $$$I_s(\mathbf{X}_s,t)$$$ and the atlas $$$I_a(\mathbf{X},t)$$$, both at time frame $$$t=1$$$. Note that $$$\mathbf{X}_s$$$, the 3D grid in each subject’s space, was converted to the common grid $$$\mathbf{X}$$$ in the atlas space through registration $$$\phi_s(\mathbf{X},t) = \mathbf{X} + \mathbf{d}_s(\mathbf{X},t)$$$ [9]. Thus, 15 deformation fields $$$\mathbf{d}_s(\mathbf{X},1)$$$ connecting each subject to the atlas were computed containing their global anatomical features. Next, we used each deformation field to warp all successive time frames to the atlas space, eliminating this general anatomical difference, i.e., $$$I^w_s(\mathbf{X},t)=I_s(\phi_s(\mathbf{X},1),t) = I_s(\mathbf{X} + \mathbf{d}_s(\mathbf{X},1),t),2 \leq t \leq 96$$$. Hence, besides temporal alignment, the warped images $$$I^w_s(\mathbf{X},t)$$$ further removed any spatial difference so that they were a very close approximation to the atlas. And any remaining differences were regarded as deformation variations unique to each subject. Finally, this remaining difference was extracted using a second refinement registration step, i.e., $$$I^r_s(\mathbf{X},t)=I^w_s(\phi^w_s(\mathbf{X},t),t) = I^w_s(\mathbf{X} + \mathbf{d}^w_s(\mathbf{X},t),t),2 \leq t \leq 96$$$. Note that $$$\mathbf{d}^w_s(\mathbf{X},t)$$$ was computed by a frame-by-frame registration between the warped images $$$I^w_s(\mathbf{X},t)$$$ and the atlas $$$I_a(\mathbf{X},t)$$$ so that the total number of operations was 95×15 instead of using only time frame 1. The images $$$I^r_s(\mathbf{X},t),2 \leq t \leq 96$$$ were considered the best match to the atlas so that all subject-specific variations were represented in $$$\mathbf{d}^w_s(\mathbf{X},t)$$$. Figure 1 shows two example subjects processed using this proposed pipeline.Results and Discussion
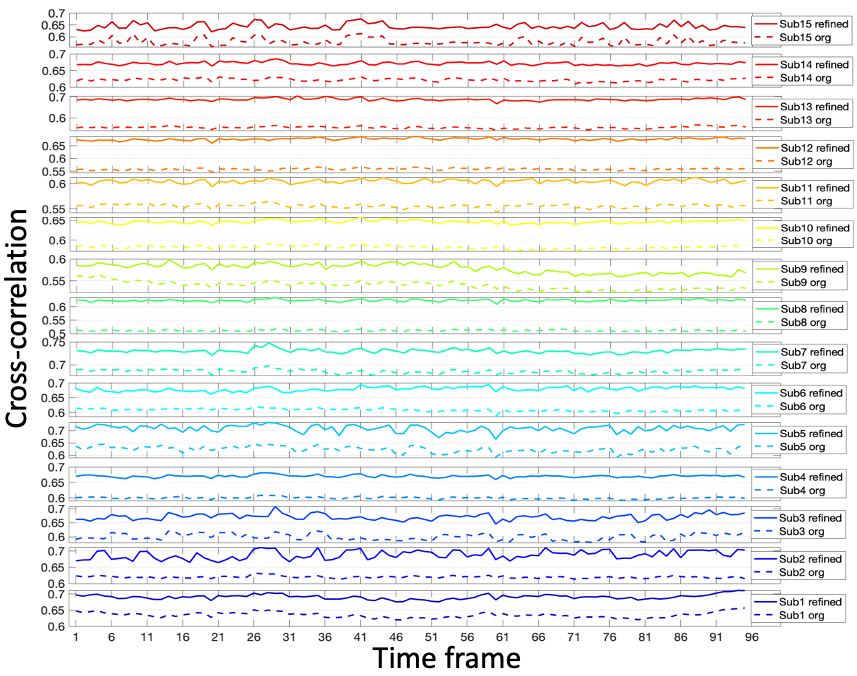
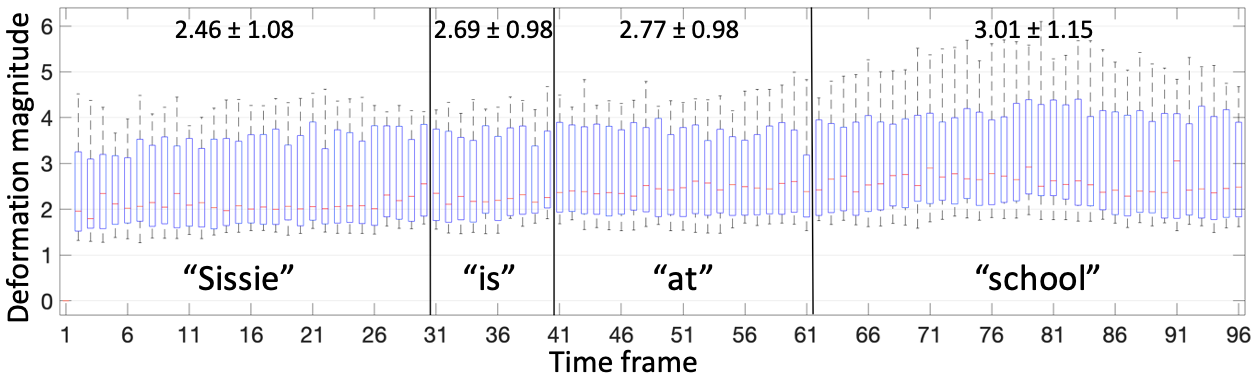
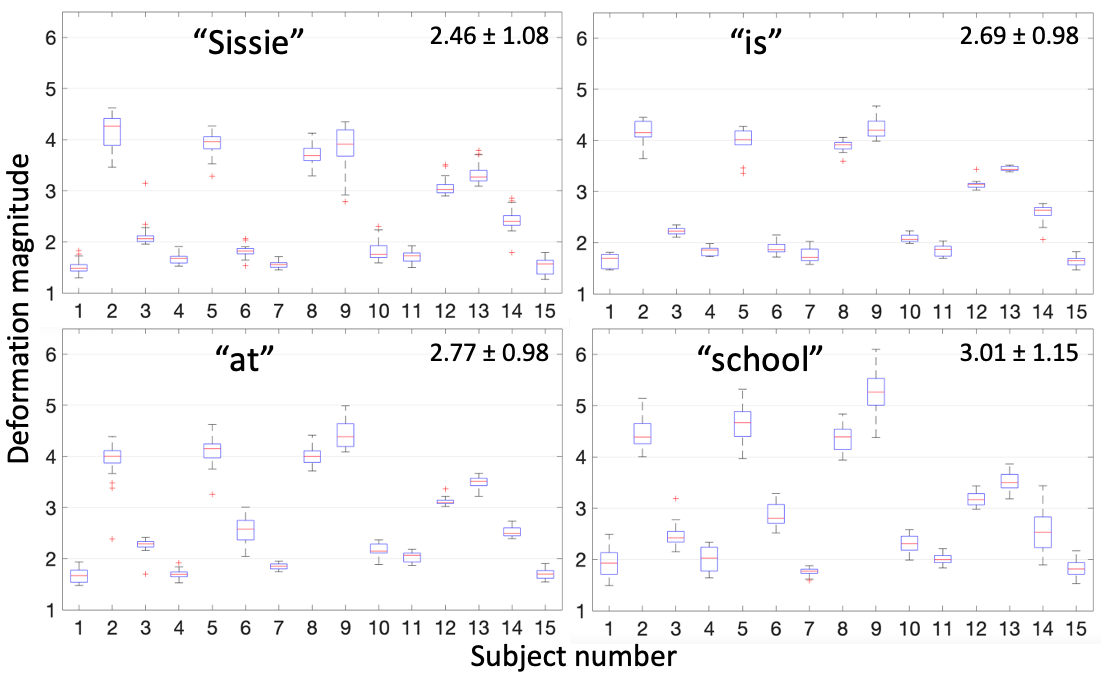
Sample images in the mid-sagittal view of the volumes in our proposed process are shown in Figure 1 at three selected time frames: the initial time frame 1, the time frame pronouncing /s/ with a forward motion, and the time frame pronouncing /k/ with an upward motion. The atlas is shown in the first column. Two sample subjects out of all 15 are shown of their original images and registered images to match the atlas. Except for time frame 1, all the following time frames have both an initial warped version (1st registration) and a refined version (2nd registration). The refined images were better aligned to the atlas than the first warped version, confirmed by Figure 2 showing the cross-correlation similarity between the registered images and the atlas at 95 time frames for all 15 subjects. Cross-correlation at every time frame was increased by the refinement registration (solid curve) compared to the first warp (dashed curve) with its mean increased from 0.59±0.04 to 0.66±0.04. To visualize subject-specific deformation features, we plotted the magnitude of the refinement deformation fields $$$\mathbf{d}^w_s(\mathbf{X},t)$$$ of all subjects at each of the 95 time frames. Figure 3 shows the entire speech task sectioned by each word with the mean and standard deviation of the magnitude. The mean magnitude steadily increased over time indicating increasing subject variations as the speech task proceeded, and longer words had larger standard deviations than shorter words. Figure 4 shows the magnitude of all time frames plotted for each subject at each speech section, indicating that any subject (such as 2, 5, 8, and 9) who had a higher variation from the atlas stayed consistent over all speech sections and vice versa. Subjects tended to maintain their unique velopharyngeal deformation pattern and variation for the entire speech task.Conclusion
We presented a two-step registration-based analysis on multi-subject speech MRI data to separate global deformation and subject-specific deformation during speech. Unique deformation patterns of each subject were identified in various speech task sections, quantitatively distinguishing independent subject properties statistically to aid in clinical MRI assessments.Acknowledgements
This work was supported by NIH R01DE027989 and R01DC018511. The content is solely the responsibility of the authors and does not necessarily represent the official views of the National Institutes of Health.References
[1] Fu, M., Barlaz, M. S., Holtrop, J. L., Perry, J. L., Kuehn, D. P., Shosted, R. K., ... & Sutton, B. P. (2017). High‐frame‐rate full‐vocal‐tract 3D dynamic speech imaging. Magnetic resonance in medicine, 77(4), 1619-1629.
[2] Lingala, S. G., Sutton, B. P., Miquel, M. E., & Nayak, K. S. (2016). Recommendations for real‐time speech MRI. Journal of Magnetic Resonance Imaging, 43(1), 28-44.
[3] Jin, R., Shosted, R. K., Xing, F., Gilbert, I. R., Perry, J. L., Woo, J., ... & Sutton, B. P. (2022). Enhancing linguistic research through 2‐mm isotropic 3D dynamic speech MRI optimized by sparse temporal sampling and low‐rank reconstruction. Magnetic Resonance in Medicine.
[4] Woo, J., Xing, F., Lee, J., Stone, M., & Prince, J. L. (2018). A spatio-temporal atlas and statistical model of the tongue during speech from cine-MRI. Computer Methods in Biomechanics and Biomedical Engineering: Imaging & Visualization, 6(5), 520-531.
[5] Woo, J., Xing, F., Stone, M., Green, J., Reese, T. G., Brady, T. J., ... & El Fakhri, G. (2019). Speech map: A statistical multimodal atlas of 4D tongue motion during speech from tagged and cine MR images. Computer Methods in Biomechanics and Biomedical Engineering: Imaging & Visualization, 7(4), 361-373.
[6] Xing, F., Jin, R., Gilbert, I. R., Perry, J. L., Sutton, B. P., Liu, X., El Fakhri, G., Shosted, R. K., & Woo, J. (2021). 4D magnetic resonance imaging atlas construction using temporally aligned audio waveforms in speech. Journal of the Acoustical Society of America,150(5), 3500-3508.
[7] Woo, J., Xing, F., Lee, J., Stone, M., & Prince, J. L. (2015, June). Construction of an unbiased spatio-temporal atlas of the tongue during speech. In International Conference on Information Processing in Medical Imaging (pp. 723-732). Springer, Cham.
[8] Avants, B. B., Tustison, N., & Song, G. (2009). Advanced normalization tools (ANTS). Insight j, 2(365), 1-35.
[9] Vercauteren, T., Pennec, X., Perchant, A., & Ayache, N. (2007). Non-parametric diffeomorphic image registration with the demons algorithm. In International Conference on Medical Image Computing and Computer-Assisted Intervention (pp. 319-326). Springer, Berlin, Heidelberg.
Figures